Hello Steemians, I want this use this opportunity to thank the Steemit Crypto Academy for the wonderful lessons they have provided so far about cryptocurrency. I have acquired a deep understanding of cryptocurrency through the lessons provided by the crypto professors and also by carrying out the tasks.
In this post, I will be performing my task on chart patterns. This is a wonderful lesson provided by @stream4u.
Chart Patterns
As traders or investors, it is crucial to have a good understanding of technical analysis. Technical analysis can be based on the use of chart patterns (price actions), indicators, price volumes in making trading decisions.
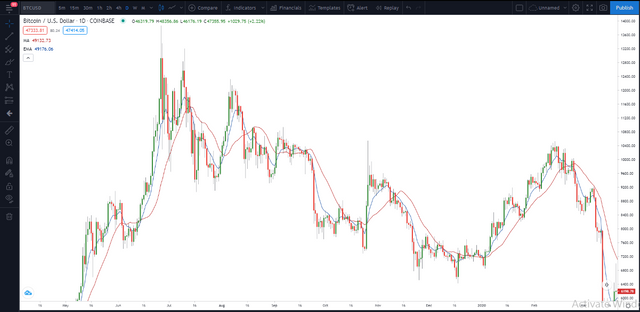
The picture above represents the candlestick chart pattern of XRP/USD. This chart pattern displays the information on the price movement of this particular across all time frames. Chart patterns are created as a result of buying and selling pressures of the market. These buying and selling pressures create areas of support and resistance which can help a trader make trading decisions when the next price comes to these levels.
Chart patterns can assist a trader in the following ways:
• It gives a trader an insight on the market direction e.g Whether the price is trending upward, trending downwards, or ranging.
• It gives a trader a proper indication of when to buy and when to sell.
• It gives the trader information on entry and exit levels.
• It can also help a trader to minimize potential risks in the market.
In the technical charts, there are two types of chart patterns, continuation patterns, and reversal patterns. Similarly, we also have a breakout pattern in the technical analysis which I will explain in the next chapter.
Price Breakout
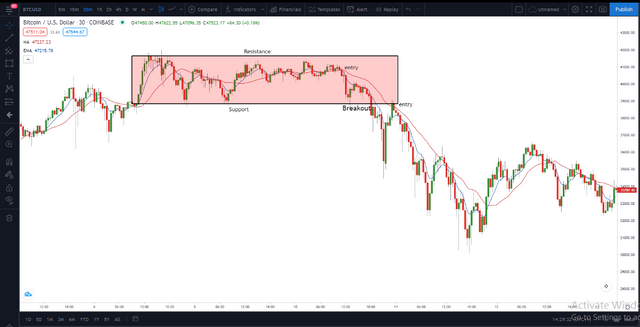
Price breakout always happens in a ranging markets where price always bounces off support and resistance before breaking out either to the upside or to the downside. Price breakout can be a continuation of an original trend or a reversal of an original trend.
Some traders trade breakouts but it is risky to trade breakouts without proper confirmation. Breakout traders are mostly trapped by market manipulations. Good candlestick analysis can help breakout traders in making good trading decisions.
Continuation patterns
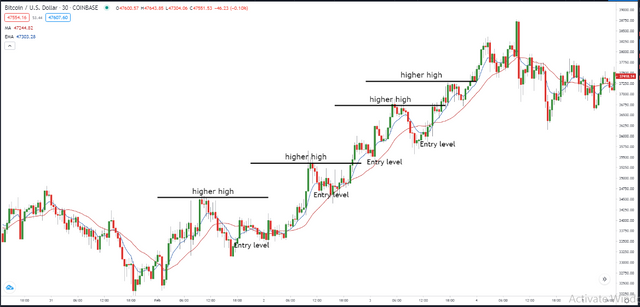
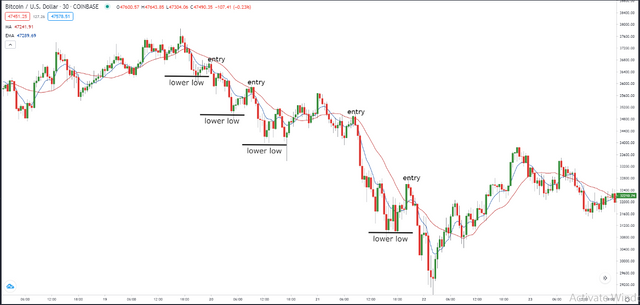
The price of a commodity moves in a zig-zag pattern creating either higher highs, higher lows, lower highs, or lower lows formation. As a technical analyst, it is essential to know this price movement for better trading decisions. Continuation patterns are those patterns created in the market which shows that price is still respecting its original direction after a little retracement. Continuation patterns form higher highs and higher lows for an uptrend and lower highs and lower lows for a downtrend.
Higher High Pattern
Higher High patterns occur in a bullish market (uptrend) where there's high buying pressure than selling pressure. In a higher high pattern, the price always moves higher creating a new high than the previous high after a retracement. Traders take advantage of this pattern buying at the low of the retracement.
Lower Low Pattern
Lower low patterns are created in a bearish market (downtrend) where there's high selling pressure than bullish pressure. In a lower low pattern, price always creates a new low after a retracement move. Traders often open a sell position at the high of the retracement move.
Reversal Pattern
Reversal patterns always occur after the exhaustion of a trend. As a result, prices fail to create a new high in an uptrend or fail to create a new low in a downtrend. Reversal patterns occur after a price rally in a certain direction. Maybe the price is overbought or oversold and needs to reverse back to the opposite direction. The reversal pattern can be spotted with a double top formation for an uptrend and a double bottom formation for a downtrend.
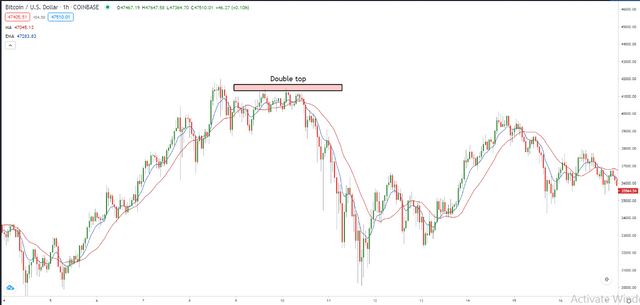
Double Top
A double top pattern occurs in an uptrend when the market fails to create a new higher high. Double top formation indicates that selling pressure is high and the market is about to reverse in the opposite direction
The picture above is a chart of BTC/USD. Notice how the price reversed to the opposite direction after the formation of the double top. Traders can capitalize on a double top formation by selling after the second leg of the double top.
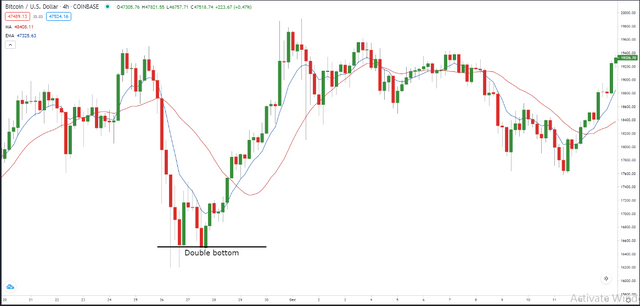
Double Bottom
This is similar to the double top but is formed during a downtrend. In a double bottom, price fails to create a lower low signaling a reversal to the upside. A good entry opportunity is to buy at the second leg of the double bottom.
Importance of stoploss
Due to the high volatility of the crypto market, price is always moved by the sentiments of investors. Therefore, a trader can be wrong about the direction of the market. Stoploss helps to get a trader out of the market when the market is going against his prediction. This can help you to protect your funds and avoid huge losses.
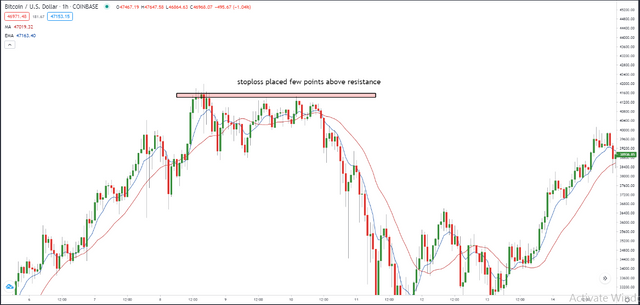
Where to find and how to set a stop-loss
The market creates support and resistance zones in a trend by creating higher highs and lower lows. Whenever price breaks above a resistance level in a downtrend, it signaling a reversal in trend. Similarly, price breaks below a support level, signaling a reversal and violation of the current trend. It is advisable to place stop-loss a few points below the support level or few points above the resistance level. The reason is that support and resistance give you an edge about the market direction. When the support and resistance are broken, it simply means that there's a reversal in the current trend and therefore you need to get out of the market.
In conclusion, chart patterns are very essential in the technical analysis of the market. Recognizing the formation of these patterns helps you to make better trading decisions and gives you information on when to buy or sell. Trading is predictive and a trader Is not always right in his decision, therefore it is recommended for a trader to use stop-loss to protect him when the market is against his decision.
Note: All the pictures used in this post are screenshots taking from my Tradingview account.
Thank you @stream4u for this amazing lesson.

Hi @reminiscence01
Thank you for joining Steemit Crypto Academy and participated in the Homework Task 3.
Your Homework task 3 verification has been done by @Stream4u.
Thank You.
@stream4u
Crypto Professors : Steemit Crypto Academy
Downvoting a post can decrease pending rewards and make it less visible. Common reasons:
Submit
Thank you professor @stream4u.
I will implement your comment in my next post.
Downvoting a post can decrease pending rewards and make it less visible. Common reasons:
Submit