

Hi guys, today I’ll be talking about another moving average indicator. This is a moving average indicator that is known for its good qualities since it operate on calculations that makes use of the less complex Simple moving average indicator. The answers to the below questions of this task are gotten from the knowledge of the lesson from professor @fredquantum.


The TRIMA indicator is amongst the moving average indicators that were created to solve the problems faced with the earliest moving average indicator. Some of these categories of new moving average indicators that are solving the problem of lagging are the Exponential Moving Average Indicator, Smoothed Moving Average, Triple Exponential Movong Average and also the TRIMA.
The Simple Moving Average indicator marks the fundamentals of the moving average indicators and is used as the basis for understanding the TRIMA. The Simple moving average works on the average values of the price movement. The Simple Moving Average moves as a line on the price chart following the oscillation and f the price with time. This same activity is seen with the TRIMA. The TRIMA forms a line on the price chart that follows the price oscillation with time. The TRIMA is built such that it provides smoothed version of the Simple moving average and avoid noise and false is you the price action. This allows the TRIMA not to react too quickly to price changes hence giving the indicator more accuracy than the initial Simple moving average.
The TRIMA provides a double smoothed Avearge of the price of an asset and this is displayed on the price chart. With such smoothing capacity, the TRIMA can avoid giving false signals from highly volatile market as it slowdown the likely quick reaction of the moving average indicators like that of the Simple moving average. We can assign the TRIMA to be a more accurate form of our Simple moving average that can prevent lagging and also identify trends on our charts. This indicator can serve as a look out for entry and exit points on the cryptocurrency price chart.
1). It double-average the prices of assets in a given period of time to avoid false signals
2). It’s very good to use for confluence with other indicators especially to trade price reversals.
3). TRIMA provides clear identification of trends such that it tells when a trend is in progress or has ended.
4). The TRIMA indicator avoids quick reaction to market volatility such that it prevents providing false information.


To set up a crypto chart with this indicator (TRIMA) one has to get into a trading platform and add the TRIMA indicator to the chart. I will do this process in simple steps below with. On this exercise I will work on Tradingview which is popular trading side.
To add the TRIMA indicator on my chart via this platform, I’ll click on “indicators” on the chart page and on the next page that appears I’ll take on the search bar and type out Triangular Moving Average. When this must have been done I will simply click on the name of my indicator that appears. We can add the indicator more than once if we wish to. At this point I will have to configure my indicatir setting to suite my analysis. Here I will change the length from the customized length of 9 to my preferred length of 20 in which I will chose for this case. The two screenshots will describe this prices very clearly.


Like I made mention on the introduction of the TRIMA indicator we now know that it functions just like that of the calculations of the SMA but with the difference that it provides a double-average of the price a certain time period. Since the TRIMA is a double smoothed version of the SMA, therefore the formula of TRIMA will include that of the SMA within. Below is an expression of the SMA and how it plays its part in the calculations of theTRIMA.
The expression of SMA is given by;
SMA= (P1 + P2 + P3 + P4 + P5... + Pn)/n
Where from P1 to P5 are the price of our asset at the respective periods while “Pn” stands for the price of our asset at the last period and “n” stands for the total number of period used.
With the above SMA we can now look for the TRIMA. Remembering that I said the SMA is part of the TRIMA and should be involved in the formular of the TRIMA indicator due to the functionality of both.
The expression of the TRIMA indicator is given by;
TRIMA= (SMA1 + SMA2 + SMA3 + SMA4 + SMA5... + SMAn)/n
The reason I have used SMA1 to SMA5 is because we started working with P1 to P5. To make this easier to read, the TRIMA can be expressed by;
TRIMA= sum(SMAs)/n
The “SMAs” stands for the combination of all the SMA values for the different periods.


The TRIMA indicator likes most of the moving average indicator is also used for trend identification. The way the length of the TRIMA is set up can cause the identity of trend to be more visible as well as can make it more difficult to read and interpret. If the period ok which the indicator is set is made very small, the indicator line will move close to the price such that it will become even more difficult to observe the price trend from the TRIMA line and this will make trend identification very complex. To solve this complex nature one has to set the period at a higher scale so that the TRIMA moves below or above the price giving the trader a clear view of the trend.
When we have the price trading in an uptrend, the TRIMA will be below the price such that the distance it keeps from the price is made very clear.

For a downtrend the price trades below the TRIMA indicator and the distance between the two is seen clearly to maintain itself until the trend gets some weakness.

When trading trends, the TRIMA indicator can be a very useful weapon to your trading warfare. Whenever the TRIMA indicator plunges upward such that it cuts through the price, it’s considered to form a bearish market structure and the opposite works for a bullish market structure.


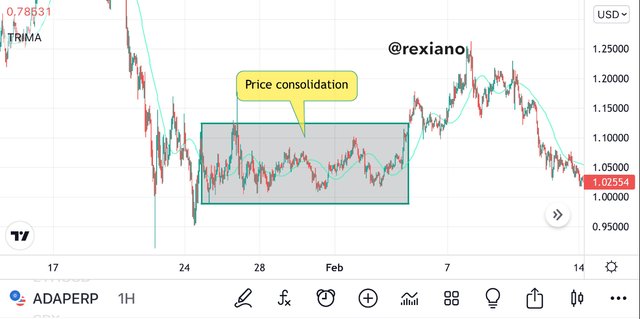
During a consolidating market phase, the TRIMA indicator can be a very good tool to post a mark on such market movements. Price consolidation takes place when the price trades within a certain price range such that it forms a resistance and support levels. I’m such markets, the TRIMA indicator is seen within the price such that the price oscillates on the TRIMA with time. This is to say that the bulls and bears are showing an equal amount of market momentum such that none has overpowery the other.

From the above screenshot we can see how the ADAUSDT price trades in a range and crosses the TRIMA upward and downward in an oscillation. Before this consolidation we have a downtrend and after the consolidation we have an uptrend and this means the bears lost their grub during the consolidation while the bulls took over the market.
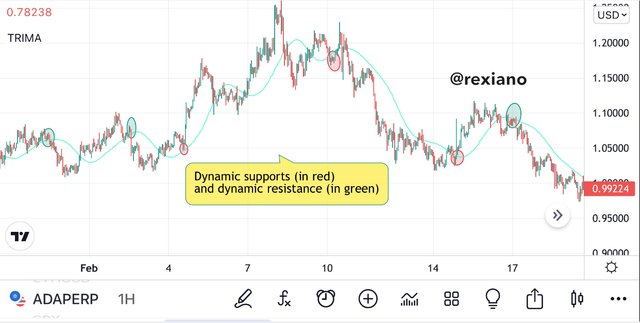
The same way we see the other moving average indicators acting as dynamic support/resistance identifying tools, so is the TRIMA indicator. When we see the TRIMA indicator at most points receiving price bounce on it we can identify a support or a resistance. When the TRIMA indicator moves below the price indicating an uptrend we will likely see that the price at most points will trade and touch the TRIMA line before making a rebound and this point forms a support level. When we have the TRIMA moving above the price chart indicating a bearish trend, we notice how the price hits the TRIMA from below and returns to the bottom. This point forms the resistance level of the market.

We can see on the above chart that the dynamic support (in red) and the dynamic resistance (in green) occur on the TRIMA with the price movement.


The same way we can use two exponential moving average to understand crossover scenarios ok the price chart so can we use two TRIMA to understand crossover signals. The ability for the TRIMA indicator to be slow to response to high market volatility has caused it to slowdown such that it may not immediately give signals all the time in time. To solve this we have to employ a multi TRIMA indicator such that we have at least two TRIMA on our chart.
The two TRIMAs have to be in different periods such that they can move apart on the price chart and avoid complexity on the chart. On this exercise I will use a 15 period and a 30 period TRIMA. When both TRIMAs crossover, we have entry signals and exit signals which can help in making up a trade exit and entry criteria. I will explain the crossover but and the crossover sell scenario.
For a “Buy” crossover, the higher period TRIMA should be above the price movement and be below the smaller period TRIMA. This means that when the smaller period TRIMA crosses the larger period TRIMA to the up side, we have ea buy signal and a bullish market.

We can see how the TRIMA on the ADAUSDT trading pair showed a buy signal from the crossover of the smaller period TRIMA (TRIMA 15) into the upside. This happens on the above chart twice such that the buying signal is a continuation of the previous one.
In the case of the sell crossover on the price chart, we have the smaller period TRIMA crossing the higher period TRIMA and heads below the price. This happens to give way for a bear market.

From the screenshot above we can see how the larger period TRIMA (TRIMA 30) crosses over the smaller period and indicating a sell signal which went a long way down the trend.


Just as we use other moving average indicators together with other filter indicators most of which are the momentum indicator, we can also use the TRIMA in confluence with other indicators. Since the TRIMA is calculated such that it’s slow to react to market volatility, another indicator such as the RSI will assist in signal recognition while the TRIMA takes it time to provide and confirms the signal from the RSI indicator. I’m this case we sue the two TRIMA method and combine it with the RSI indicator for signal clarification.
We can consider the following conditions or criteria for trading with two TRIMA and an RSI indicator in place for a bullish reversal market.
1). The two TRIMA should be added to the chart and the RSI also.
2). During an downtrend we have to wait for the RSI to enter the oversold region in order to expect a reversal signal.
3). For an uptrend reversal, the smaller period TRIMA has to cross over the larger period TRIMA. After this crossover we wait for at least two candlesticks to form on the upper side of the trend side.
4). For the exit criteria, stop loss should be set just below the immediate dynamic support. The take profit can be made on a 1:2 risk reward ratio such that you only make profits of at least twice what you are ready to lose from a trade.

From our chart above we can see how the RSI indicator showed an oversold signals indicating a bullish reversal. This reversal was confirmed by the crossing of the smaller TRIMA to the upside. The stop loss and take profits are set on 1:2 risk reward ratio.
We can consider the following conditions or criteria for trading with two TRIMA and an RSI indicator in place for a bearish reversal market.
1). During an uptrend, we make sure the RSI gets into the overbought region in order to expect a bearish reversal.
2). The smaller period TRIMA has to cross the larger period TRIMA to the down side. This means that the larger period TRIMA will have to cross over the smaller period TRIMA line. After this happens we have to wait for at least two candlesticks to form below just after the crossover.
3). We place stop loss just above the immediate dynamic resistance and a take profit two times our stop loss marking a 2:1 risk reward ratio.

Looking at the above screenshot we see that the RSI confirms the overbought region which is indicative of a bearish reversal. This is confirmed by the TRIMA indicator such that the larger period TRIMA crosses the smaller TRIMA. An entry Optus seen and a 1:2 risk reward ratio set such that the stop loss is just above the immediate resistance.
The Moving Average Comvergence Divergence can also be used in confluence with the TRIMA indicator.
When the oscillation lines on the MACD are above the histogram zero line, we have a bullish market and when they are below the zero line we have a bearish market. When the MACD and the TRIMA gives the same signal or whenever they agree on a particular trend, we have a good entry signals.

We can see from the above screenshot that the MACD trades above the zero line and the TRIMA indicator confirmed it be the crossing of the smaller period TRIMA over the larger period TRIMA. On the others section with red arrow on the screenshot, we have a downtrend opportunity which was confirmed by the MACD as it trades below the zero line and the TRIMA of higher period crosses the TRIMA of lower period.


On this exercise I will place two trades one of which will be for a bearish reversal and the other for a bullish trend reversal. I will add two TRIMA to my price chart and also add the filter indicator which I will use the RSI indicator for this purpose.
I will carry out a TRIMA plus RSI analysis on the SHIBUSDT pair and detect when the RSI moves into the range of oversold and the TRIMAs cross with the smaller period TRIMA moving over the larger period TRIMA for my bullish entry.

We can see on the above screenshot that the SHIBUSDT pair experienced a crossover of the smaller TRIMA like crossing the larger TRIMA line and this happens after the RSI went to the oversold region and heading back to the overbought. The screenshots below are the trade exit criteria and the trade progress after placing the long position trade on my Binance account.


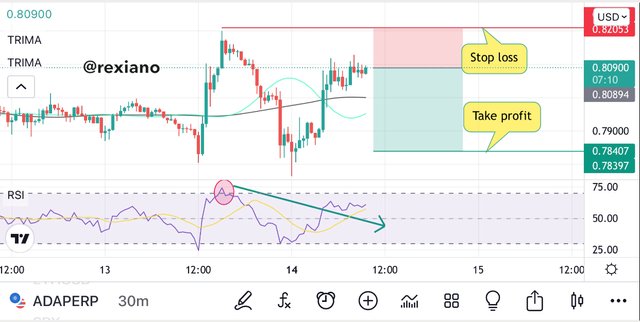
I will carry a trade analysis on another trading pair which is the ADAUSDT trading pair. This time around I will wait for the bearish reversal signal to come from the market using my TRIMAs and RSI indicator. Just as explained on the other section I will follow keenly and make entry when the larger period TRIMA crosses over the smaller period TRIMA and also look for confirmation from my RSI indicator.

We can see that the price trades and causes the RSI to trade in the overbought region while the larger TRIMA moves over the smaller period TRIMA confirming a short position entry. I placed my entry and the exit criteria is based on the immediate support and resistance identification on the price chart. This can be seen on the following screenshots also.


| Advantages | Disadvantages |
|---|---|
| Can be used in confluence with other indicators | Can be slow in identifying drastic moves on volatile markets |
| Provides double-smoothed average of an asset | Requires proper configuration before use |
| Easy to interpret signals from the price chart | Bot effective to use alone since it may give signals later than when the market already made moves deep into the direction |
| Good for trend identification | signals are often after the market |
| Can best identify dynamic support and resistance levels |


The TRIMA indicator is a moving average indicator which provides the trader with the double-smoothed average of an asset of interest at specific periods. This indicator solves the problem of lagging that appears to be common with the SMA indicator. Upon identifying trends on the price chart, the TRIMA indicator can be a very useful tool in technical analysis. This indicator can be used to get buy/sell signals when you apply two TRIMA of different periods and on a particular price chart such that the two TRIMAs crossover each other from time to time giving buy and sell signals as well as exit criteria. Following the dynamic support/resistance that this indicator tool showcases, we can make a very suitable exit criteria.
Despite the good qualities of the TRIMA indicator, it’s also found helpful when using this indicator together with other filter indicators such as the RSI and other momentum indicators.