

Hello steemians. Welcome to my task on Fibonacci tools. This is a task based on the questions given after the lesson by professor @pelon53. This task deals with Fibonacci retracement and Fibonacci extension and how they are practically used and calculated during technical analysis in trading.


The Fibonacci tools as a whole dates as far back as the life time of the Italian mathematician who came up with this combination of numbers. This individual is known as Leonardo who performed the Fibonacci series of numbers which are now used for the calculations of Fibonacci tools in several different aspects.
This number series is done in a sequence such that the second number is a sum of the previous two numbers. Let’s say begin counting from zero “0” and we’ll have the the second number to be “1” and the third will still appear as “1” because 0+1 stills lands us at one. A short series of these numbers can be given as 0,1,1,2,3,5,8,13……until infinity.
In another mode of calculation, Leonardo discovered that in a series of numbers if you divid the series by the previous number you’ll have a common ratio of 1.618 and this ratio is the key to the Fibonacci tools as well as it stands as the golden ratio. Nature has more natural effects that meets this golden ratio and it’s inverse which is 0.618. This has been seen on different calculations in nature such as some parts of the human body measuring to this value.
With the understanding of the Fibonacci golden ratio, I will get into explaining the Fibonacci retracement tool as used in technical analysis when carrying out trading activities on the financial markets. People have believed that nature follows the Fibonacci rules and so should the financial market activities since it’s controlled by the emotions of traders who are humans and are bound to act accordingly as humans would.
On price charts the movement of prices is always in sideways movements such that one can quickly identify price oscillation all through. If the price tends to move in an uptrend, it will do so but not in a straight readable line. On this angle, the price will travel upwards while forming pullbacks to gain momentum and continue its course upward. The Fibonacci retracement comes to plate by identifying how far the pullback is going to be so that the trend can continue its main initial course as before. This same activity happens for a downtrend and the same Fibonacci retracement tool is used to test how far the pullback to the upside is going to be before the bear moves continues it’s course.
This tool is made up of horizontal lines that marks ratios or percentages that have been set up using the Fibonacci principle. The main percentages of interest are the 61.8%, 38.2%, and 23.6% and also the 50% and the 78.6% have been added to this list of important percentages. The added percentages are mostly based on experiences from market behaviour because we can see for example that the 50% cannot be a Fibonacci number in real terms.
This tool is very important to a trader in determining the spot at which the original trend will continue after the end of the pullback and in such good points the trader can make secondary entries for the initial trend course of the asset in study.
In this exercise I will head on to the famous trading site (Tradingview) and add this indicator on a particular chart of an asset.


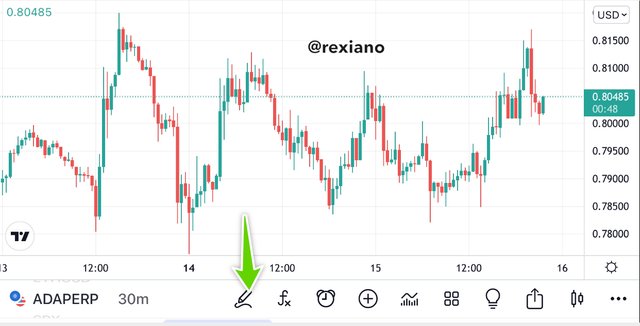
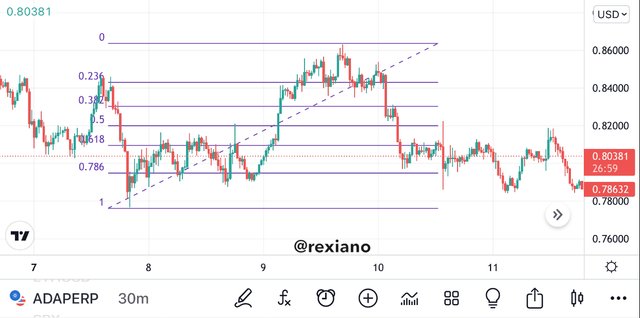
As seen on the above screenshot, we click on the tool menu button on tradingview and select the Fibonacci retracement as seen on the second screenshot. Since we have an uptrend in this case I will click from the bottom of the trend and drag upward to the maximum point of the uptrend such that the whole uptrend will stay within the Fibonacci retracement and we wait for the price to move to our required percentage levels.

We can see on the third screenshot above how the Fibonacci retracement has been positioned all through the uptrend such that the pullback can be observed clearly when it reaches the required level.


The Fibonacci extension is another tool that is used to determine how far the trend continuation will go before a next possible pullback. After the Fibonacci retracement has been used to determine the level at which a pullback will go before the initial price trend is maintained. When one wave takes the pullback, the Fibonacci retracement measure the extent of the pullback and when the pullback is done, the Fibonacci extension is used to know how far that new wave will go into the initial trend direction.
To carry out the Fibonacci extension analysis on the price chart I will need to add the Fibonacci extension tool on my price chart.
I will get to the Tradingview platform and open on the BTCUSDT chart where I will click on the tools option and select the “Fibonacci extension” and add it to my chart.


I can now add the Fibonacci extension at the right place just after the end of the pullback. I will go to the top of the uptrend and click on it then drag to the bottom of the retracement part. We take key note on the end of the trend, the end of the retracement and the beginning of the trend.

We can see how the Fibonacci extension on the ETHBTC chart bounces on the uptrend from the 0.618 ratio level at price 0.066179 BTC after the price had moved to the ratio of 1 marking a high of 0.066993 BTC.


In the calculations of Fibonacci retracement, the following formula is used.
R1 = X + [(1 - % Retrace1/100) * (Y – X)]
Where:
X stands for the initial price value where the Fibonacci retracement begins
Y stands for the maximum price value where the Fibonacci retracement ends on the chart.
“R” can be representing the different percentages such that we have;
%R1 = 23.6%
% R2 = 38.2%
% R 3 = 50%
% R 4 = 61.8%
% R 5 = 78.6%
With this we can have R1 given by;
R1 = X + [(1 - 0,236) * (Y – X)] since it’s percentage is 23.6 and on a ratio on 01 we have it as 0.236
Taking this example and practically applying it to the chart values of my choice I will have the following expression from the ETHBTC trading pair.
Let’s check this example with R2 first.

Y= 0.067035 BTC
X= 0.064854 BTC
With the above data from our screenshot above, I can calculate individual retracement percentages. For this exercise I will go for the R2 as stated above.
To calculate the recoil of R2 I will have to use the ratio of 0.382 where we have our price on the chart as 0.066202 BTC. We now apply our formula and do the calculations.
R2 = X + (1 - 0.0382)(Y - X)
When we insert the values we will have the expression below;
R2 = 0.067035 + (1 - 0.0382)(0.067035 - 0.064854)
R2 = 0.6724476858 BTC
This means that to check the retracement of the ETHBTC pair at R2 will need the price at 0.6724476858 BTC.


On my Binance account I will place a real trade after carrying out the Fibonacci retracement analysis on a trading pair of my choice. Ok this exercise I will work with the ETHUSDT pair.
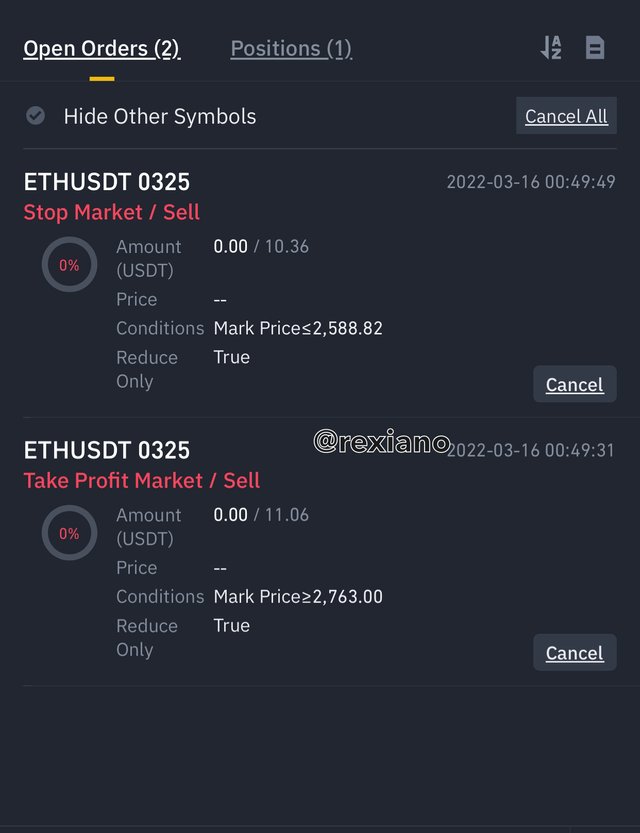
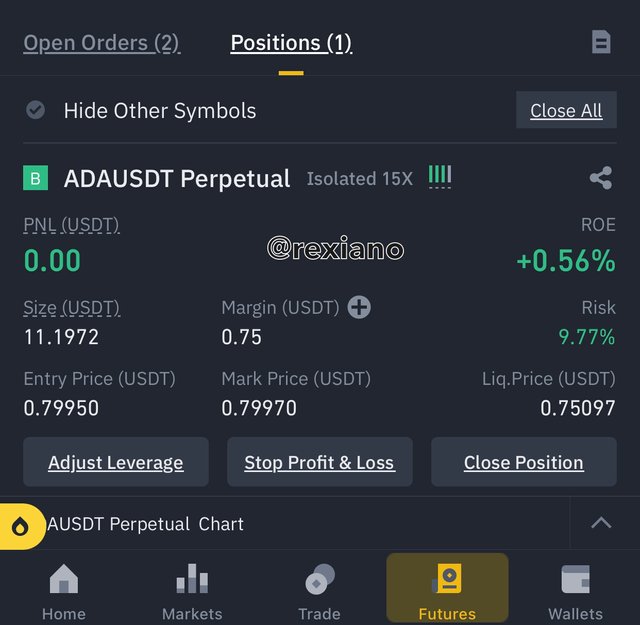
This analysis is done on the ETHUSDT pair on a 30 minutes time frame. This retracement test is done on an uptrend and the trade placed when the Fibonacci retracement tool gave the buy signal. The following screenshots better describe this analysis and the trade.


We can see that after placing the trade, the price of the asset trades close to 0.618 only to prepare for a bounce such that the target may hit in time.


On this exercise I will place a trade using the Fibonacci extension technique. I will use this tool to analyse the ADAUSDT trading pair on the tradingview platform. Impulses will be identified and the Fibonacci extension will be mapped and the entry points made clear. This is well described on the following screenshots.


We can see how the asset trades above 1.618 and retraced to the 0.786 ratio only to bounce back and break the 1.618 ratio and head for the target which is the 2.618 ratio at a price of 0.827 USDT.


On cryptocurrency trading the Fibonacci tools make an important instrument for detecting certain limits on the price action with respect to a specific trend. This makes the Fibonacci retracement to become very important in detecting the pullback limit when prices trades in a particular direction and have to retest previous support/resistance before continuing the trend. Whenever there’s a price trend pullback, the Fibonacci retracement is a vital tool for detecting such pullback limits im order to know when the trend will continue its course.
The Fibonacci extension on the other hand helps the trader detect how far price will go when it follows the main trend after pullback is done. These tools work on both bearish and bullish trends.