.png)

Question 1

The support and resistance zones are essential indicators for traders hoping to carry out accurate technical analysis on the market. The support and resistance levels show the trader that there is a tug of war between the buying and selling force of the market at that given time, because of the to and fro movement that does not break a certain level or price line.
A support zone is a price level that acts as a prop up for price whenever price crosses that level or zone. It tends to push price upwards, and can help traders to spot sniper entries that will favor buying positions. This is because if price gets to that level, the trader expects it to bounce upwards and so he would place a buy. However, price as unpredictable as it can be, breaks the support zone once in a while to continue the original downtrend or to reverse to a new trend.
A resistance zone on the other hand is a price level that acts as a prop down for price whenever price crosses that level or zone. It tends to push prices downwards and can help traders to spot sniper entries that will favor selling positions instead. This is because if the price gets to that level, the trader expects it to bounce downwards and so he would place a sell. However, price as unpredictable as it can be, breaks the resistance zone once in a while to continue the original downtrend, or to reverse a trend.
.png)
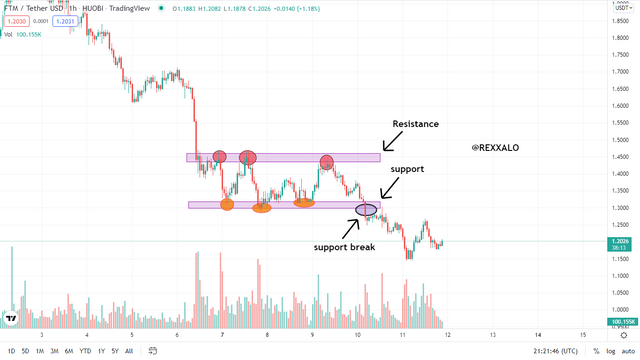
From the chart above, we can see how a typical support and resistance could work hand in hand on a chart. The pair above is the FTMUSDT and i used a one hour time frame. We can also nitice that i have highlighted how the market broke the support to continue the downtrend as i have explained previously. Learning about the support and resistance helps traders and market analysts make accurate trade entries and learn the market status more easily.

Question 2


The Horizontal support and resistance appears in the chart as a horizontal diagramatic expression of the support and resistance zones. As seen above in the screenshot of FTMUSDt on a 30 minute time frame, we can see that the horizontal support and resistance occurs on a linear trend, which is a trend that is horizontal and not dynamic likethe uptrend or the down trend.
The horizontal support and resitance is to me the most useful because it is easier to spot (in my opinion) and also easier to utilize in making it work for spotting trade entries, be it a buy or sell trade. The support and resistance is more evident most times in comparison to the other two types of support and resistance.
Also I have explained how and why price bounces between the support and resistance from time to time, but i want to emphasize that the exchange of price between the support and resistance does not go on for eternity as shown in the screenshot above, as the market shows that the buyers lost strength and lost the tug of war to the sellers and price broke support.

The sloping Resistance and support levels are more stylish than the horizontal support and resistance in the sense that they are more dynamic. They occur on dynamic trends, being the uptrend and the downtrend. It is the second most used support and resistance for me because it is also relatively easy to spot.
Like the horizontal supprt and resistance, the sloping support and resistance also forms by the same laws of demand and supply and the ever constant war of the buyers and sellers currently and actively trading the currency pairs. But this time, it appears that the support and resistance zone either drops linearly in correspondence to a downtrend or rises linearly in correspondence to an uptrend.

The sloping support and resistance also can allow the trend to break either the support or resistance levels, It is also easily spotted in a new or strong uptrend or down trend and is very useful in making trade entries, because when the price reaches either support or resistance levels, it is an indicator for a reversal usually.

The Dynamic suuport and resistance has to be the most peculiar of all thre support and resistance types. It is one that i was totaly unaware of before the lecture by @shemul21. The dynamic support and resistance is formed from an indicator that is very commonly used, it is the moving average. One thing that i realized is that not all periods of thhe moving average is good for spotting the dynamic support and resistance.
Like the sloping support and resistance, it usually occurs on a dynamic trend, and happens when the market bounces off the moving average that could either act as a support line or a resistance line. This also is a useful type of S&R because it makes use of a different but very dependable indicator as a resistance and support line.

Question 3

- CONTINUATION BREAKOUT:

The True break out is in two types, amd they are the continuation breakout and the reversal breakout. The continuation breakout as the name implies is a breakout of the support and resistance range in the direction of the former trend of the market. The former trend in this case being the trend that existed before the support and resistance battle.
- REVERSAL BREAKOUT:

The second type of true breakout is the reversal breakout. This type is easily spotted in trend reversals that take a little time when the support and resistance range holds the price, and a side loses, especially when that side of the market (either the buyers or sellers) were formerly ruling the market, i.e causing either an uptrend or downtrend before the breakout. The reversal breakout also has effects on the volumes of commodity available at that point in time and occurs during a trend reversal.

False breakouts are like death traps for traders, especially beginners in the market who still have their imoatience and emotions out of check. The market once in a while performs what is well known as "fake outs" from price action, to make traders to make entries outside the formation of the market, usuall in anticipation of a trend reversal. When it comes to the resistance and support levels, price sometimes pokes it's head outside the range, making it look like a strong trend reversal or continuation of trend and leading a lot of traders astray.

Question 4

The RSI indicator is a very useful volume type or based indicator and above i have used it to pin point a buy or long trade entry. The screenshot aboveis a very accurate example of how to combine the RSI, volume and breakout indications to spot a trade.

The above pair is SOLUSDT and i have chosen a smaller time frame of 15 minutes. The volume of the market exploded at the end of the touch of resistance which gave an indication that something might be happening, and the RSI confirmed the move by firstly moving over 50 and being overbought at the time. I chose a 1:2 risk to reward ratio.

Question 6


The Support and resistance strategy is not always rosy, sometimes as i have explained before, it gives false indications of trend reversal or continuation which are known as the false break outs, and these false break outs can be seen in all three types of support and resistance. It is a huge limitation because it can mislead a trader to make wron trades, and even convince a novice without a doubt of a trend reversal or continuation. A way to by pass this huge limitation of false breakouts is by combining this strategy with other indicators that are reliable and trusted and also widely used like the RSI indicator.

CONCLUSION

i really enjoyed the class by @shemul21 and hope to participate in more of his assignments because his classes are really easy to understand. all screenshots were taken from tradingview or made by me from canva.