.png)

WHAT IS PRICE ACTION

When making technical analysis for trading the concept of price action, plays a major role based on the facts that analysis is rocked upon past prices calculations that can then be used to perform good trading decisions.
Price Action can be seen as the up and down movement of a currency pair over a given time.This relies on the movement of the price market putting into consideration the amount of buying and selling actions occurring simultaneously over a given time.So here, a trader makes his trading decisions on the most recent behavior of price and NOT depending on Technical indicators.
It is also safe to note that Charts and candle stick patterns such as Three white soldies, Harami Cross and the rest are basically constructed from price actions along the market over a certain period of time which then gives rise to technical analysis that enables traders make profit while trading on the market
In addition to the visual formations on the chart, many technical analysts use price action data when calculating technical indicator and day traders and short-term traders that focus on making short-term profits by primarily looking at the charts are the most common users of this trading approach.

Define and explain in detail what the "Balance Point" is with at least one example of it (Use only your own graphics?

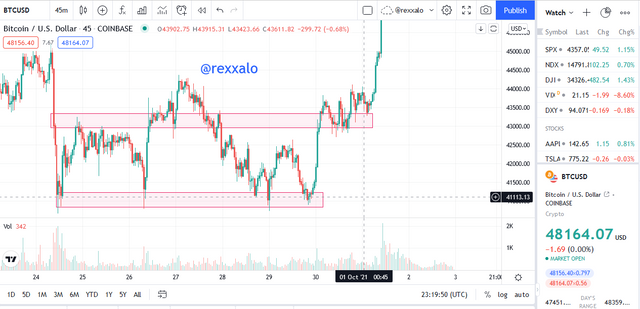
A balance point as the name implies can be seen as a point on the chart where there is an evening of price to either initiate a downtrend or an uptrend in order to fufill the desires of the whales of the market to maximize their profit generated It is located primarily at the resistance and support levels of a market chart.
This balance point is usually the highest point of a candlestick bar at the resistance level, resulting in a break in the candlestick pattern.
Following the balance point, traders must keep an eye out for the formation of the next candlestick bar, which acts as a market direction that determines whether a price will go bullish or bearish.
The formation of a bearish candle signifies the start of a bearish market and traders can make do of this trend by placing a sell order.
When a strong bullish signal candlestick forms at the support level, indicating that the market is moving in an uptrend direction immediately after the balance point, it is a good time to enter the trade, specifically buying the market.
Clearly describe the step by step to run a Price Action analysis with "Break-even"?

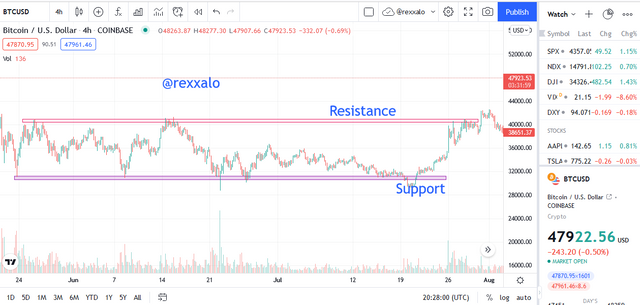
Enter a chart in any analysis platform of preference personally i will be making use of Trading View because i understand it better and can operate it fully well. As a swing trader that i am i prefer to make use of the 4hour time frame in order to identify the balance points as requested by the professor and i will be illustrating it with the images below.

Identify areas of interest such as Support and Resistance Levels,which enables the trader map out the areas of rejection. These areas can be identified using horizontal lines. These areas enable the traders spot entry and exit points in the market
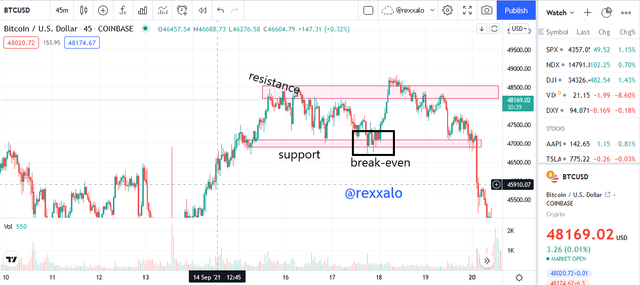
After the Support and Resistance levels have been identified, the balance points are then identified , this will help the trader to identify entry and exit points for the trade,and it is also necessary to identify the market trend so as not to go against the market trend and not acquire losses.


What are the Entry and Exit criteria using the Equilibrium Point Price Action technique?

In picking out entry and exit points on the market using the Equilibrium point price action technique it is necessary to wait and look out for a visible break from the Equilibrium points that have been marked. This points can be seen as the last candle in the last uptrend or the last candle in the last downtrend these positions is located either at the top or at the bottom of the chart. If the break is at the top of the chart one is expected to see a bearish candle and if the break occurs at the bottom of the chart it signifies the start of a bullish market.

What type of analysis is the Price action or the use of technical indicators more effective?

The both are effective analysis and patterns that aids traders in good and profitable trading. But out of sincerity and trading styles/patterns used by me, I would say that the use of technical Indicator is actually more effective than that of price action because technical indicators combines the price action while making its predictions and this makes it quite more effective than using the price action solely.
The analytic study of price movements which is the Price action is quite effective while trading though but it cannot be totally relied on due to the fact that it draws data from recent price changes and this alone is not enough to make analysis considering the William %R indicator which takes data from a 14days time frame comparing the highs and the lows is able to make good and precise indications regarding the market trend.
It is said two heads are greater than one hence two technical analysis patterns is better than one combining the effect of price action with technical indicators give traders better leverage on the market because technical indicators makes reference to previous trends and price actions takes recent price actions on the market on merging the two procedures a better trading pattern is developed.

Make 1 entry in any pair of cryptocurrencies using the Price Action Technique with the "Break-Even Point"


Conclusion

In Conclusion price action can be seen as price movements in the upward or downward direction over a given period of time it is a crucial technical analysis tool that can be used to monitor recent price movements which is majorly influenced by huge buying and selling actions occuring simutaneously these price actions are basically the source of charts that are been produced on a currency pair and this is an advantageous action because it can be used for technical analysis and making good trading options.
Trading takes a number of strategic approach and traders tend to make use of only price action while making technical analysis and it is usually detrimental because price actions rely on only recent price movements and this creates alot of false movements that influence wrong trading decisions hence it is advised that price actions are combined with technical indicators which takes data from past trends and hence giving traders better leverage on the market.