
1.Define in your own words what is the Stochastic Oscillator?
This is one among the different types of Oscillator indicators was developed by Dr.George Lane in the late 1950s to shows price momentum using divergence and convergence, deciphering when the price is overbought or oversold while moving within a range of 0 to 100, to determine a price turning point. This can be a powerful indicator when combined with other indicators such as Parabolic Sar etc
2.Components of stochastic Oscillator
The Stochastic Oscillator is made up of two moving averages the %K line and the %D line
%K line: This is the fast-moving average that crosses the %D line in an overbought or oversold area to generate a buy or sell signal respectively. It can be calculated as follow
%K Line= 100(the closing price-lowest price of a particular no. of period/Highest price of a particular period- Lowest price of a particular number of periods)
%D Line: This is the slow-moving average also called the signal line, in combination with the %K line makes up the Stochastic Oscillator. It can be calculated as follow
How to use it: Firstly, the Stochastic Oscillator can be used to determine the turning point of price i.e it signals the probability of price selling when the stochastic is in the overbought area(above the 80 scales) and also the probability of price rallying when the stochastic is in the oversold area(below the 20 scales)
Secondly, it can be used to identify areas of reduced momentum in price which occurs in the form of divergence.
3.Example of trade with Stochastic Oscillator
In the example below, we see price selling after getting to the overbought area and price buying after getting to the oversold area, this doesn't mean that whenever price gets to an overbought or oversold area it will sell or buy, this is why we need to combine this indicator with others to give us more confluence and increase our probability of being profitable
4.What is Parabolic Sar
Parabolic Sar is an indicator that shows where price will stop buying and start selling or where price will stop selling and start buying. it can be used to identify a retracement of a major trend or a change in a particular trend.
5.Conditions for Parabolic Sar to change from Bullish to Bearish direction
Let's say the price has been bullish for a particular moment, we get to see that parabolic Sar dots are below the price, when price breaks below the last Parabolic Sar dot below the price, we get to see a Parabolic Sar dot appears above price, this signifies a bearish signal. Likewise, when the price is bearish we get to see the Parabolic Sar dots above the price when the price breaks the last parabolic Sar dot above we get to see a new Parabolic Sar dot below the price giving us a bullish signal.
6.Two ways Parabolic Sar can be used in a trade
Entry Criteria:
Formation of a new Parabolic Sar above price can be used as entry criteria for a bearish move, stop loss just above the newly formed parabolic Sar. While the formation of a new Parabolic Sar below price be used as an entry criterion for a bullish move, stop loss just below the newly formed Parabolic SarExit Criteria:
The formation of a new parabolic SAR above price in a bullish move can be used as an exit criterion for someone that has been bullish on a price
PRATICAL QUESTION
1.It shows a step by step on how to add the Stochastic Oscillator to the chart (Indicating the% k Line and the% D Line, the overbought and oversold zone
For this task, we would be making use of a trusted database site known as tradingview
STEP 1:
We click on charts

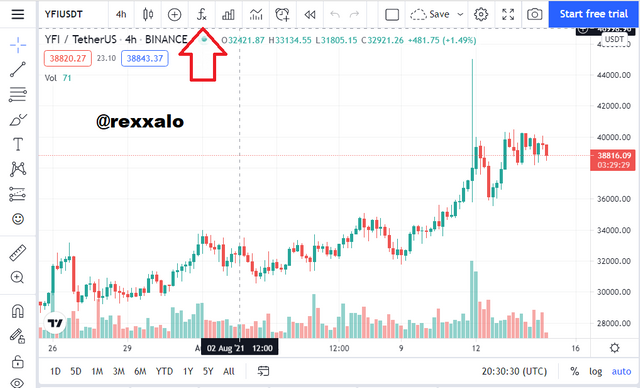
STEP 2:
The next thing we want to do after a chart has been loaded (as you can see below, I am currently looking at the YFIUSDT chart. We look for the indicator sign above and click on it
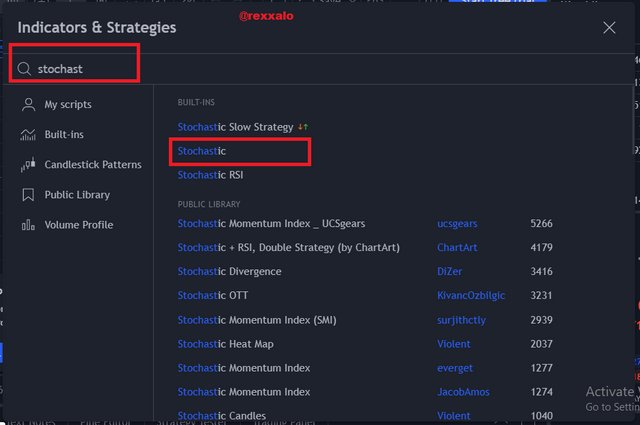
STEP 3:
when you click "Indicators" a dialogue box appears where we can search for the indicators we wish to use, so we go on to search for stochastic indicator and then I clicked on stochastic
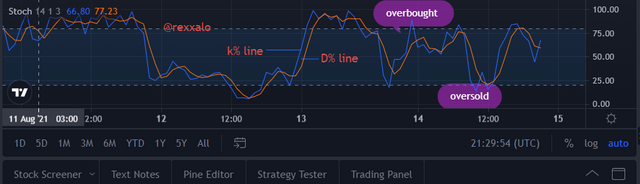
STEP 4:
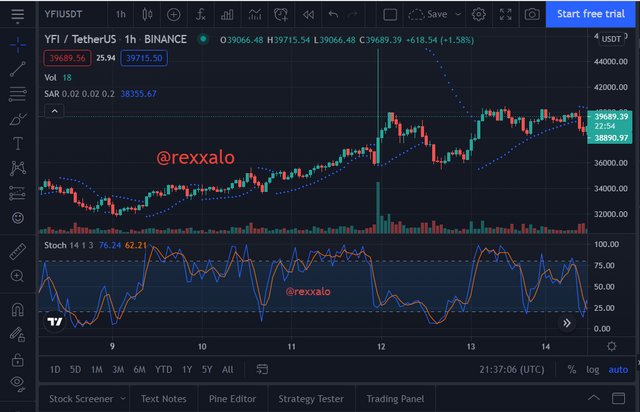
I am now going to mark out the parts which include over bought regions and oversold regions and then the D line and K Line
2.Show step by step how to add Parabolic SAR to the chart and how it looks in an uptrend and in a downtrend
For this task, we would be making use of a trusted database site known as tradingview
STEP 1:
We click on charts
STEP 2:
The next thing we want to do after a chart has been loaded (as you can see below, I am currently looking at the YFIUSDT chart. We look for the indicator sign above and click on it
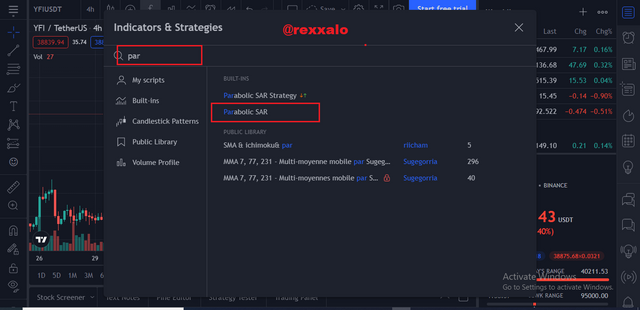
STEP 3:
when you click "Indicators" a dialogue box appears where we can search for the indicators we wish to use, so we go on to search for "parabolic SAR" and then select the vortex indicator from the result as I have shown with the red box and then I clicked on it.
STEP 4:
Below, we can see that the indicator has been implemented on the chart effectively as we can see below
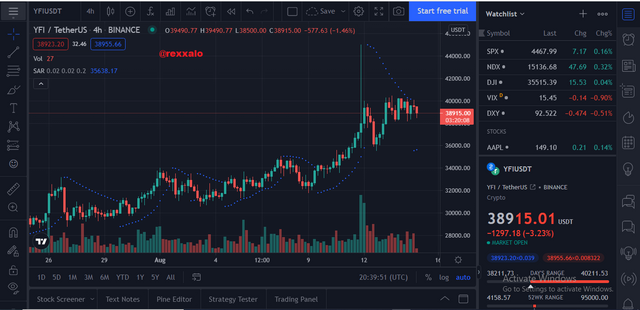
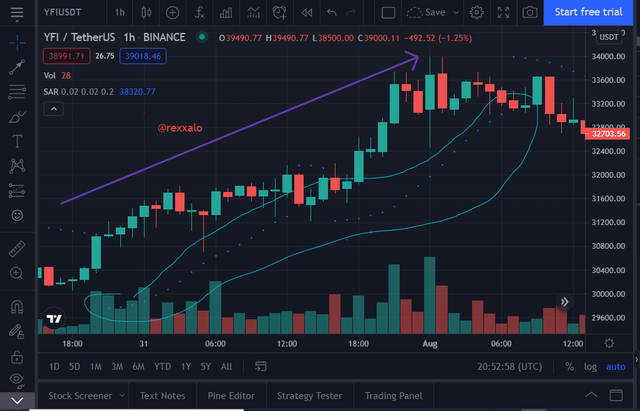
Then let us identify the different trends in the market which are uptrend and downtrend. For an uptrend, we need to see the SAR dots below price like see below in this yfi chart
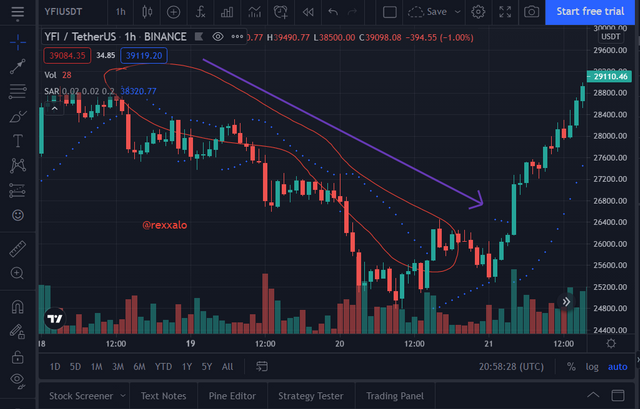
For a downtrend, we need SAR to be above the price
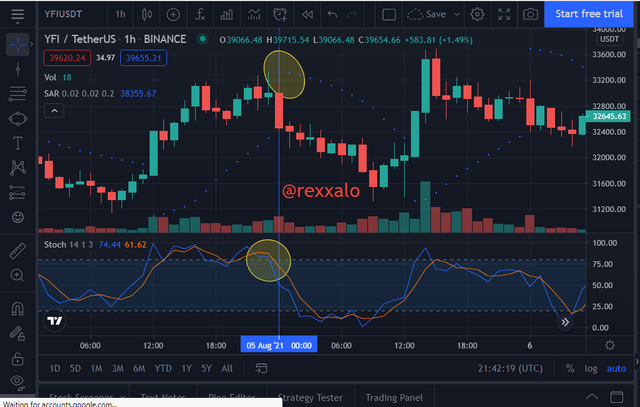
3.Add the two indicators (Stochastic Oscillator + Parabolic SAR) and simulate a trade in the same trading view, on how a trade would be taken
let's put the two Indicator together by following the process above and we have this
Recommended Parameters.:
1.Position of parabolic sar matters: below price - uptrend. above price -downtrend
2.over sold and overbought region of stochastic
i will simulate a sell trade , we saw parabolic sar move above price below and then price leaving oversold region so we took a sell trade
CONCLUSION
Learning about the stochastic oscillator and parabolic star indicator strategies has realky been enlightening. I exceedingly thank professor @Lenonmc21 for the lecture given earlier this week as it helped guide and show me what this indicators were all about.
The pair are an awesome combination and i will be sure to make use of them in my future practical cryptocurrency futures trading. See you next time, God bless!