
Define in your own words what a contractile diagonal is and why it is important to study it. Explain what happens in the market for this chart pattern to occur. (screenshot required / Bitcoin not allowed)


When I first saw this lecture, I wondered why the topic was contractile diagonals, because what the chart patterns seemed to look like was the well too known "wedge" pattern, but think I prefer to call it the contractile diagonal now because it is more literal. A contractile diagonal is a chart pattern that shows higher highs and higher lows making an angle of meet or lower highs and lower lows doing the same thing.
This phenomenon then causes the trendlines drawn to form a convergence at a point, making an open triangle usually less than 90 degrees at the apex. The appearance of a converging diagonal usually warns of a trend reversal either from an uptrend or a downtrend. In a converging diagonal, the highs and lows whether ascending or descending are usually labeled by numbers 1-5.

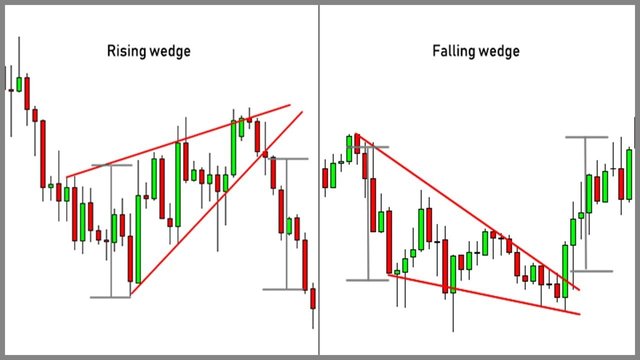
Now I know I have mentioned it above, even though not enough, but the contractile diagonals or wedges are of two types and they are the rising wedge (from an uptrend, signaling a bearish reversal) and the falling wedge (from a downtrend, signaling a bullish reversal) and they are categorized highly based on the trend they fall under.

The contractile diagonal appears when there is a change in trading volume as the price continues on a certain trend, be it an uptrend or a downtrend, this, in turn, causes a squeeze in price direction and spacing, causing a possible trend reversal. When talking about a rising wedge or ascending wedge, the contractile diagonal is initiated by a reduction in trading volume as the trend still soars higher, this then produces a retracing squeeze on the chart and leads to a trend reversal, while for a falling wedge, the reverse is the case, the volume increases as the trend continues downwards, forming the falling wedge.
One thing that is very important in trading is knowing where the price of an asset is most likely supposed to go, and one way we can ascertain this is through technical analysis. This means that analyzing the market structure is important, and this is one way we can predict a trend reversal, by spotting converging diagonals to help us ascertain if a trend is reversing so one can enter the market precisely.

Give an example of a Contractile Diagonal that meets the criteria of operability and an example of a Contractile Diagonal that does NOT meet the criteria. (screenshot required / Bitcoin not allowed)

To properly spot a wedge o confirm a contractile diagonal, some benchmarks must be met, and I will get into these criteria below:
It must look like a converging shape, and if trendlines were continued, the trendlines will touch each other, meaning that both lines are not parallel to each other.
on the trend, The first line (0-1) should be longer than the third line (2-3)
Also, in the same way, The third line (2-3) should be longer than the fifth line (4-5)
The second line (1-2) should also be longer than the fourth line (3-4)
the trendlines should be able to touch the 1,3 &5 points above and the 1&2 below, and vice versa, depending on the type of wedge.

From the screenshot above, we can see the difference between the lines on the uptrend, and how the trendlines are converging, To confirm it, we can also see the trend reversal that happened after, including the reduction in trading volume and the retraction squeeze. This is how a converging diagonal (rising wedge) should look and I will show below how it shouldn't look.

Above, I have displayed an example of a wrongly drawn and spotted converging diagonal or wedge, as you can see, the lines on the trend showing retraction are very random, following almost no pattern at all, and the trendlines drawn appear parallel to each other.

Through your Verified exchange account, perform one REAL buy operation (15 USD minimum), through the Contractile Diagonal method. Explain the process and demonstrate the results and graphical analysis through screenshots. Your purchase data must match your analysis data: such as cryptocurrency and entry price.

Below, I have chosen the AXSUSDT pair and my favorite exchange platform Binance to complete this task. I have searched for the playout of the converging diagonal on the chart and below I have shown my analysis in diagrammatic representation.

From the above picture, we can notice the squeeze in the trend retraction, and the conflict in trading volume tally, and even though the lines for the retraction are not ideal, the trend lines are still converging and are not parallel. Also, the price tends to reverse but I believe that the reversal is not exhausted yet, and it is going to break the resistance it was currently on, so as I have shown above, I placed my buy order and set my risk to reward ratio at 1:2. and my entry price was $65.99

Above also is a screenshot of the confirmation of my order, as seen, I have used about 15$ for this trade and have performed my technical analysis accordingly.

Through a DEMO account, perform one sell operation, through the Contractile Diagonal method. Explain the process and demonstrate the results and graphical analysis through screenshots. Bitcoin is not allowed.

For this task, I am going to be using Tradingview to place the demo trade because it provides a suitable chart option for precise technical analysis the pair we have below is the XRPETH on a one-hour time frame. Below I have shown the converging diagonal that made me believe that there was a bearish trend reversal. I have also shown my risk to reward ratio using the RR indicator as seen below

Below is a confirmation of the Sell trade I placed and as seen the trade was at a loss as the price was consolidating around that area.

Below is a result of the analysis as shown, the price almost got to my take profit before going up again, and might still get there.


Explain and develop why not all contractile diagonals are operative from a practical point of view. (screenshot required / Bitcoin not allowed)

A standard contractile diagonal structure has a proportionally reducing trend retraction lining. This is because when a correct converging diagonal is forming, the trading volume changes In a contradictory manner to the chart of the crypto pair. Now to properly utilize the converging diagonal in a way that is highly effective, we have to utilize a good risk to reward ratio and also combine the strategy with other indicators.

Another thing that affects the operability and feasibility of the converging diagonal is the fact that not all traders properly draw the wedge pattern. Sometimes one could draw a foreign wedge and still predict a reversal in the wrong direction, which could cause inefficient technical analysis, leading to wrong entries and wrong orders.
The screenshot above shows a properly drawn and executed contractile diagonal with a 1:2 risk to reward ratio which is an appropriate ratio to grow a trading portfolio, notice how it is placed in conjunction with the wedge. Using the pattern in this way will boost one's chances of using the contractile diagonal effectively and reduce losses.
One thing to take note of is that no indicator is 100% correct, and so sometimes we could draw the structure of the wedge exceptionally well, but still price goes against it, this can be avoided partly by using other indicators together with it.

CONCLUSION

The converging diagonal is a reliable strategy that has been used to depict trends and trend reversal, it uses the 1,2,3,4,5 line path to show price squeeze or congestion before a trend reversal. It can be aided by the use of other indicators to confirm analytical suspicions.
I thank professor @allbert for the very wonderful lecture, opening my eyes to this strategy, even though I knew it before, i have a different view of it after doing this task. This is the end of the article, until next week Adios Amigis!