
Edited Using Canva

1) a) What do you understand by a Trending market?

Trending market:
In cryptocurrency, a market is said to be trending if the seeing price of a specific asset moves overall in one direction.
In a trending market, the price can either be moving upwards or downwards.
When we have an upwards trend, it’s referred to as a bullish trend and when the price moves downwards, it’s also referred to as a bearish trend.
This trend occurs due to the demand and supply in the market.
When the demand for the asset is high, we see the market prices moving high (bullish) and vice versa.
When the supply of the asset is higher than the demand, then we see that the price of the market price of the asset moves down (bearish)
An example of the Trend is shown in the screenshots below.
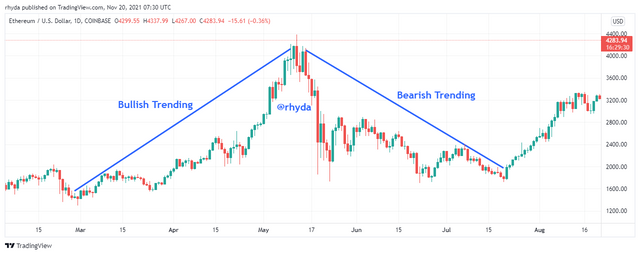
Bullish and Bearish Trend: ETH/USD: Screenshot taken from Tradingview

b) What is a bullish and a bearish trend? (screenshot required)

Bullish trend
In this type of trend, the market price of a specific asset moves in an upward direction. The movement of this trend is mostly in a zigzag direction.
This zigzag is formed as a result of the chart moving in a higher-high and a higher-low motion
The bullish trend is formed as a result of the demand rate being higher than the supply rate in the market.
Let’s say the price of an asset is $1, now the demand in the market of this asset can push the market price of that asset to $10.
Let’s take a look at the screenshot below.
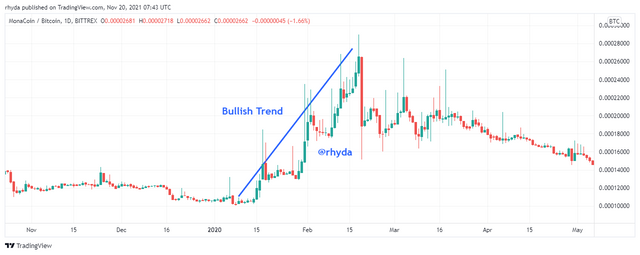
Bullish Trend MONA/BTC chart: Screenshot taken from Tradingview
Bearish Trend
A bearish trend is formed when the market price of a specific asset moves in a downward zigzag direction. This zigzag is formed as a result of the chart moving in a lower-low and a lower-high direction.
A bearish trend is formed as a result of sellers being more buyers in the market.
Let’s say if the price of Bitcoin is at its peak height say 80,000, now the number of people in the market selling Bitcoin is higher than the buyers will force the market price of Bitcoin to go down to say $50,000.
Lets take a look at the screenshot below.
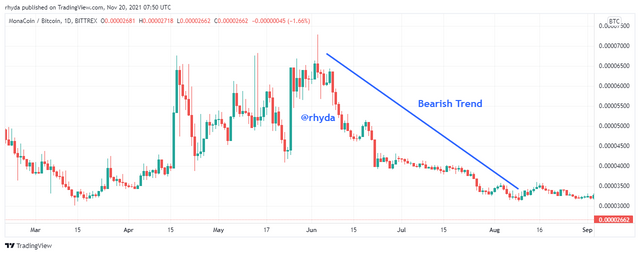
Bullish Trend MONA/BTC chart: Screenshot taken from Tradingview

2)Explain the following trend identification and give an example of each of them. (Original screenshot needed from your chart). Do this for a bullish and a bearish trend.

You know whenever a trader looks at the market chart, the first thing that comes to their mind is, should I buy, sell or should I hold on for a couple of days.
But what they need to do is ask themselves when looking at the chart is, is the chat telling me to buy or is it telling me to buy?
But with the help of market structure, all the wondering questions going on in your head will be answered because.
Market structure helps an individual to define the market condition so that with this help you will be able to tell whether you should buy, sell, or may wait for a couple of days.
In market structure, traders can tell whether an asset is an uptrend, downtrend, or ranging.
when the chart of an asset is in an uptrend, traders intend on looking for buying opportunities and when the chart is in a downtrend, traders in the market look for selling opportunities. But if the market is in range, traders have to choose to either buy or sell.
Market Structure For A Bullish Trend
When the market structure of an asset is in a bullish trend, a trader sees and a rise and fall in the chart of a specific asset, that is to say, a trader sees a higher high and a higher low and in a chase where an asset is in this motion, it means when it rises to a specific level, it falls and the next rise will be much higher than the first one in that other until it reaches it peak height.
Most times, traders buyers more assets when it starts to rise because the bullish trend gives them the buying opportunities.
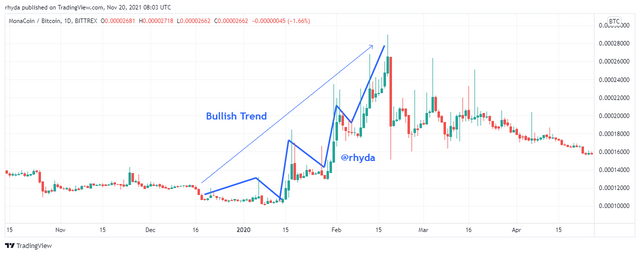
screenshot taken from tradingview
Market Structure For A Bearish Trend
The Bearish trend is the opposite of the bullish trend.
The market structure in this type of trend moves from top to down, that is to say, the market chart moves in a lower-high and lower-low direction.
In this case, the market price of an asset is decreasing causing the fall in the market price.
As the market starts to fall, it’s decreased to a specific level, stops for a minute, and then starts to decrease downwards.
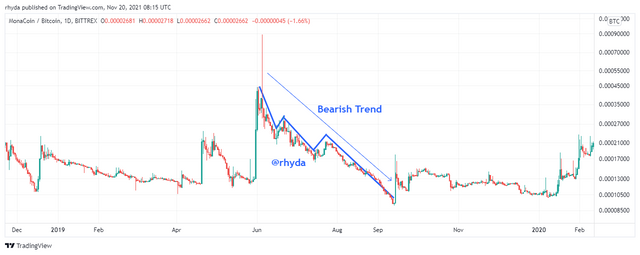
Screenshot taken from Tradingview
Trend lines are strategies used by traders to identify and confirm trends. It also helps traders to spot when a trend is beginning to break down.
A trend line can be drawn on any two pillar points.
Piler points are just when the price goes from down to up or from up to down changing direction and establishing a price range.
In a bullish trend line, a trader connects major troughs in a price. For an uptrend, traders look for a higher-high and a higher-low. But in drawing a trend line for bullish, traders focus on the lows since it helps them to identify opportunities and supports at an increasingly higher level.
An example of this can be seen in the screenshots below.
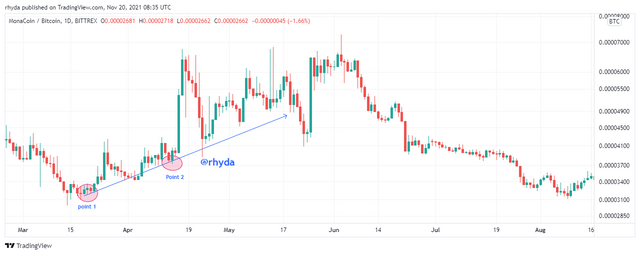
Bullish || Screenshot taken from Tradingview
But in the bearish trend line, traders connect major peaks in a price. For a downtrend, traders look for resistance in the lower level of the market.
Bearish trends are mainly about the lower-high and the lower-low of the market chart.
So when it comes to drawing a bearish trend line, traders are focused on the resistance at the lower level since it helps them identify the next movement of the market price of an asset.
An example of this can be seen in the screenshots below.
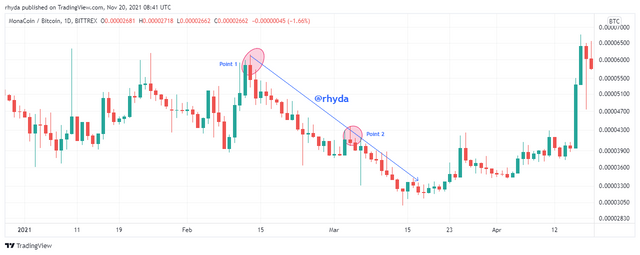
Bearish || Screenshot taken from Tradingview

3)Explain trend continuation and how to spot them using market structure and trendlines. (Screenshot needed). Do this for both bullish and bearish trends.

Trend continuation
When we talk about the Trend market, we are either talking about the upward trend, the downward trend, or the ranging trend. But this trend doesn’t just move in a straight-line direction, it moves in a zigzag form due to the profit made by traders. When an asset starts to rise or fall, traders in the market start to withdraw their asset and as a result of the withdrawals causes fluctuations and these fluctuations make the market chart move in a zigzag way which is termed as The Trend continuation:
In trend continuation, when a price of an asset fluctuates the next pattern to form will be much higher than the initial pattern form on the market.
Market structure
Due to traders buying and selling in the crypto market making the chart not to be stable, we see breakages in the chart as a result of traders selling their assets and new traders entering the market, causing the chart to form a higher-high and a higher-low pattern. This new pattern formation is term as the Bullish trend.
The key point is that the new pattern to be formed is expected to be higher than the previous one.

Screenshot taken from Tradingview
The same way applies to the bearish trend, in the bearish trend the market price of these assets moves in a downward direction and this move is then interrupted as result do traders withdraw their profits and this withdrawal causes the chart to form a lower-high and a lower-low pattern whereby the new low formed is much lowered than the previous one.
In the bearish trend, the new low pattern to be formed is expected to be lower than the previous one.

Screenshot taken from Tradingview
Trendline for a trend continuation.
In trendline, the market chart of the asset is only considered as valid only and only if there are no breakages in the trendline. But if there are any breakages in the trendline, then traders are expected to have a reversal in the market.
Let’s take a look at the screenshots below.

Screenshot taken from Tradingview

Screenshot taken from Tradingview

4)Pick up any crypto-asset chart and answer the following questions -
i)Is the market trending?
ii)What is the current market trend? (Use the chart to back up your answers).

i)Is the market trending?
In using MONA/BTC to answer this question, It can be seen in the screenshot below that the market is in a Trending because it the past hours it has been moving in a upwards direction.
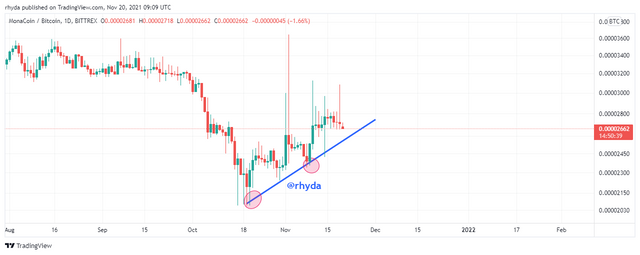
Screenshot taken from Tradingview
ii) What is the current market trend? (Use the chart to back up your answers)
As seen in the chat above, the chart is in a higher-high and a higher-low direction which means the chart is bullish.

Conclusion

In understanding Trends, it helps you predict the next candlestick to be formed in the market.
It helps trader in knowing whether the asset their investing is in a Bullish, Bearish or ranging trend and by doing so they are able to predict on what time to enter the market and what time to exit.
Cc:-
Here is a link to my homework post
Downvoting a post can decrease pending rewards and make it less visible. Common reasons:
Submit