Hello steemians how are you ? I hope you all are well. Its a great opportunity to read season 3 lectures of the crypto academy and I found it a really interesting and creative way to increase quality content and knowledge.
Today professor @asaj explain a wonderful lecture on Vortex indicator for trading. After complete analysis and reading now I am submitting my homework post to professor.
HOMEWORK by @rinkisaxena

Question 1:
In your own words explain Vortex indicator and how it is calculated.
Answer 1:
While trading indicators play major role for deciding the trend in the market and perfect entry exit point. Vortex indicator is the technical indicator which is used to analyse trend in the market trend reversal in the market and perfect entry exit point from the market. It is also known as trend analysis indicator. It was developed in 2009 by Etienne Botes and Douglas Siepman. Vortex indicator is a line indicator which consists of two lines one is positive vortex indicator and other one is negative vortex indicator. When positive line is above negative line and moving upward then it is a bullish trend and when negative line is above positive line and moving upward then it is downward Trend. The cross of these two lines show the trend reversal in the market where buyer can decide its entry and exit point. Vortex indicator line are calculated by taking historical data of 14 period.
When blue line cross red line and just move upward then it is considered to be buy signal and when to show good profit uptrend you can take sell and take exit from trade.
Calculation:
In calculation of vortex indicator of both positive and negative line we first have to decide the range the trend and the period selected to complete analysis of vortex indicator line.
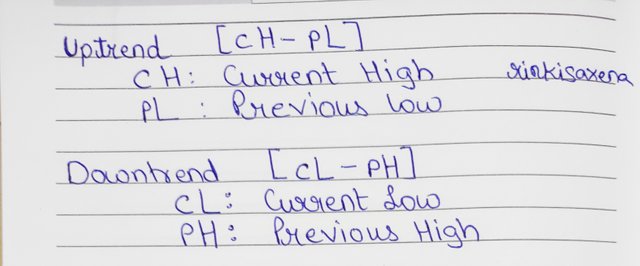
Trend :-
As we know there are only two type of friends in the market bullish trend which is uptrend and bearish trend which is downtrend. To calculate the strength we have to use the formula :
Range :-
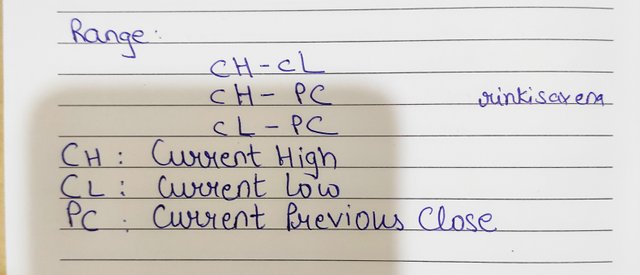
The formula given below is to calculate range in the market. If any one of these have maximum value then it is considered to be the range at that time.
Formula for calculating range are given below:
Period :
It is important to decide period in the market to get good result and clear understanding of the indicator. By default vortex indicator is set on 14 period length which is 14 minutes 14 days 14 week and so on. It is considered that voltage indicator with 14 period is most reliable and accurate in the market which don't provide for signal to the trader and gives smooth signals for better results. It is also depend on trader that which period they want to decide they can also choose the period depend on their own working style.
Method of calculation:
first we have to calculate trend in the market. It is depend on trader that for how many days we want to calculate the vortex indicator. If you want to calculate for 2 days then take 15 days Trend calculation.
Calculate range in the market using formula.
then take the sum of 14 periods in for Trend and range it will give you to data. In this you have to calculate all the previous 14 days historical data and give new result.
Divide VM(+,-) with TR to get VI (+,-).
This is how we have to calculate the Vortex indicator and its value in different period.

Question 2:
Is vortex indicator is reliable. Explain ?
Answer 2:
Vortex indicator is reliable and very much helpful while making a trade because:
When blue line and red line cross each other It show a trend reversal in the market which is easy to understand and it is a valid signal for trend reversal.
when blue line that is the positive line move upward it's so bullish Trend and when Red Line that is the negative line move upward it show the bearish trend.
the length of vertex indicator is by default 14 period which is most reliable and accurate while trading. It provide us better results and better exit and entry point in the market.
the reliability of any indicator also depend on the success rate of that indicator. Vortex indicator has success rate above 60% which tell us its reliability to the market and the trader.
While taking an indicator in consideration it is not only the working of indicator but also a trader must be focused and psychologically balance in the market. Fomo and greed are killer. If you use any indicator it doesn't mean it will provide you profit if you have less information about it and greediness in your heart.
Vortex indicator is very much reliable and traders are using it and making good profits in the market.

Question 3:
How to apply vortex indicator on chart and what are the recommended parameters.
Answer 3:
To apply Vortex indicator on chart we have to follow some simple steps that are shown below :
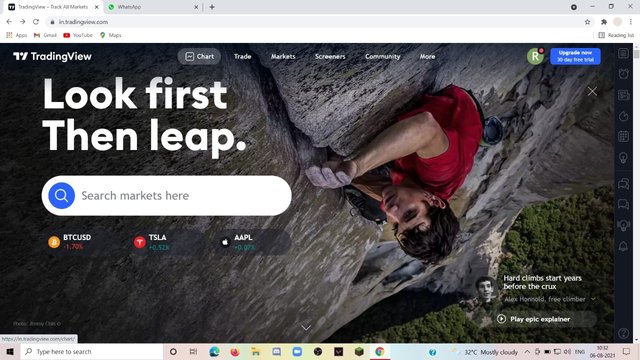
First search Trading view on google and click the first link of trading view main website.
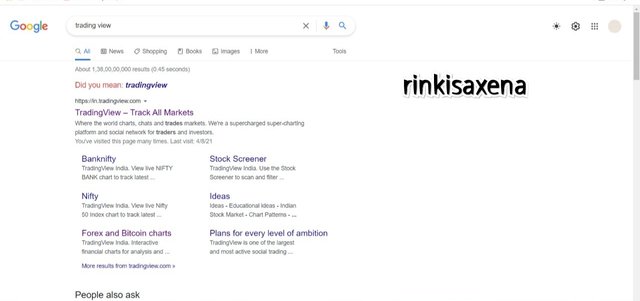
Now as you can see the black colour interface of trading view click on chart option and apply a crypto chart on which you want to add Vortex.
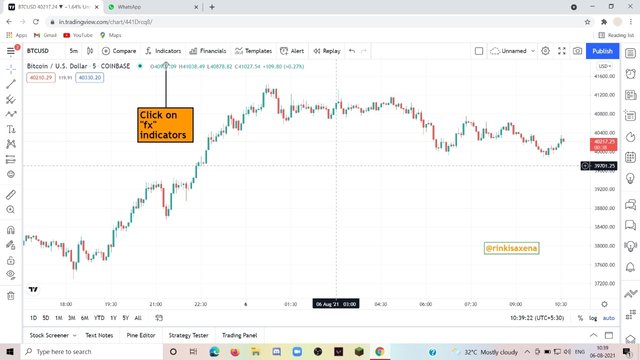
Now click on "fx indicators" and search vortex indicator on search bar.
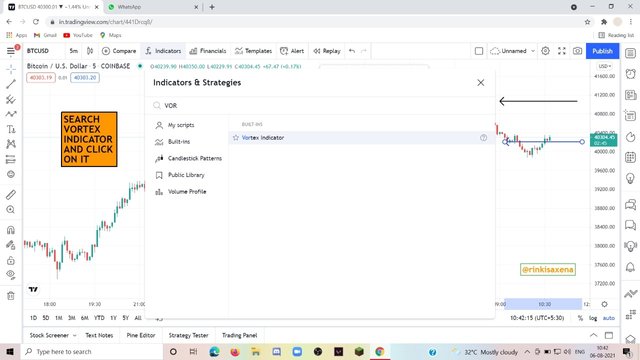
The first option is the main indicator and click on it to apply it on chart.
Now you can see on the bottom of chart that the Vortex indicator is applied and working perfectly.
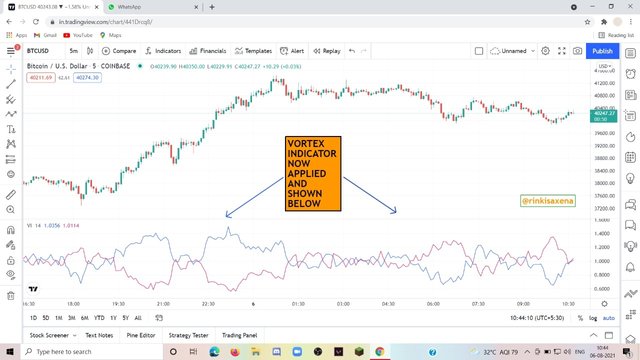
Now there are some internal settings of vortex indicator that we have to study. It consists of Style Input and visibility. Let us see one by one what are the features inbuilt in it.
Inputs :
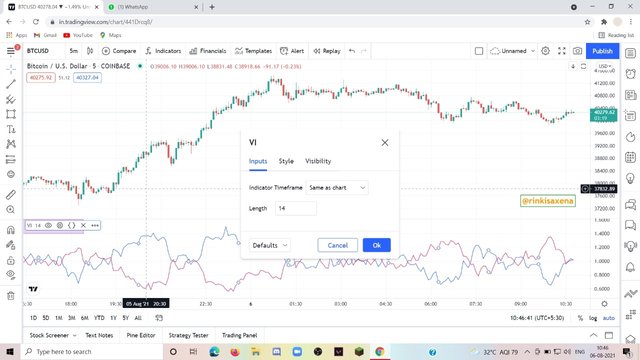
Inputs column of setting consists of length and time period. Length is by default 14 period that means it can be 14 minutes 14 days 14 month or 14 weeks. The time period is refer to analyse the indicator on which time frame. it is by default same as the the chart. If we take one hour chat then our indicator will also work on one hour.
Styles :
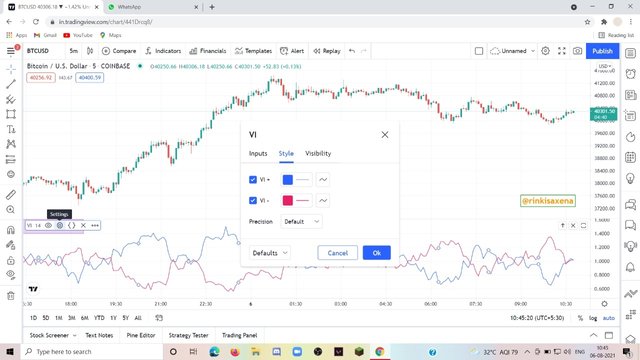
The style column consists of of colour and chart pattern of positive and negative vertex indicator line. You can change the colour and thickness of line and also so can change the chart pattern from line chart to another chart pattern. By default the positive line is blue and the negative line is red with One X thickness.
Visibility:
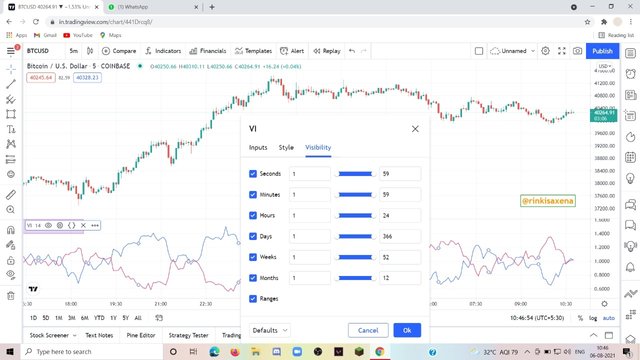
It is the adjustment of chart in indicator at which time frame and how to see the chart. It is by default set as default.
Required parameters:
It is highly required and advised to use 14 period length because it is highly accurate and reliable in the market to give more accurate results and best buying and selling point in the market.
It is also mention and advised to use long time frame more than 10 minutes to get better result using vortex indicator in the market.
it is my advice while using indicator be aware of stop loss and risk management in the market. All so don't become greedy in the market.
These are the main requirement parameter in a market using vortex indicator.

Question 4 :-
Explain the concept of divergence using Vortex indicator.
Answer 4 :-
Divergence in market is when market price chart and indicator indicates two different trends. There are two type of divergence bullish and bearish divergence. These divergence are depend on trend and indicator combination.
Bullish divergence :-
With Vortex indicator when market make lower lows and indicator make higher low then it is known as bullish divergence. This situation is also stated as when market move downward and indicator move upward.
Example :-
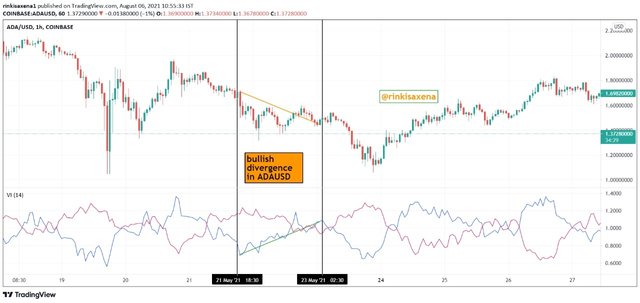
In ADAUSD chart of 1 hr timeframe we can see in certain timeframe market is moving downward and blue line of vortex is moving upward. This is a bullish divergence in the market.
Bearish divergence :
With Vortex indicator when market make higher highs and indicator make lower highs then it is known as bearish divergence. This situation is also stated as when market move upward and indicator move downward.
Example :
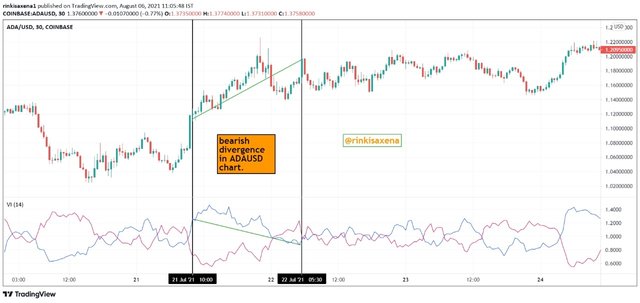
In ADAUSD chart of 1 hr timeframe we can see in certain timeframe market is moving upward and blue line of vortex is moving downward. This is a bearish divergence in the market.

Question 5:
Establish two trade of buy and sell on two crypto currency.
Answer 5:
Let us create two demo trade on two cryptocurrency.
Buying and selling ATOMUSD 30 mins timeframe:
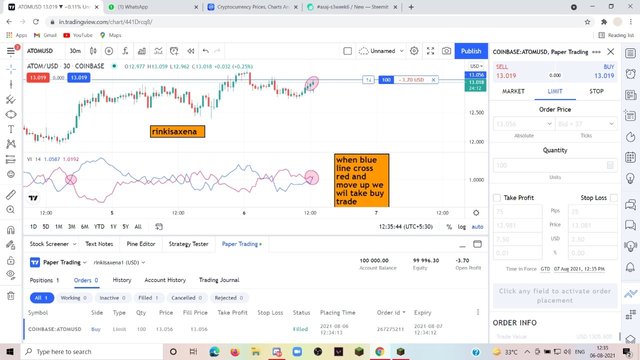
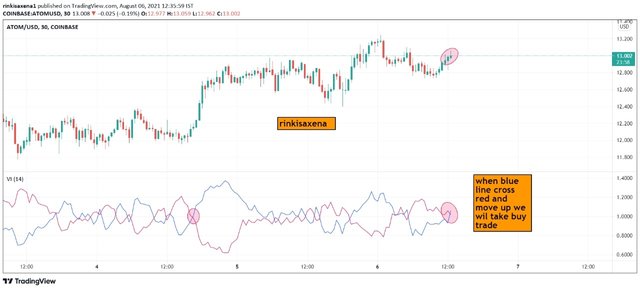
Buying trade when blue line cross red line and move upward. It is a signal of trend reversal and move upward so buy trade at low point.but at $13.056.
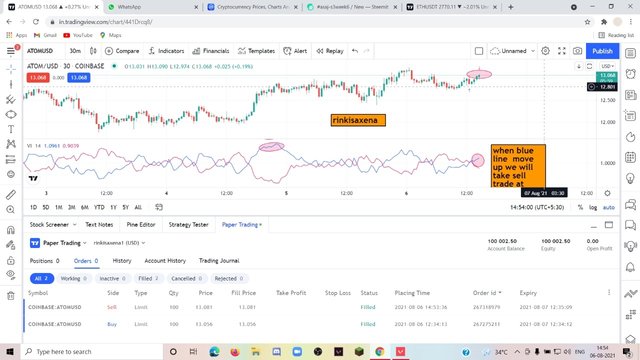
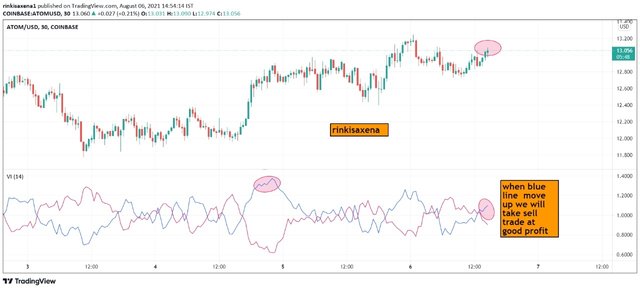
After waiting for long hours when market move upward and give good profit I sell the asset and make good profit in the market. Sell at $13.081.
Buying and selling at. Timeframe:
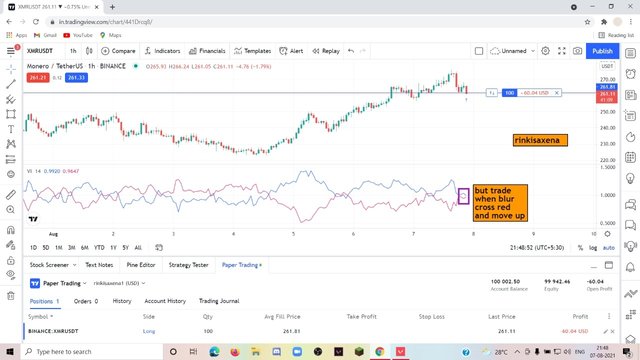
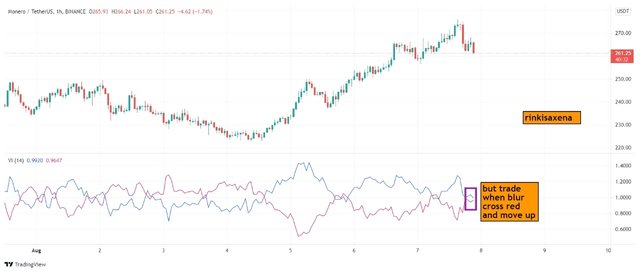
Buying trade when blue line cross red line and move upward. It is a signal of trend reversal and move upward so buy trade at low point.but at $261.81.
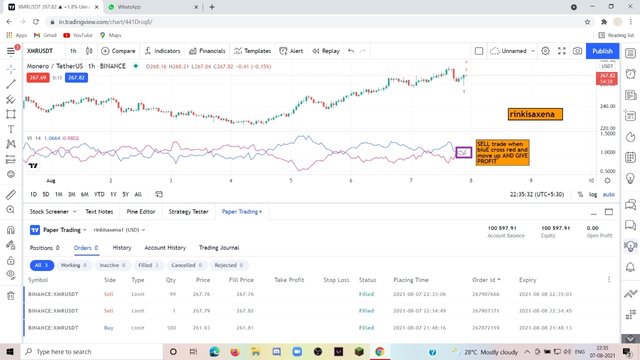
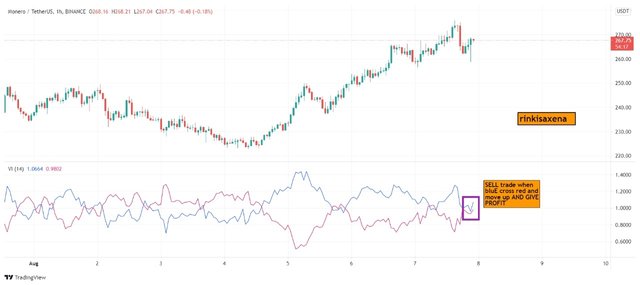
After waiting for long hours when market move upward and give good profit I sell the asset and make good profit in the market. Sell at $267.76.

Conclusion
Now it is time to summarise our homework in which we discuss Vortex indicator. It is a trend reversal indicator and use to take perfect entry and exit in the market. It is most reliable and accurate. It is also considered to be more secure while taking entry and exit from market. It is easy to apply it on trading view and also the most easy to understand. It consists of two lines positive line and negative line which show trend in the market and also give entry and exit in the market. When blue line move upward it will show entry in the market after cross. Finally we place to two demo trade and make profitable trade in the market.
Finally, we conclude our homework post.

Superb performance @rinkisaxena!
Thanks for performing the above task in the sixth week of Steemit Crypto Academy Season 3. The time and effort put into this work is appreciated. Hence, you have scored 8 out of 10. Here are the details:
Remarks
You displayed a good understanding of the topic.
Downvoting a post can decrease pending rewards and make it less visible. Common reasons:
Submit