Hello Steamians, how are you all? First of all I would like to thank steemcryptocademy for a beautiful start to season 4. Season 4 has not only started with a new professor, but it has also opened new doors of content and today in this series I am submitting my homework post to @allbert. This homework is based on Trading with strong,weak and gap levels.


HOMEWORK BY @rinkisaxena

Question 1:
Graphically, explain the difference between weak and strong levels. Explain what happens in the market for these differences to occur.
Answer 1:
There are two types of levels that occur in the market that are strong and weak levels. Generally these levels denoted by Resistance and support levels in the market. Different support and resistance level points create levels that are strong and weak.
Let us understand about both these levels using graphical representation.
Strong level:
When price bounce back from a horizontal level several Times then it is considered to be the strong level. These levels don't allow penetration of price for a long time. There are two types of strong levels, Strong support and resistance.
Strong Resistance:
When price move upTrend and then create a peak and move downtrend on the same level several times then that peak level is considered to be the strong resistance level. It means that price is not penetrating the strong resistance level and bounce back from strong resistance level more than 2 times.
For example:
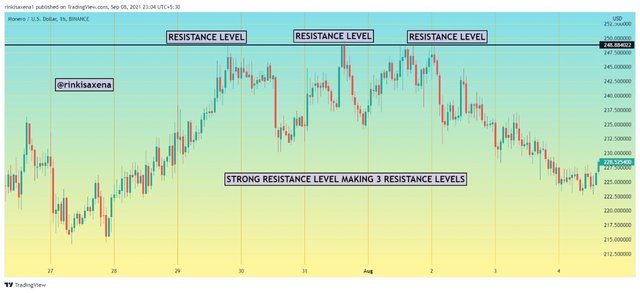
As you can see in the above XMR-USD pair in 1 hour time that there is a creation of 3 main resistance points that are levels. So there is more that 2 resistance points hence the level is considered to be strong resistance level.
Strong support:
When price move downtrend and then create a peak and move uptrend on the same level several times then that peak level is considered to be the strong support level. It means that price is not penetrating the strong support level and bounce back from strong support level more than 2 times.
For example:
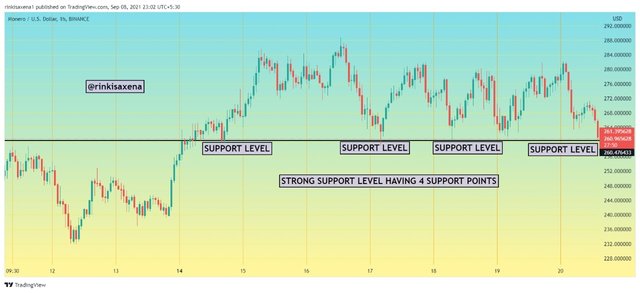
As you can see in the above XMR-USD pair in 1 hour time that there is a creation of 4 main support points that are levels. So there is more that 2 support points hence the level is considered to be strong support level.
Weak level:
When price bounce back from a horizontal level but unable to hold itself at that level and get penetrate. It means that it will breakout the created level. These levels allow penetration of price in single peak. There are two types of weak levels, weak support and resistance.
Weak Resistance:
When price move uptrend and then create a peak and move downtrend on the same level only once or twice and after that it break the created level then it is considered to be weak resistance level. This allow traders to trade BRB strategy.
For example:
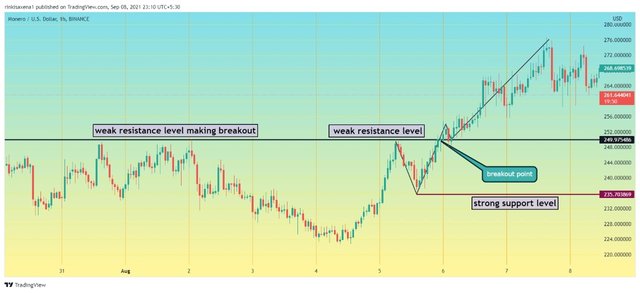
If you focus on above chart it is very clear that there is a creation of weak resistance level in the market as price break the level and move above it. This allow traders to use BRB strategy.
weak support:
When price move downtrend and then create a peak and move uptrend on the same level only once or twice and after that it break the created level then it is considered to be weak support level. This allow traders to trade BRB strategy.
For example:
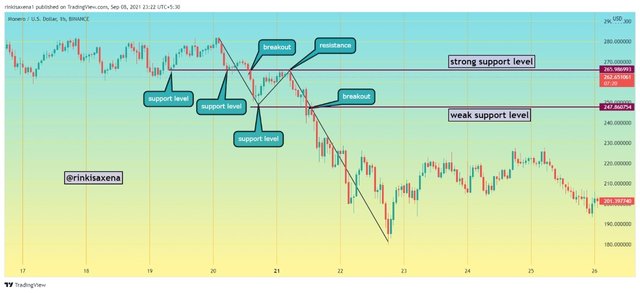
If you focus on above chart it is very clear that there is a creation of weak support level in the market as price break the level and move below it. This allow traders to use BRB strategy.
This is all about weak and strong levels in the market.

Question 2:
Explain what a gap is. What happens in the market to cause it.
Answer 2:
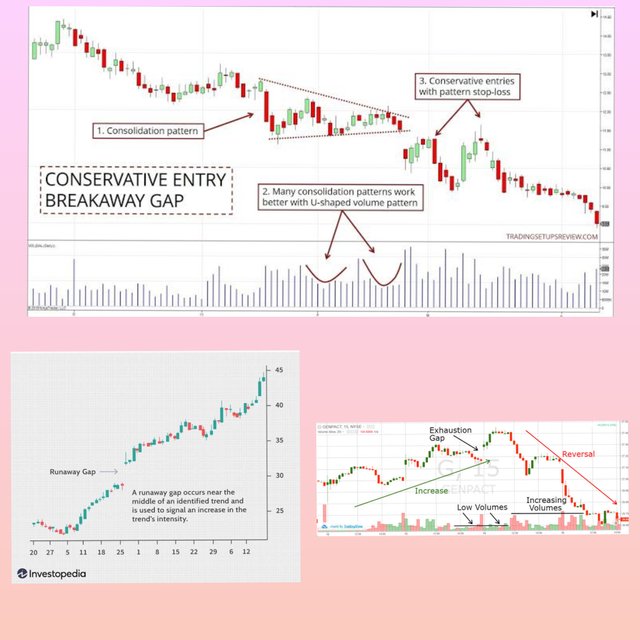
The gap defined as the space created in between two candles which change the closing and opening price of two candles. This gap occurs due to sharp movement of price that can occur due to any reason.
There are mainly three types of gaps that one deal in the price chart named as :
- Break-way gap
- Runway gap
- Exhausting gap
These gaps not only allow us to trade but also open many fundamental secrets of price and buyer and seller minds.
These gaps occurs due to events, influence, news that make flood or we can say huge number of buyers or sellers in the market which does not allow price chart to create a closing price and new opening price on same level.
For example:
| LINKS |
|---|
| Source1 |
| Source 2 |
| Source3 |
The above image shows three types of gaps that occur in the market. These gaps is a good Indicator of trade on the market price. It shows that how the buyer and seller are actively participate in the trade.

Question 3:
Explain the types of gaps with examples.
Answer 3:
As we discussed above that there are three types of gaps that occur in the price chart of market. These gaps are named as Break-way gap, Runway gap and Exhausting gap. Let us discuss them one by one with example of each type of gap.
Break-way gap:
As the name suggest that it will break a trend. When market is moving in a trend and a break way gap occurs then it means that market will take a trend reversal. This gap not only create trend change but also make strong support or resistance level at this particular gap point.
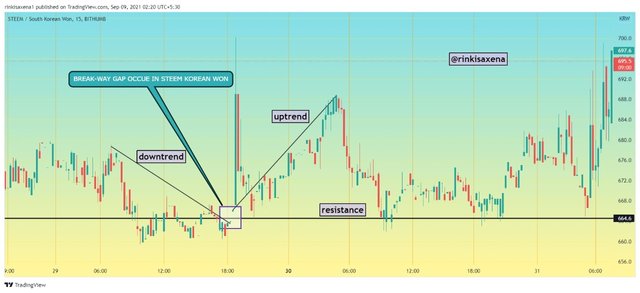
As you can see in the above Steem Korean won pair there is downtrend Market and soon there is a Break-way gap create which move maet in Trend reverse uptrend. This gap create a strong resistance level in the market chart pair.
Another point that one have to note is that these gaps are created by volume trades. So it trade occurred with high volumes that it is quite difficult to fill gap easily but if there is low volume trade then this gap will get filled soon.
Runway gap:
As the name suggest that it will run a continuation trend. When market is moving in a trend and runway gap occurs then it means that market will take a trend continuation. This gap not only create trend continuation but also might make strong support or resistance level at this particular gap point. Creation of this label depend on the volume trade in the market. If high volume is added or move out from the market then the trend will continue as it move uptrend or downtrend.
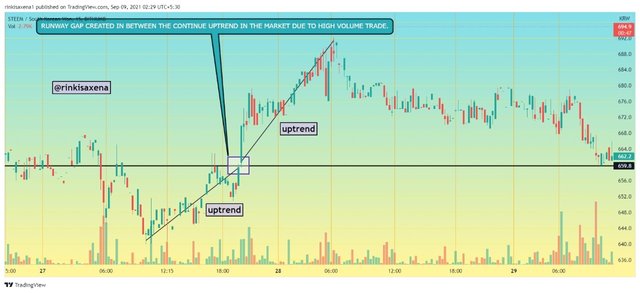
As you can see in the above Steem Korean won pair there is uptrend Market and soon there is a Run-way gap create which move price in Trend continuation. This gap create a strong resistance level in the market chart pair. This level is created by high volume trade in the market which make trend continuation.
Exhausting gap:
As the name suggest when a trend get exhaust or we can say moving in a same Trend from long time then it will create a gap and indicate end of a trend. Exhausting gap is quite difficult to identify because it some time is same as Runway gap. For identification of exhausting app we have to check the filling up of gap.
In Runway gap market move in same continuation trend without filling gap is volume trade is large. But if small volume is trade and gaps created then it will fill up the gap and if gap filled then we can say that this gap is a exhausting gap. This gap also indicate small trend reversal.
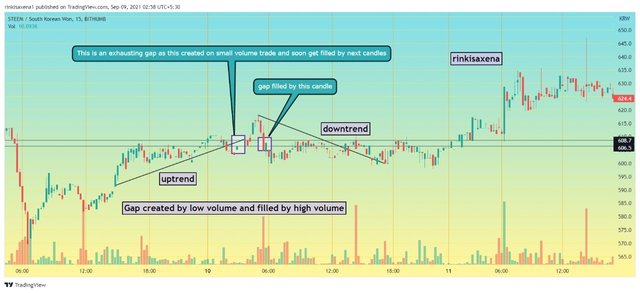
As you can see in the above Steem Korean won pair there is uptrend Market and soon there is a Exhausting gap created. It indicate the end of a trend but this gap is created with low volume trade and hence it will get filled with high volume. This will also change trend in the market to fill up the gap.
This is all about the gaps. It is not easy to find the category of gaps so it is important to verify the volume trades also. We have to understand the difference between the exhausting gap and the The run-way gap because these two are the similar type of gapps with only one difference.

Question 4:
Through Demo account perform buy or sell trade using strong support and resistance. Explain the process required.
Answer 4:
Using tradingview demo account we will be performing at demo trade using strong resistance and strong support. First we will buy the trade using strong resistance level. Then then we will try to make our trade hit take profit rather than hitting stop loss.
Buying Asset using Strong Resistance Level:
To buy asset in the market we are using break retest break strategy. That is also known as BRB trading strategy.
First check and create a strong resistance level which help us to create entry level in Market.
Then wait for the price to break this level and then first retest the same level.
When price cross the swing high peak in next candle we buy our trade with a stop loss and take profit apply at a ratio of 1:1 risk: reward.
In this example you can clearly see the following steps that are followed:
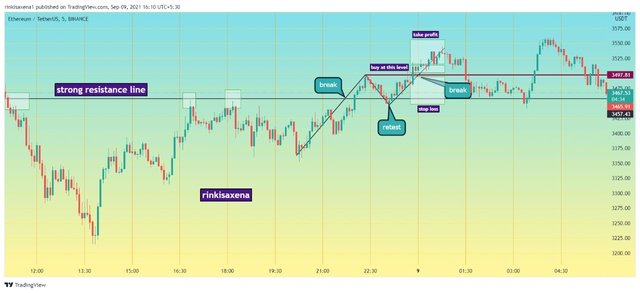
Selling Asset using Strong Support Level:
To sell asset in the market we are using break retest break strategy. That is also known as BRB trading strategy.
First check and create a strong support level which help us to create entry level in Market.
Then wait for the price to break this level and then first retest the same level.
When price cross the swing low peak in next candle we sell our trade with a stop loss and take profit apply at a ratio of 1:1 risk: reward. This will help to short sell our trade.
In this example you can clearly see the following steps that are followed:
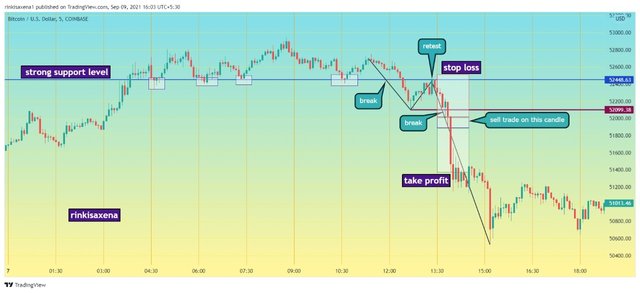

Question 5:
Through Demo account perform buy or sell trade using Gap. Explain the process required.
Answer 5:
To trade using Gap, first we have to find break-way gap to make a perfect trade. In this gap system we can see a trend reversal in the market.
So to trade using this gap first we have to analyse the market trend and then find the gap. If we are able to get the gap then wait for 2-3 candles to finally tell us which type of gap system it forms. If it forms a break-way gap then we can initiate our trade.
So, when you see the break-way gap, place trade after formation of next big candle after gap. This candle will be in the direction of new trend.
In my XMR-USD trade in 1 min time frame, I can see a downtrend from last few candles and then a creation of gap. That gap is confirmed after 2-3 new candle that it Is a break-way gap. Then just after new trend first large candle we place our buy asset trade. This trade is set up with a ratio of 1:1 risk: reward.
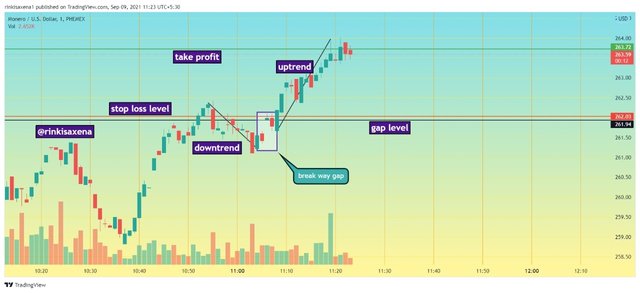
As we can see that our trade is in the right direction of the breakaway gap and easily we hit the take profit level that is our target price which provide us good profit in the market using gap level trading.
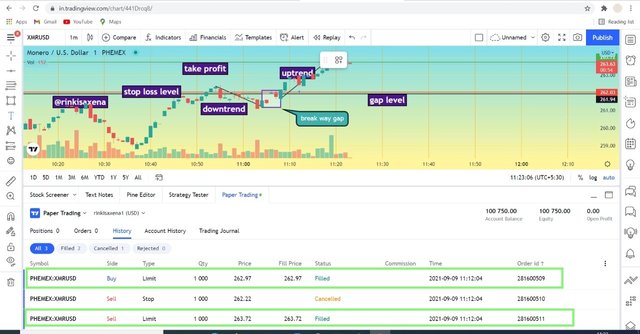
As you can see that we buy 1000 XMR USD asset at a rate of $262.97. soon when our take profit hit we sell our 1000 asset at $263.72. we clearly by our trade after the next Big green candle that created in new trend after gap.
This is how we have to use gap to complete our trade and get good profit in the market. Treating with gap is sometime riskier because of lack of information it is important to understand gap system first.

Conclusion
It is time to conclude our homework post in which we discuss about, strong and weak levels with gap trading. These strong and weak levels are nothing but the strong resistance and strong support or weak resistance and weak support. Strong levels are created when peak of resistance or support hit the level more than 2 time and weak support and resistance created when it does not hit more than two time. While working with strong and weak resistance and support we can use break retest break strategy to trade in the market.
There are are certain space created between two candles when high volume flood of trading take place in the market. This is known as gap which create opening price off new candle different from closing price of previous candle. there are mainly three type of gaps that are created exhaustion gap breakaway gap and runaway gap. To trade in the market one can use breakaway gap which allow a trend reversal in the market to trade easily. This is all about my homework post thank you so much professor for Such an interactive lecture.

You have been upvoted by @sapwood, a Country Representative from INDIA. We are voting with the Steemit Community Curator @steemcurator07 account to support the newcomers coming into Steemit.
Engagement is essential to foster a sense of community. Therefore we would request our members to visit each other's posts and make insightful comments.
Thank you
Downvoting a post can decrease pending rewards and make it less visible. Common reasons:
Submit