What is a HODL wave, how do you calculate the age of a coin(BTC, LTC) in a UTXO accounting structure? How do you interpret a HODL wave in Bull cycles?
HODL Wave
I recently learned that HODL was actually A Typo that happened back in 2013 In a forum, later it got popular with the meaning of Hold on for Dear life.
HODL is basically holding a asset for a longer period, HODL is actually a pattern to view the age of coins as a proportion of Total supply of a coin. It is calculated by age since it was last moved from one wallet to another.
Suppose during a mega Rally millions of Transactions happened, later then some crypto remain untouched in Same wallet address for a longer duration that means the person is HODLING you can describe it as Unspent transaction outputs(UTXO), Although the Holding period can be In years or couple of years.
Calculation of age of coin through HODL Wave
The age of any coin/Token isn't Determined from its mining date or time, Rather it is calculated since it was last moved from one address to another, it is calculated with the help of Unspent Transaction output.
When we make a transaction (BTC LTC), There's always some dust part that is left behind, just like we saw in the Electrum task that some left over BTC goes to change address, That UTXO always have a date and timestamp that is saved in the bitcoin blockchain data and with the help of this immutable data recorded into ledger we can find the age of coin.
The age of the Coin can be varying between 24 Hours to 10 Years ( BTC, The only crypto existed for more than 10 years so far) to understand a little better we will take help of a chart.
The HODL waves actually Represents the time periods in which BTC has most recently moved, but how? It does this by using a different colors that are being transacted in different time periods.
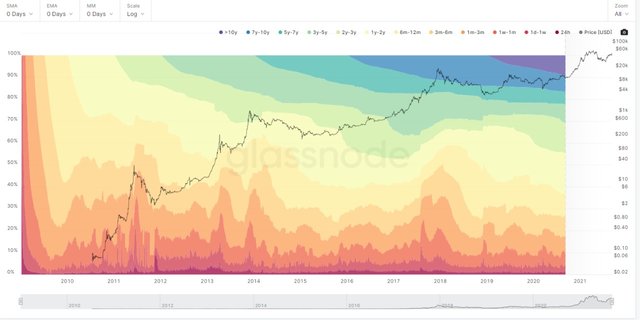
In the bottom of the chart You can see the Warm colors which are Red, Orange and yellow Which represents BTC which is recently Transacted (Moved from one address to another)
In the top of the chart You can see cold colors which are Light yellow Green and blue Represents that BTC hasn't been transacted in a while.
A . Hot colors
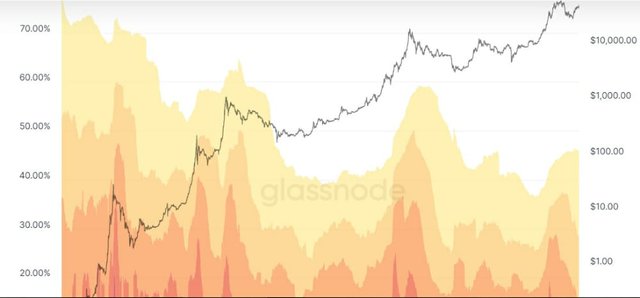
The hot colors indicates the Recent Coins ratio which aren't transacted in a while, with the age bands which can be 24 hours, 1 day, 1 week, 1 month, 1 - 3 months, 3-6 months, 6-12 months
B. Cold colors
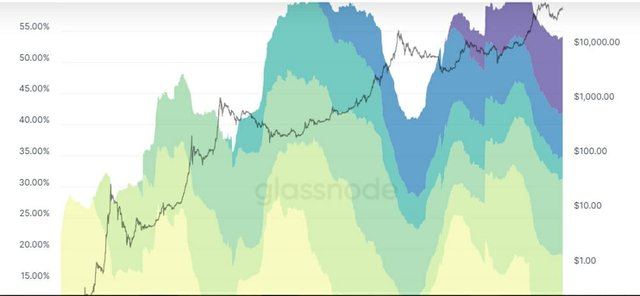
The cold colors indicates The Untransacted Coin That's not been Moved for a long time, This measures the range from 1-2 years, 3 - 5 Years, 5-7 years, 7-10 Years and will go so on in future
Interpret A HODL wave In Bull cycle
In the above HODL wave Screenshot data we saw that more and more coins are being on hold for a longer duration and with time The Top data is growing which means the number of UTXO is increasing which leads to A HODL wave means that eventually the demand will increase and because the Asset is on HODL will lead to Lack of supply and eventually we will see a bull Run because there will be more buyers than sellers.
Consider the on-chain metrics-- Daily Active Addresses, Transaction Volume, NVT, Exchange Flow Balance & Supply on Exchanges as a percentage of Total Supply, etc, from any reliable source(Santiment, Coinmetrics, etc), and create a fundamental analysis model for any crypto[create a model for both short-term(up to 3 months) & long-term(more than a year) & compare] and determine the price trend (or correlate the data with the price trend)w.r.t. the on-chain metrics? Examples/Analysis/Screenshot?
Daily Active addresses
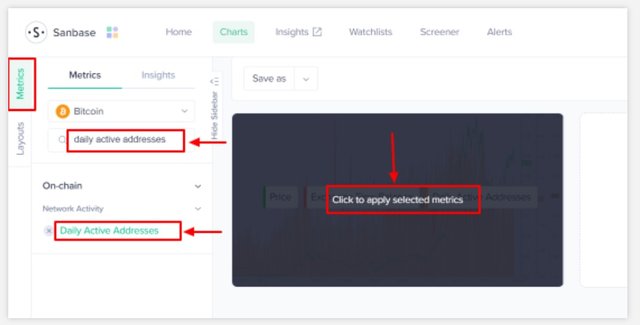
The Daily active address in an on - Chain metrics That is done To know the number of daily active address(Not Exact number but Approximated Data) according to the Price of an Asset, This analysis is done on Both Short term and Long term Scale.
A - Short Term Scale (3 Months)
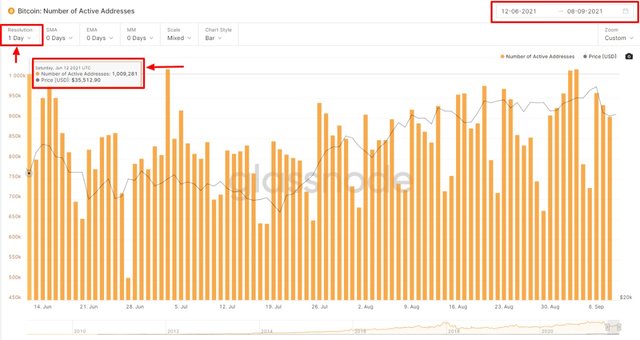
On the Short term scale i Observed that in the beginning (June month in chart) the number of Active addresses peaked at 1 million(12june) While the BTC price Stood at 35512.90USD, Then following the down trend Both number of Active addresses and price of BTC Declines.
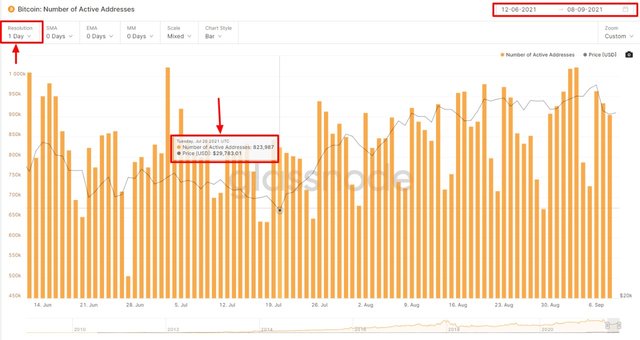
On July 20,2021 The price of BTC recorded at 29783.01USD While the number of Active BTC addresses was reduced to 823K
B. Long Term scale (2 Years)
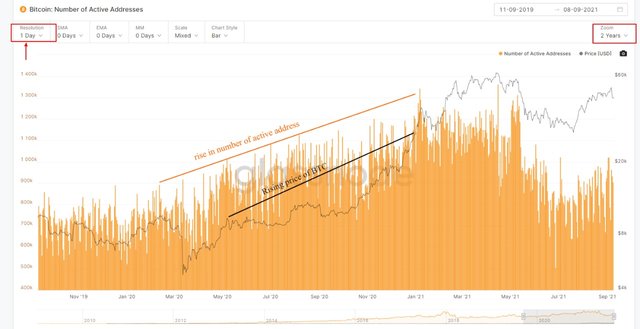
Now While observing on the long term Scale we can see that it is following the uptrend means with the rising number of Active addresses the price of BTC is also going higher, On April 13th the number of active address was around 1.17M and the Price of BTC Stood at 63600$ and later on made its next ATH of around 64300USD.
After Reaching 64k$ Again The number of Active address reduced along with the Price of BTC that you can find on the Extreme right side of the Chart shown above, On September 4th the number of Active address reduced to 787K and price of BTC stood at 50k USD.
Transaction Volume
To implement Transaction volume, go to metrics then search for the same and then click on apply On metrics as shown in the image below.
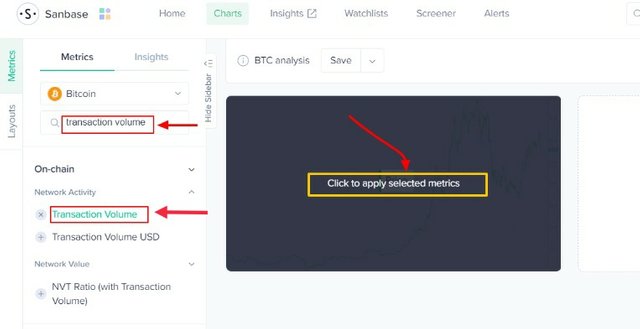
Transaction volume is measured on the basics of Exchange Activity of any Asset. Although The transaction volume doesn't really help in determining the price of an asset, But during spikes in price of an asset we can see a Rapid movement in the transaction volume.
For example i will take recent example of BTC when it was trading around 52K USD the Trading volume of BTC on binance was Around 13K BTC but when BTC had correction just 2 days the Volume rapidly went to Over 30K BTC.
A. Short Term scale (3 months)
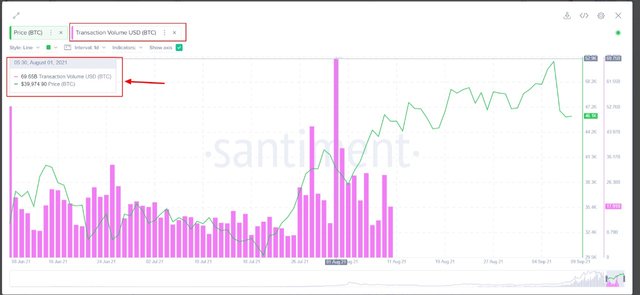
In the above image you can see that in the beginning 8th June 2021 The BTC transaction volume Was around 53.06 Billion and the price of BTC Stood at around 33500USD, Next week On 15th June the transaction volume was 24 Billion and the price of BTC was 40155 USD. In comparison It has less Transaction volume then last week but we saw an increasing price of BTC.
The highest spike on this 3 month chart occurred on 1st of August, when Transaction volume hit 69.65 Billion and at that time the price of BTC stood at Around 39974.90 USD
B. Long term Scale (2 Years)
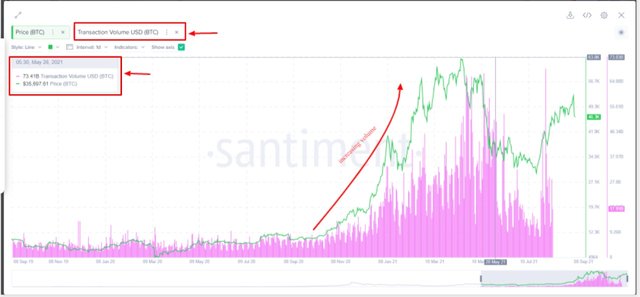
On May 26, 2021 There was an Spike in the transaction volume recorded at 73.41B While the BTC price stood at 35697.61USD
While analyzing on Long term and short basics you can see that The Transaction Volume Doesn't always correlate with the price of an asset, but with the change in transaction volume you can find Rapid spike in the Price of an asset.
Network Value to Transaction Ratio (NVT)
To Implement NVT Go to metrics section and search for NVT and click On NVT Ratio (With Transaction volume) Then click on Apply selected metrics as shown in the image below.
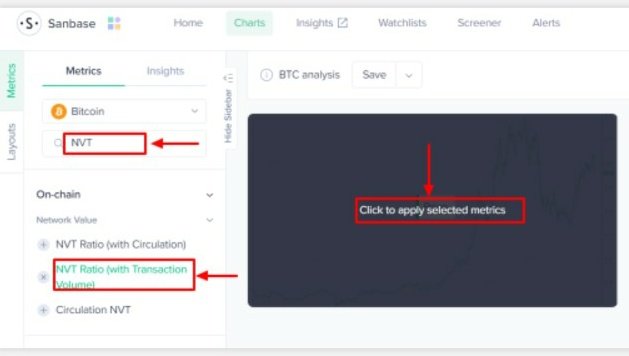
Network Value to Transaction is computed by dividing the network value by the Total transaction volume, In simple words it Describes as the ratio of market capitalization divided by transacted Volume.
It helps in measuring whether The network is over valued or not, if the NVT is higher that means asset is overvalued as compared to the transaction volume, on the other hand Lower NVT describes asset as undervalued.
A. Short term Scale (3 months)
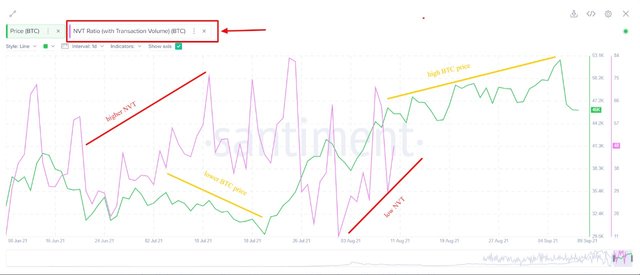
In the observation, On July 24 2021, NVT ratio with transaction Volume Hit Almost 84 While the BTC Price stood at 34300USD, On the other hand on August 09 2021, NVT Stood at 29.24 While the BTC price increased to 46300USD, means NVT works opposite, When NVT is low the price is most likely to go high And Vice - Versa.
B. Long Term Scale (2 years)
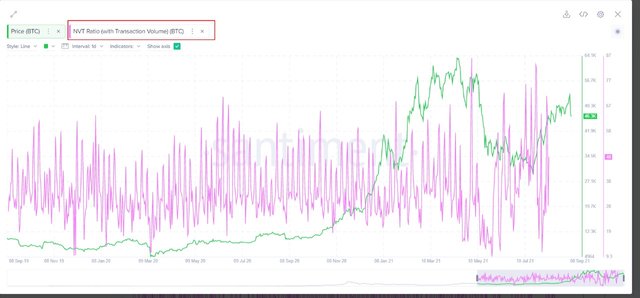
On the long Term scale observation , on June 13 2020, The NVT was around 61.85 While the BTC price Stood at 9500USD, On the other hand On August 1 2021, The NVT Ratio was at 11.25 And BTC price rose to 40000 USD, But as per my observation it's not certain that low NVT always result in higher price but yeah Most likely Tend to go up, but you should take help of other available indicators for more accurate results.
Exchange flow Balance
To Implement Exchange flow Balance, In the metrics section search for the Same and then click on apply selected metrics as shown in the image below.
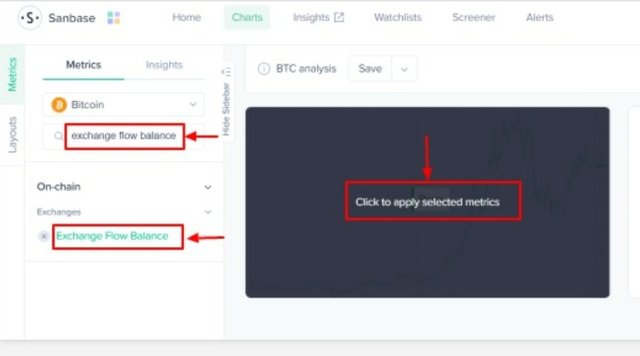
Exchange flow Balance Defines the Value of an asset Transferring in and out of an Exchange over the time, Usually When More of asset inflow in an exchange from Decentralized wallet then it is considered as an Bearish Indication.
While on the other hand Exchange outflow When Assets are moved from Exchange wallets to Decentralized wallets it is consider a Bullish indication.
A. Short term scale (6 months)
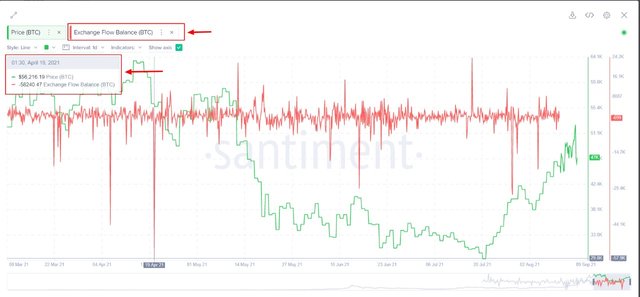
For this Short term analysis i have selected time period of 6 months and i observed that on 19th April, 2021 The exchange flow Balance Of BTC was -58240.47 and at the same time price of BTC stood at 56216.19USD afterwards price keep declined for few days and then on May 08 2021, the price of BTC was 58803.78 USD with an Exchange flow Balance of 1048.07 BTC
B. Long term Scale (3 years)
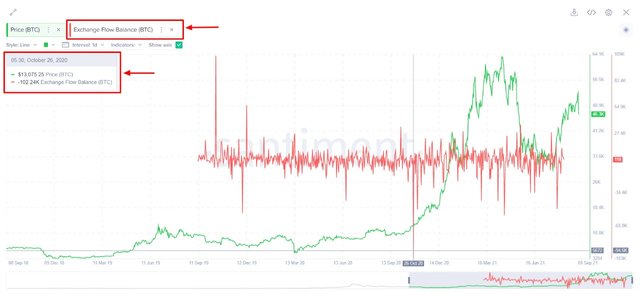
This time for long term analysis i have taken data of 3 years and i observed that on 26th October, 2020 there was an Huge outflow of -102.24K BTC and price of BTC was 13075.25USD.
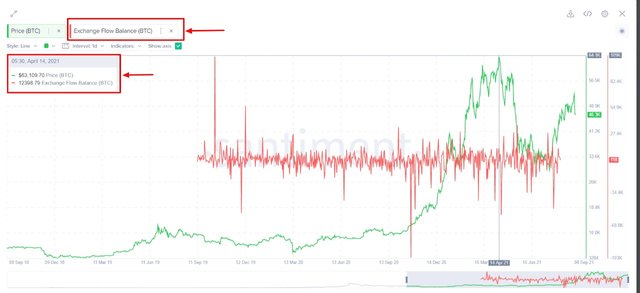
Although on 14 April, 2021 the price of BTC rose to 63109.70 USD with an Exchange flow Balance of 12398.78 BTC.
In my observation Exchange flow Balance signals could be wrong sometime especially in short term analysis that's why i suggest to use more available Indicators and tools to get more accuracy..
Supply On Exchanges
To Implement Supply on Exchange, go to metrics tab and Search for the same and click on Supply on exchange (as % of total supply) And then click on apply selected metrics as shown in the image below.
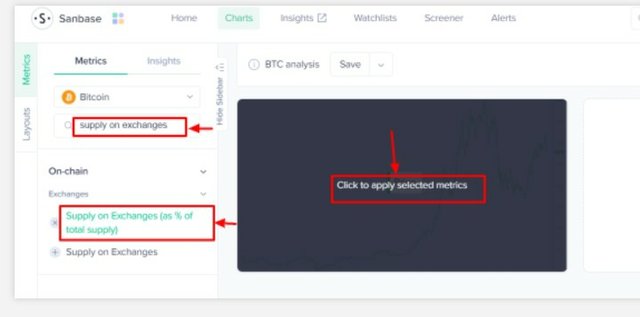
The supply on exchange as a percentage of total supply on chain metrics which works opposite to the movement price, The inflow of Coins /Tokens on an exchange Gets included in the Total supply and result in influencing the price of an asset.
In simple Words it works like the rule of demand and supply, When the Exchange supply of an exchange is high the price of an asset usually decline and when the exchange Inflow Is low, the asset price is goes up.
A. Short term Scale (6 Months)
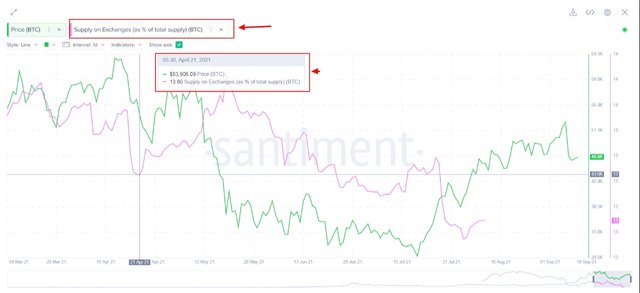
In the short term i observed that the lowest Supply which was on April 21,2021, where supply on exchange was 13.60% while the BTC price Stood at 53906.09 USD. While on May 19, 2021 The supply % on Exchange was 14.32% And the btc price stood at 37002.44USD. Which defines that increasing in supply can result in Decrease in price of the asset.
B. Long term Scale (2 Years)
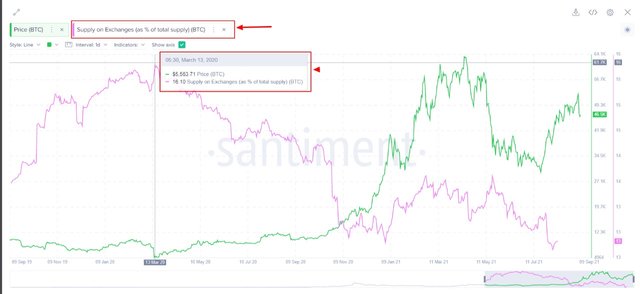
In the Long term Scale I observed that on March 13, 2020 (highest % supply On graph) The exchange supply was 16.10% And the BTC price stood at 5563.71 USD,
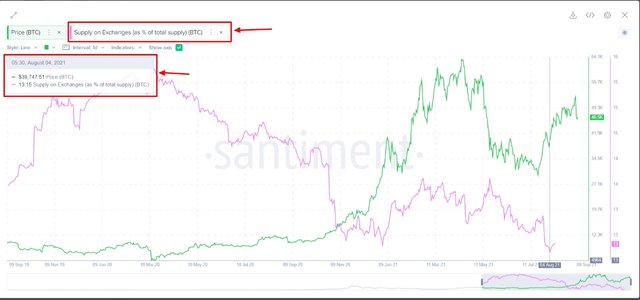
While on August 4 2021(Lowest % Supply on graph) The price of BTC was 39747.51 USD with an Exchange Supply percentage of 13.15, so you can observe once again The lower the % of supply on exchange is most likely to increase the price of the underlying asset
Are the on-chain metrics that you have chosen helpful for short-term or medium-term or long term(or all)? Are they explicit w.r.t price action? What are its limitations? Examples/Screenshot?
With my experience in this task i can say that On chain metrics works well when you are considering on long term basics, With a Fundamental Analysis, Because in the short term the signals can be false most of the time.
In the short term it could be a spike because of some positive news for the asset Or it could be anything resulting influencing the price of the asset, But on the long terms basics it works fundamentally and you can see clear signals means more accuracy than short term basics.
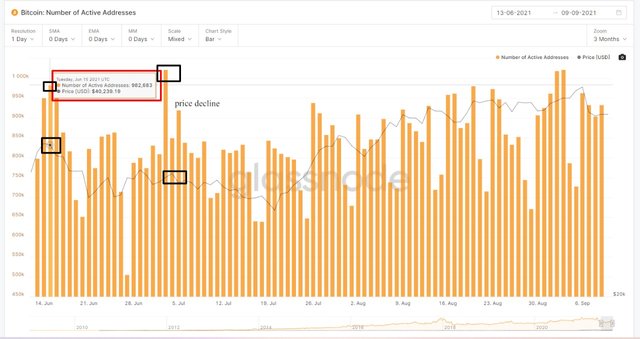
For Example while analysis the daily active address on short term, in the beginning there was active address peaked at almost 950K with an recorded BTC price of 40239.16USD, then later on 3 Julythe number of daily active address increased over 1M but still the price of BTC dropped to 34674.53USD
To get the best Data, it is recommended to combine both of the data and take all the possible data into consideration for analysing proper on chain metrics of an asset, for both price movement and fundamental analysis.
In my opinion i found the analysis helpful in terms on long term basics.
Another limitation of On chain metrics that The data it provides is recorded from the particular network activities But in term Of initial coin offerings can alter the Signals without any huge impact on price movement.
Conclusion
In my final words i understood on chain metrics well and i learnt that we can get more accurate results if we follow and use the indicators in a proper way, i also learnt about the Concept of demand and supply.
Thank you prof @sapwood
Screenshot Data taken from, Glassnode coinmetrics and Santiment :)