Hello steemian ...
This is my new post in the Steemit Crypto Academy community, on this season 6 week 3, I will be working on a homework from professor @nane15 with the theme "Basics to trade cryptocurrencies correctly. | Part 2”.

we will discuss it through the homework below:

1.) Explain your understanding of charts, candlesticks, and time frames. (Use your own words and put screenshots)
Charts
A graph is a visual display that is formed from a large number of data sets. This graph is a common tool and almost every field uses graphs, such as studying mathematics, physics, and others. The formation of graphs from data collections can help us to make it easier to conclude the data obtained. Graphics also have many types of views that can be used according to the convenience and desires of the users.
Graphics are not only in school, they are also very important in the crypto world. The graph formation on the crypto market is taken from the data of traders in buying and selling assets or the amount of supply and demand for assets. The graph formed on the crypto market helps us, traders, to analyze the crypto market price for each asset. Performing chart analysis is necessary to gain profit in trading the crypto market. There are several types of chart displays that we can use in the crypto market, such as candlesticks, bars, lines, and others. To be clear, we can see from some of the crypto market graphic displays in the image below.


We can see several types of graphic displays that we can use as shown in the image above. Although the three graphs above have a different appearance, the three graphs above provide one thing in common, namely the movement of horizontal and vertical graphs. Horizontal and vertical movements have different meanings, vertical movements, namely the ups and downs of the graph are influenced by the amount of supply and demand that occurs in the market, while horizontal movements are influenced by the timeframe used.
On the chart, we can find out what is happening in the market such as high demand and supply at that time, we can also find out the price history that has happened, from the price history we can also place support and resistance areas, and a lot of other information that can be used. we get with the graph. Charts are also indispensable for conducting market fundamental analysis.
Candlesticks
Of the many choices of chart visual displays, the most commonly used chart visual display is the candlestick. The candlestick chart display gives us a lot of information, from the candlestick chart we can find out the opening price, closing price, highest price, and lowest price on each selected timeframe, this information is very useful for technical analysis. More details of the candlestick chart can be seen in the image below.
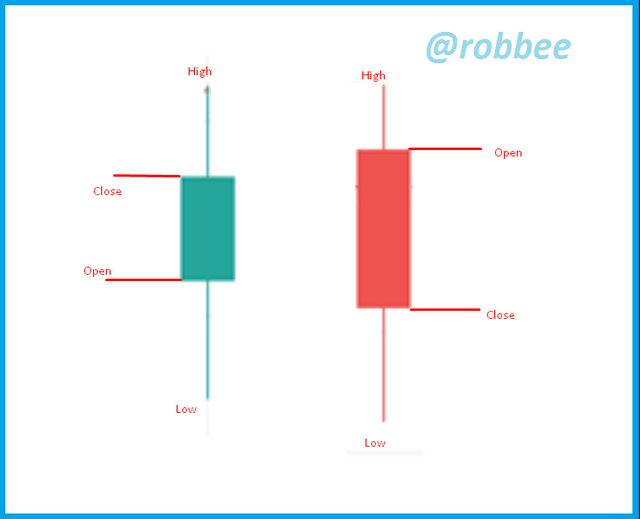
As the name implies, the shape of the candlestick resembles a candle that has a wick. Candlesticks have two default colors, namely green and red. The two default candlestick colors also provide information, if the candlestick chart is green, it means the chart is bullish, while if the candlestick is red, it means the chart is bearish. A bullish candlestick occurs if the closing price is above the opening price and vice versa if the closing price is below the opening price, a bearish candlestick will be formed.
From the candlestick chart, we can find out the opening price and closing price of the market by looking at the body of the candle, on the candlestick chart we don't forget the axis on the chart. The axis provides information on the highest bid and asks prices that occurred at that time. The up axis is the highest ask price and the down axis is the highest offer price.
Timeframe
In simple terms, the timeframe is the distance graph at each time used. For example, when we use a candlestick chart with a 1-hour timeframe, each candlestick that is formed is taken from supply and demand data for one hour. After running for one hour, one candlestick will close at the price it reached for one hour and start forming a new candlestick. More details can be seen in the image below.

As can be seen in the candlestick chart above, each candlestick that is formed above is taken from supply and demand data that occurs during one hour for the asset. After one hour, the candlestick chart will start creating a new candlestick and so on. When we change the timeframe, the chart will automatically change, for example when we change it to 30 minutes, each candle will take demand and supply data for 30 minutes, when 30 minutes have passed, the candle will form a new candle.
When we change the timeframe from 1 hour to 30 minutes, more data will be displayed, when the 1-hour timeframe displays one candle for one hour then when we change the timeframe to 30 minutes it means that the previous hour candle will turn into 2 candles, with so the data we get for an hour will be more. an example can be seen in the image below.

In the picture above, I have marked one candle on the one-hour timeframe, on that candle we can see that the candle is bearish. Even though the 1-hour candle above is bearish, it is not necessarily a one-hour candle that will always be bearish, it could be that at a smaller time a bullish candle has formed. For more details, see the image below.

In the picture above is a candlestick display on a 30-minute timeframe, as we can see when I change the timeframe display from 1 hour to 30 minutes, the previous 1-hour candle turns into 2 30 minute candles. When we change the timeframe to a smaller one, more candles will be formed automatically, for example, I will give a 5-minute timeframe view.

As can be seen in the picture above, I have reduced the timeframe to 5 minutes, as we know the candle that is formed for one hour is a bearish candle, when I change the timeframe to 5 minutes we can see that there are 3 bullish candles formed.
The size of the timeframe can determine whether we make long-term or short-term trades, large timeframes are usually used for long-term trading on the contrary if small timeframes are used for short-term timeframes. In addition, we can also combine several timeframes to perform certain technical analyses.

2.) Explains how to identify support and resistance levels. (Give examples with at least 2 different graphs)
Before discussing how to identify support and resistance levels, it's a good idea to repeat a little about what support and resistance levels are. Support levels and resistance levels are the basis for technical analysis. Support level and resistance level are two things that can not be separated, for the position of the support level is always below the resistance level. The support level is an area that is formed when the price chart has stopped falling and starts to rise again, when this happens we can create a support level in that area. While the resistance level is an area that is formed when the price chart has stopped rising and started to fall, when this happens we can create a resistance level in that area. Support levels and resistance levels are formed using the closing price every time, meaning that we can use a line chart to create support and resistance levels, after creating support and resistance levels on the line chart, we will return to the candlestick to trade the market. For more details, see the image below.
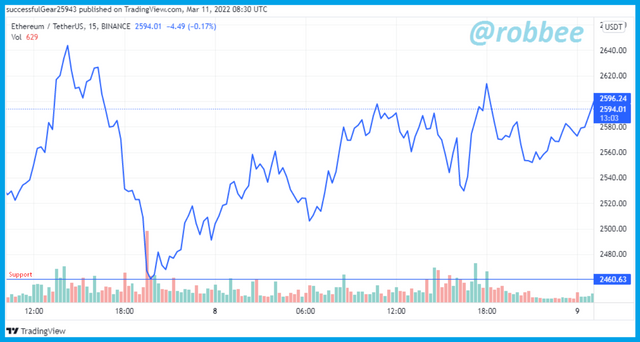
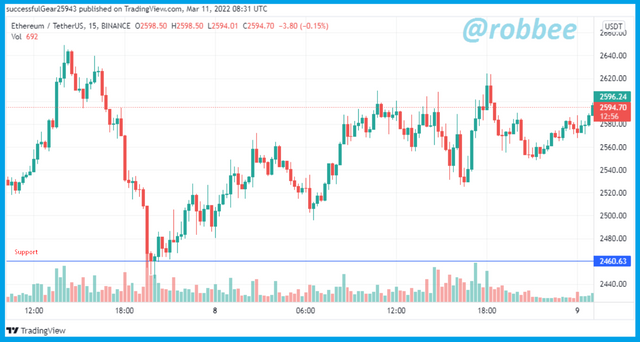
The picture above is an example of a support level, as we can see the graph initially decreased, then the graph stopped falling and started to increase, so that area is a support level area.
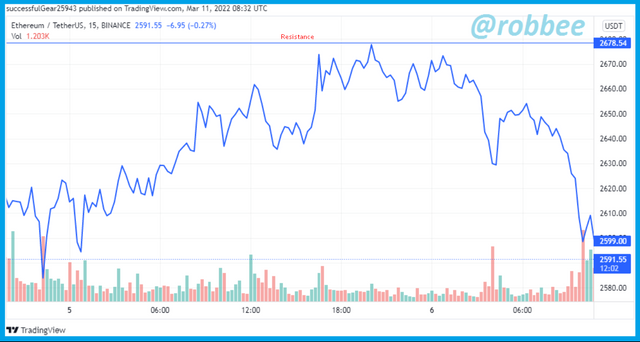
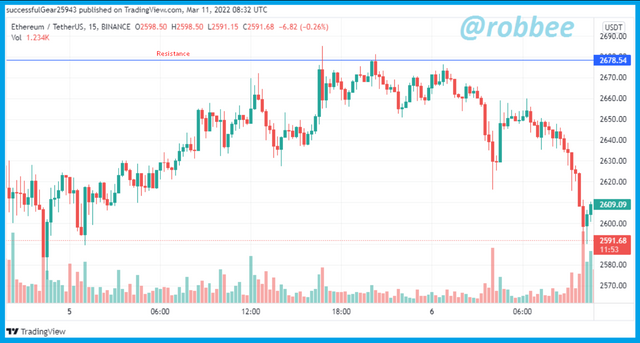
The picture above is an example of a resistance level, as we can see that the graph was initially up, then the graph stopped rising and started to decline, so the area of the graph that stopped rising is the resistance level area.
The support level will not always be the area of the support level and the resistance level will not always be the area of the resistance level. The support level may turn into a resistance level when the chart begins to break through the support level area and form a new support level, while the resistance level can become a support level when the price chart breaks the resistance level and begins to form a new resistance level. For an example, see the image below.
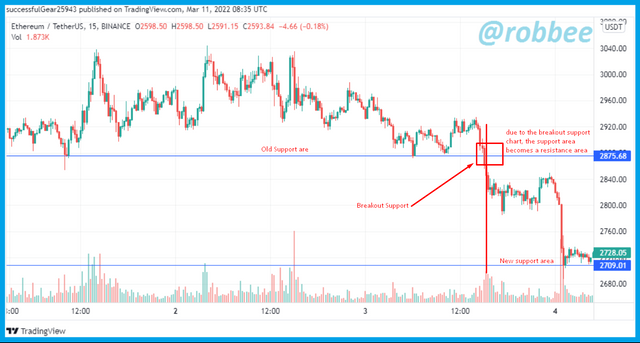
As can be seen in the picture above, the support level area has been formed previously until the chart breaks out at the support level. Due to the breakout chart at the support level and forming a new support level, the old support level turns into a resistance level.
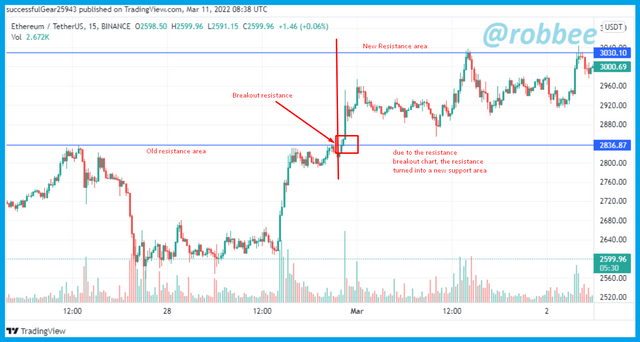
As can be seen in the picture above, the resistance level area has been formed previously until the chart breaks out at the resistance level. Due to the breakout chart at the resistance level and forming a new resistance level, the old resistance level turns into a support level.
Support levels and resistance levels are usually used by traders to analyze the next market price movement, when the graph breaks the resistance level, it indicates the graph will increase, when the graph breaks the support level, it indicates the graph will decrease. This is used by traders as a signal to enter the market. when the support level and resistance level have been formed traders just wait for the chart to break the support level or resistance level to start entering the market.

3.) Identifies and flags Fibonacci retracements, round numbers, high volume, and accumulation and distribution zones. (Each one in a different graph.)
Fibonacci Retracements
Fibonacci retracement is a tool to analyze the market in the form of several horizontal lines. The lines that form on the Fibonacci retracements are not arbitrary, they are formed based on a series of Fibonacci numbers or the Fibonacci series. The Fibonacci sequence was introduced by the famous mathematician from Europe, namely Leonardo Pisano (Fibonacci). Then the sequence of the Fibonacci sequence is converted into a percentage and is called the Fibonacci ratio.
Fibonacci retracements are used by traders to determine support and resistance areas with a note that this tool is very good for use in trending markets. Fibonacci retracement can be used when the market is in a bullish or bearish trend. To use Fibonacci retracement in a bullish trend, we can put the first point at the lowest price and then place the next point at the current highest price, as an example can be seen in the image below.

As can be seen in the picture above, the Fibonacci retracement has been formed. The first point when making a Fibonacci retracement is a support area. Each line formed on the Fibonacci retracement is support and resistance, the initial line formed or point (1) is support, the next line is resistance when the chart breaks the first resistance, the first resistance will become new support and the next line will become new resistance. , and so on.
To make a Fibonacci retracement in a bearish trend, we place the starting point at the current highest price and the next point at the nearest lowest price, as an example can be seen in the image below.

As can be seen in the picture above, the Fibonacci retracement has been formed. The first point when making a Fibonacci retracement is a resistance area. Each line formed on the Fibonacci retracement is support and resistance, the initial line formed or point (1) is resistance, the next line is support, when the chart breaks the first support, the first support will become new resistance and the next line will become new support, and so on.
Round Numbers
In contrast to Fibonacci retracement which is a tool to determine support and level areas, these round numbers are an analysis of traders' habits of supply and demand. Usually, traders will take profit or stop loss at round prices such as 200, 250, and so on, they are rarely or almost impossible to place a take profit or stop loss at prices such as 278.5, 332.2, and so on. This creates a lot of supply and demand at the same price, when the chart hits the round number then the chart has a high probability of bouncing or breaking out.
Because of this, round numbers can be used as a benchmark to place support and resistance areas on the chart. For more details, see the image below.

As you can see in the picture above, I put resistance at 2620 round number and put support at 2580. As you can see that several charts bounced on resistance and some charts bounced on other round numbers, therefore round numbers can be used as Good support, and resistance areas are due to human habits in placing take profit and stop loss in round numbers.
high volume, accumulation, and distribution zones.
Trading volume is one of the important things to know the number of transactions at each timeframe. From the trading volume we can find out whether the trade that occurred is large or small, and this is very useful especially if we combine it with accumulation and distribution. As we know that accumulation zones are areas where big investors buy assets gradually when prices are low to get lots of assets when prices are low, while distribution zones are zones where big investors sell assets that have been previously collected when prices are high.
Now, where is the relationship between the accumulation zone, distribution zone, and high volume? Of course, these three things are very closely related, when the accumulation zone, which means big investors buy assets gradually, and also the distribution zone, where investors sell assets, of course, both zones have large volumes. An example can be seen in the image below.
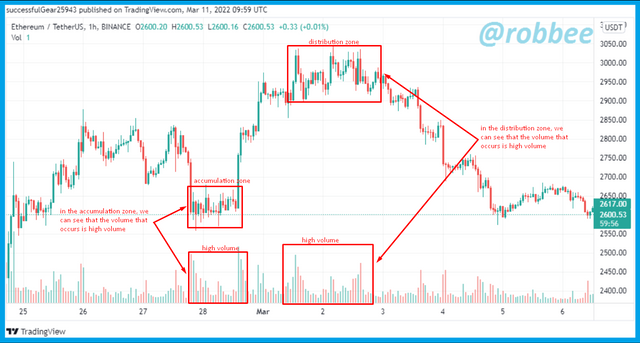
As can be seen in the picture above, initially the accumulation zone is formed and the volume is formed when the accumulation zone is high volume, then the price rises and begins to enter the distribution zone, as we can see when the high volume distribution zone is formed.
By knowing the combination of these strategies, we as small investors and small traders can follow the prices made by big investors to get profits. as a note that the accumulation and distribution zone is stated to be small, the market moves laterally as shown above.

4.) It explains how to correctly identify a bounce and a breakout. (Screenshots required.)
Once we know how to identify support and resistance levels, we also have to know how to take advantage of them, there's no point in knowing how to identify support and resistance levels but we don't know how to take advantage of them.
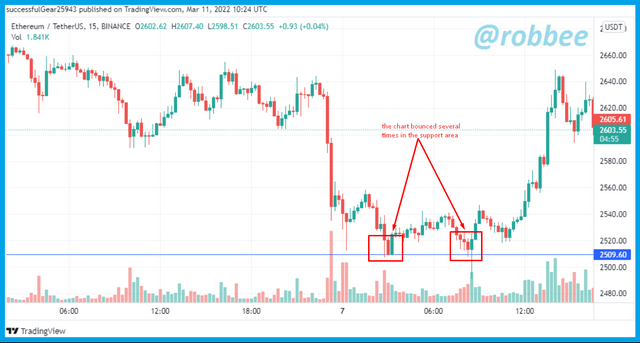
In support and resistance, there are two terms, namely bounce and breakout. A bounce is a price chart condition that touches a support or resistance level and then bounces back against the previous direction. For example, when the chart is up and then reaches the resistance level after the chart hits the resistance level, the chart bounces back and starts to fall differently from the previous chart direction, for more details, see the example below.
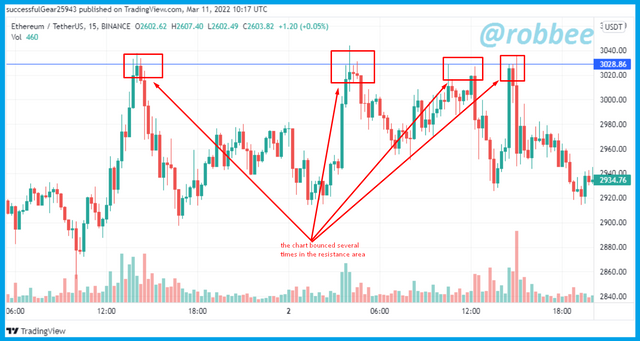
As can be seen in the picture above, the price chart bounced at the resistance level several times, this means that the chart is unable to rise above the resistance level that has been created. When the bounce occurs we can conclude that the price will go down and we can take a sell entry, with a note that we must use other technical analysis to confirm whether the chart will go down or not. Other examples that occur at the support level can be seen in the image below.
In addition to the bounce, there is one more condition, namely a breakout. This breakout occurs when the price chart can pass the support or resistance level, after the price chart passes the support or resistance then the price chart continues its direction. An example can be seen in the example below.
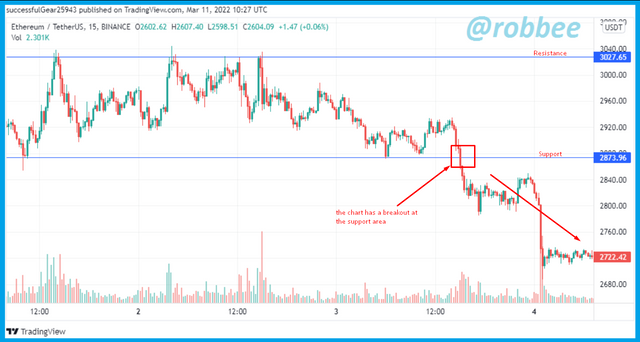
As can be seen in the picture above, the support and resistance areas have been formed. After that, we can see the chart has a breakout at the support area which gives a signal that the chart will go down, after the chart has a breakout at the support level, we can see the chart continues in the direction of the breakout. For an example of a breakout of resistance, see the image below.
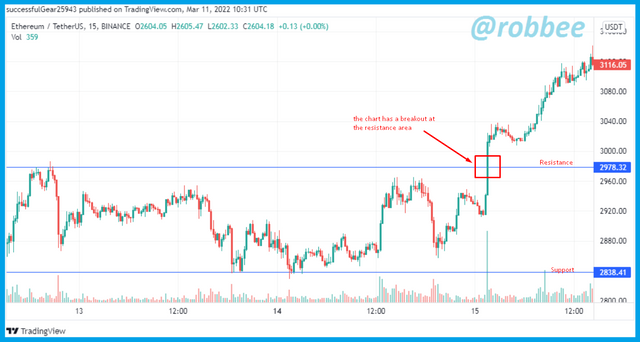
For the record, the breakout that occurs can be a false breakout. Usually when the candle breaks out followed by a large volume when the candle breaks out. To find out a successful breakout or a false breakout, we can add other technical analyses to confirm the breakout.

5.) Explain that it is a false breakout. (Screenshots required.)
A false breakout occurs when the chart initially breaks out in the support or resistance area, then the chart does not continue its movement as it should and instead returns to the support and resistance area. For more details, see the image below.

In the picture above there are two false breakouts that we can see. First, we can see that the chart has a breakout in the resistance area, which means the chart will increase, but, after a breakout in the resistance area, the chart re-enters the support and resistance zone, which means a breakout in the resistance area is a false signal. Then in the same picture, the chart had a breakout in the support area which gave us a signal that the chart would decline, but after experiencing a breakout the chart support area did not continue its decline and the chart re-entered the support and resistance zone, meaning a breakout in the support area. is a false breakout.
This false breakout usually occurs because big investors deliberately lure small investors to think that the chart will be a successful breakout, after small investors start to think that the chart is a breakout, the big investors make the chart turn around, and re-enter the support and resistance zone. To avoid false breakouts, we can use the help of indicators, such as the RSI indicator, volume, and others that function to confirm the breakout that occurred.

6.) Explain your understanding of trend trading following the laws of supply and demand. It also explains how to place entry and exit orders following the laws of supply and demand. (Use at least one of the methods explained.)(Screenshots required.)
The basis of ups and downs in asset prices depends on the amount of supply and demand. The chart will rise when the demand is greater than supply, this will make the asset enter into a bullish trend. On the other hand, when there is more supply than demand, the graph will fall, causing a bearish trend. The two things I have described are the basis of the law of supply and demand.
When we know the law of supply and demand. Now is how we know if more demand or supply is going on on the price chart. As I explained earlier that the price will rise when there is more demand than supply which causes a bullish trend, we can see this directly on the price chart. When demand is more than supply then the graph will increase and always form a higher peak than the previous high accompanied by high volume at each high peak. To explain more, we can see the example below.
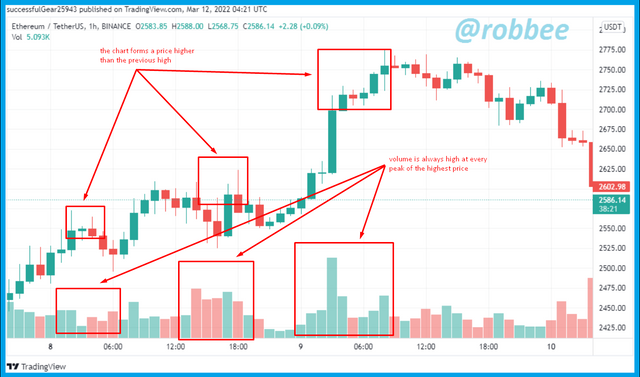
As can be seen in the example chart above, the price chart always forms a peak that is higher than the previous high and the volume at each peak is fairly high which causes a bullish trend to form. When a graph like an example above is formed, it indicates the amount of demand is greater than supply.
The second condition is when there is more supply than demand, which creates a bearish trend. Now how do we know that supply is more than demand if we just look at the graph? When there is more supply than demand, the chart will form a new low lower than the previous low and accompanied by high volume. For more details, see the example below.
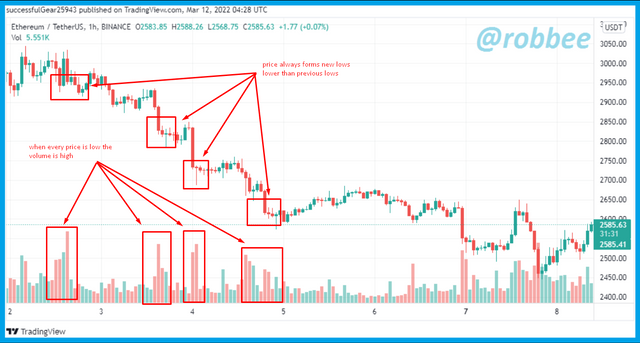
As can be seen in the example chart above, the price chart always forms a new low that is lower than the previous low and the volume at each low is high which causes a bearish trend to form. When a graph like an example above is formed, it indicates that the amount of supply is greater than the demand.
Placing Entry and Exit Following the Law of Demand and Supply
After we know the basic law of supply and demand, then we will now learn how to enter and exit using the law of supply and demand. There are 3 ways to enter using the law of supply and demand. The three ways of entry are as follows:
1. Final Retracement Following Elliot Wave
The first way is to use Elliot waves. Elliott wave is one of the technical analyses that is often used by traders to read the direction of the trend by looking at the waves that are formed. The Elliot wave theory was created by Ralph Nelson Elliott. This Elliott wave consists of three waves with two peaks and two valleys. For more details will be shown an example.
To make an entry, use the Elliot wave strategy by waiting for the end of the trend and drawing an Elliot wave, meaning that when the trend is bullish, we will draw an Elliot wave when the bullish trend is over, and vice versa if the trend is bearish, we will draw an Elliot wave when the trend is over. bearish is over. As we know that the Elliott wave consists of three waves, namely a, b, and c. Elliot waveforms in a bullish trend when the volume of wave “c” is less than the volume of wave “a”, then a new high is higher than the previous high and a new low is lower than the previous low. If all three conditions are created then we can enter. For more details, see the image below.
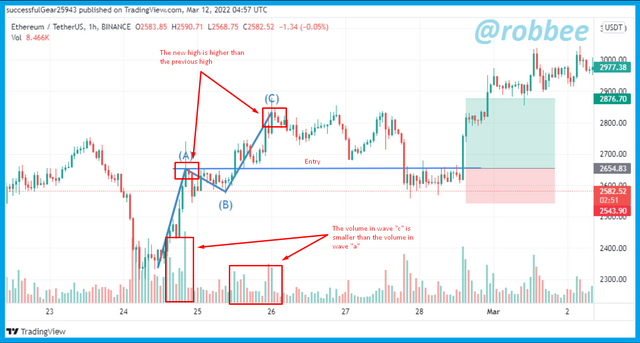
As can be seen in the example image above, the Elliot wave is formed in a bullish trend with all three conditions being met. We can do an entry buy at the end of wave "a" or the beginning of wave "b" as shown above. we can place a stop loss below the beginning of wave "c" or the end of wave "b", take profit we can take a 2:1 ratio of stop loss.
2. Entry after a pullback
The entry after pullback strategy is a strategy used when the market is trending. Simply put, this strategy is used when the market is trending, for example, the market is in a bullish trend, then the chart experiences a retracement, when the retracement occurs we just need to wait for the pullback chart to take an entry, we can take an entry when the chart passes the previous high if the market is in moderate condition. bullish trend. The second condition to follow is that the volume when the chart breaks the previous high must be greater than the retracement volume. For more details, see the example image below.
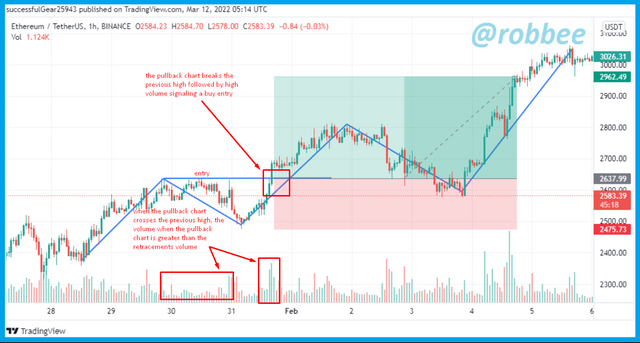
As can be seen in the picture above, the chart is in a bullish trend. After the chart hits the initial high, the chart retraces, then the chart pulls back past the previous high. Apart from the chart breaking the previous high, we can see that the volume during the retracement is smaller than the volume during the pullback. With both conditions met, we can enter when the chart breaks the previous high. Stop-loss can be placed below the current lowest price and place a take profit in a 2:1 ratio as in the example above.
3. Market Trap
This third strategy requires us to take advantage of false breakouts. I've explained before knowing that the false breakouts are intentionally made by big investors to lure small investors to enter and finally the big investors' market exits the market and causes a false breakout to occur which can harm investors or traders who have already entered when the false breakout occurs.
The way to profit in the market is to follow what the professionals think of the big investors who can move the price. Therefore, when a false breakout occurs, the graph will often move in the opposite direction to the false breakout that occurs and is followed by a large volume. That way we can make an entry when a false breakout occurs. For more details, see the image below.
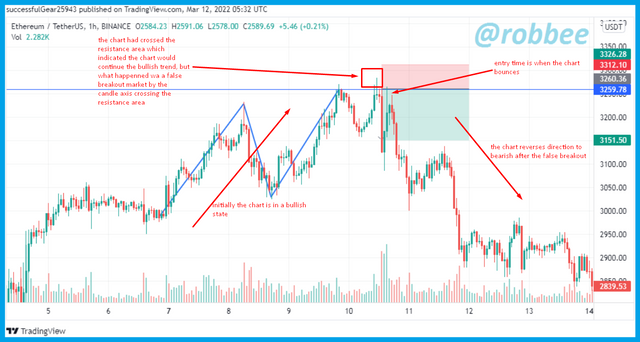
As can be seen in the example chart above, initially the chart was in a bullish state by forming a new high that was higher than the previous high. The bull trend stops when the false breakout occurs, we can see that the wick of the candlestick passed the resistance level, which means the chart had passed the resistance and passed the previous high which indicates the trend will continue to be bullish, but as we can see the chart is back down and moving against the direction of the breakout that caused the previous breakout to be a false breakout, we can also see a large volume when a false breakout occurs. Due to the false breakout, we are entering the market as in the example above. we can place a stop loss far above the axis of the false breakout and place a take profit with a ratio of 2:1 from the stop loss as in the example above.

7.) Open a live trade where you use at least one of the methods explained in the class. (Screenshots of the verified account are required.)
To solve this problem I use the indodax platform on ETH/IDR coins. From some of the strategies I have learned in this week's assignment, I will trade using the Final Retracement Following Elliot Wave strategy. As we have learned previously that the Final Retracement Following Elliot Wave strategy several conditions must be met to use this strategy. The first condition is that we have to wait for the end of the trend, then we draw an Elliot wave which consists of three waves, namely a, b, and c. After drawing the Elliot wave, next, we should see that the volume of wave “c” should be smaller than the volume of wave “a”, and finally the new high should be higher than the previous high and the new low should be higher than the previous low. We can see the live trading of ETH/IDR coins in the image below.
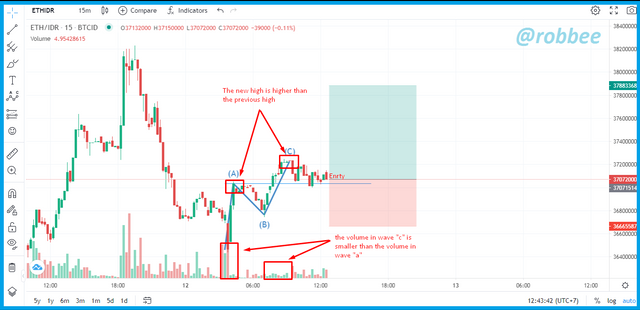
As can be seen in the graphic image of the ETH/IDR coin on the indodax platform. In the picture we can see that I drew an Elliot wave at the end of the bearish trend, then we can see that the volume in wave “c” is less than the volume in wave “a”, the new high is higher than the previous high and the new low higher than the previous low. because the Final Retracement Following Elliot Wave strategy has been fulfilled, I made an entry at the price of 37072000 IDR or 2586.46 USDT. Then I placed a take profit below wave “c” at the price of 36665587 IDR or 2558.09 USDT and placed a take profit with a 2:1 ratio of stop loss at the price of 37883368 IDR or 2641.87 USDT. For proof of trading, see the image below.


8.) Conclusion
A graph is a tool that is created from a collection of data. These graphs are helpful when you want to conclude a data set. Not only can they help in concluding data sets, but charts are also indispensable in trading markets. In the market, charts are needed to show the amount of supply and demand that occurs in the market, so charts can help traders carry out technical analysis to gain profits when trading, charts on the market move horizontally and vertically. The vertical movement of the chart is influenced by the amount of supply and demand, while the horizontal movement of the chart is influenced by the preferred timeframe. The graphic display on the crypto market has several types, such as candlesticks, bars, lines, and others. all graphic displays can be used according to your needs and convenience. Although the most commonly used display is the candlestick because a lot of information can be obtained, the appearance of this chart also affects the vertical movement of the chart. Timeframes are also very much needed on charts, especially for horizontal chart movements. Timeframe affects the appearance of the chart, if the selected timeframe is 1 hour, then 1 candle is supply and demand data for one hour.
In addition to charts that are indispensable for technical analysis, there is a basic technical analysis strategy that almost everyone uses because of its convenience, this strategy uses support and resistance, support and resistance, this helps us in doing technical analysis and can be combined with other technical analysis. Identifying support and resistance is also fairly easy, we only need to look at price movements that have stopped falling to place support areas and price movements that have stopped rising to place resistance areas. With the ease of identifying support and resistance, this analysis technique is widely used by traders.
In addition to the ways to identify support and resistance above, we can identify support and resistance in different ways, such as using Fibonacci retracements, round numbers, high volume, zones of accumulation, and distribution. There are many ways to identify support and resistance. In addition to identifying support and resistance, there are two very important terms used in support and resistance strategies, the two terms are bounce and breakout. The bounce occurs when the chart bounces off the support and resistance area, usually this bounce signals a reversal of the chart direction, and a breakout occurs when the chart crosses the support or resistance area, this breakout usually indicates a continuation of the chart direction. But not all charts that break out of support or resistance will continue the direction of the chart, it could be that the breakout that occurs is a false breakout that is intentionally made by big investors. To anticipate a false breakout, we can use additional analysis to confirm the breakout that occurred.
In addition to charts and resistance support, one very important basic thing we learn is the law of supply and demand. The graph will go up if the amount of demand is greater than the supply, conversely, if the amount of supply is greater than the demand then the graph will go down. We can also take advantage of the law of supply and demand by using several strategies, namely Final Retracement Following Elliot Wave, entry after a pull back, and market trap. With so many basic strategies that can be used to profit when trading, it is hoped that some of the basic strategies that have been learned in this class can be used in live trading.

References:
https://www.tradingview.com/chart/ITAaNOcQ/
https://indodax.com/en/
