Hello steemian ...
This is my new post in the Steemit Crypto Academy community, on this season 6 week 3, I will be working on a homework from professor @kouba01 with the theme "Crypto Trading Using Trix Indicator”.

we will discuss it through the homework below:

1. Discuss in your own words Trix as a trading indicator and how it works
TRIX is an indicator introduced by an editor of a magazine entitled “Technical Analysis of Stocks and Commodities”, named Jack Hutson. This indicator has been introduced by jack Huston since 1980. TRIX is an indicator as a technical analysis tool that is classified as a momentum oscillator that combines momentum and trend. This means that this indicator can be used to see the direction of the trend and also as a momentum signal. The main component of this indicator is the speed of the moving average which is tripled exponentially.
The way TRIX works is by generating signal line crossovers and divergence. A line crossing above the signal line when the TRIX line is negative indicates an increase in upward momentum, conversely if the line crossing below the signal line when the TRIX line is positive indicates an increase in downward momentum. Meanwhile, on a divergent signal, Bullish is indicated when TRIX moves up when the price is down, while bearish is shown when TRIX moves down when the price is up.
TRIX will perform better and be more sensitive in a shorter time frame. As we know that indicators that use moving averages have lower sensitivity on long time frames and will show a lot of lag.

2. Show how one can calculate the value of this indicator by giving a graphically justified example? how to configure it and is it advisable to change its default setting? (Screenshot required)
Calculating TRIX indicator
The TRIX indicator refers to how the line crosses the 0 lines. If it crosses it upwards then it will be positive, otherwise, if it crosses it downwards then it means negative.
The calculation is automatically plotted on the graph displayed on each platform you use. but as a basis, we should at least know where it came from and why it was formed. For that there are several versions in the calculation, the version I use is the TRIX calculation which is based on 4 components:
From the figure, we can conclude that the 4 components are interconnected. The third smoothed EMA uses the 18th period of the second smoothed EMA, and also the second smoothed EMA uses the 18th period of the first smoothed EMA where the first smoothed EMA uses the 18 period EMA closing price. From the three refined EMAs, it becomes the forerunner of the TRIX calculation that comes from the percentage change value of 1 period, from the third refined EMA value.
Then there is the second version, which is the calculation exemplified by the professor in the material given. In essence, the two versions of the formula have the same application and function for their use.
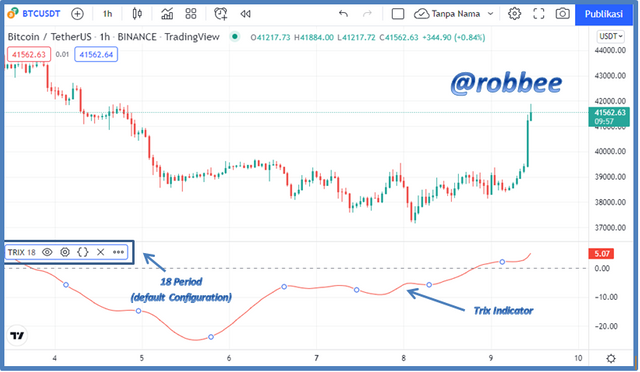
Recommended configuration
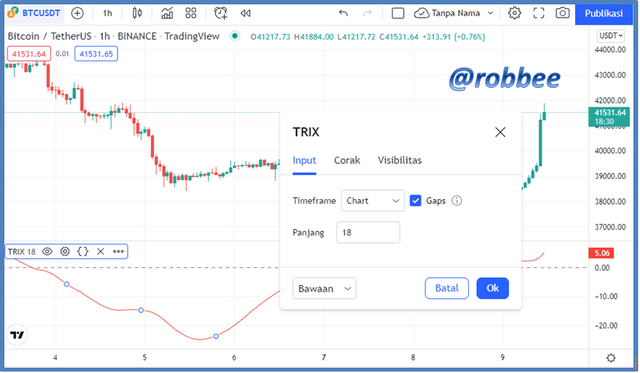
As we know that the default configuration of TRIX is 18 in length. The higher the length value we set, the smoother the signal that will appear on the display we see and this will filter noise better. However, a longer period can affect the amount of lag that results in us often missing opportunities.
Meanwhile, if we reduce the length of the period, then this will result in the signal that is generated will be less smooth. If that happens, then we will find a lot of noise, and signal accuracy will be reduced. In several sources, I found that the recommended configuration for the TRIX indicator is period 12, with the signal line being 4. This is because in this configuration the TRIX indicator can react more quickly to changes in trends that are happening.

3. Based on the use of the Trix indicator, how can one predict whether the trend will be bullish or bearish and determine the buy/sell points in the short term and show its limits in the medium and long term. (screenshot required)
Predict the direction of the trend
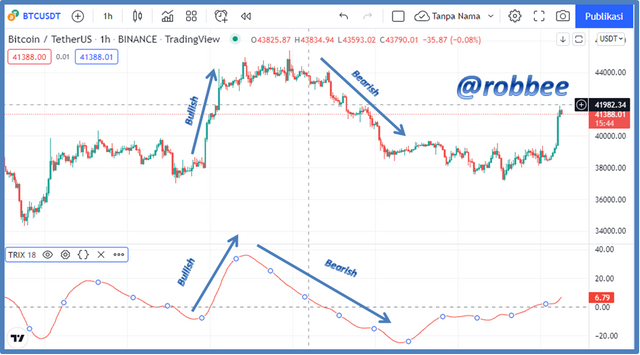
Simply put, a bullish trend on the TRIX indicator is shown when TRIX moves up from TRIX which initially fell or is below the 0, meaning that when the TRIX Bullish trend moves from below the 0 lines, it penetrates upwards past the 0 lines, while the bearish trend is shown when TRIX moves. down from TRIX which initially rose or was above 0, This means that when the Bearish trend TRIX moves from above the 0 lines, it penetrates down through the 0 lines.
From the picture above we can see that the relationship between the chart and the TRIX indicator is interconnected. This means that the bullish and bearish trends shown by the chart and the TRIX indicator are almost the same. However, there is a difference that occurs when the chart is in a sideways period, where when the chart shows a sideways period after an uptrend, the TRIX indicator immediately gives an uptrend signal. On the other hand, if the chart shows a sideways period after a downtrend, then the TRIX indicator immediately gives a downtrend signal, and all of that is accurate.
It can be concluded that the TRIX indicator can not only show trend identification but can also predict trends during sideways periods, which predictions are very accurate.
Buy/sell point
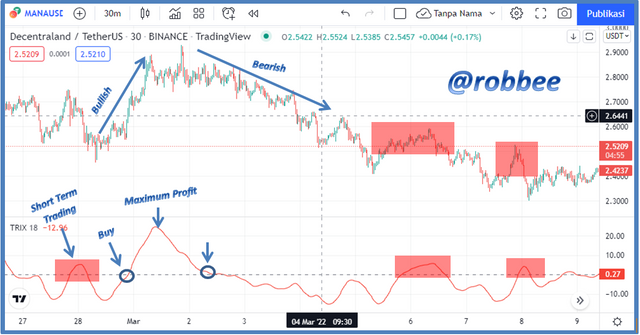
In simple terms, the buy point is when the TRIX indicator is above the 0 lines, that is, in a positive state. This means that a bullish trend has started and the price will continue to rise. Then, the selling point is when the TRIX indicator is below 0, which is in a negative state. This means that a bearish trend has started and the price will continue to fall.
From the screenshot above, we can see that the buy point is located when the TRIX indicator is above the 0 lines where the bullish trend started and the price will continue to rise. And the selling point is when the TRIX indicator is below line 0, where the bearish trend started and the price will continue to fall.
There are several short-term trades that I marked with a red box. The TRIX indicator gives a signal with the appearance of a mountain above the zero point and becomes a place for buying and selling between the two ends. From this, of course, the best sales are at the peak point of the mountain that is formed.

4. By comparing the Trix indicator with the MACD indicator, show the usefulness of pairing it with the EMA indicator by highlighting the different signals of this combination. (screenshot required)
In the following, I will take a screenshot showing a combination of three different indicators, namely TRIX, MACD, and EMA. Of the three indicators, we will see a comparison between the TRIX and MACD indicators, and how the influence of the EMA is an additional indicator.
From the screenshot above, I used the Default settings for the three indicators, namely EMA 9, MACD 12, 26, 9, and TRIX 18. The comparison between MACD and TRIX in terms of appearance is very clear in terms of appearance. We can see that MACD has an additional line feature in the form of a signal line and an additional histogram. While TRIX only has one line which makes it look simpler than MACD. Although it is easy to distinguish them in appearance, we can find almost similar similarities in the shape of their lines. The most the same of the two is the MACD indicator signal line which is very similar to the TRIX line, it looks very precise.
Therefore, what makes MACD special is precise because of the MACD line itself. In addition, the collaboration between the signal line and the MACD line makes the MACD indicator outperform the TRIX indicator in terms of buy and sell signals. Where the MACD indicator can show buy/sell signals based on the intersection of the signal line and the MACD line, while TRIX does not show that specific signal.
Then the effect of the EMA is an indicator to confirm the signal from the TRIX or MACD indicator. The TRIX indicator requires more of an EMA indicator to confirm a trend or buy/sell timing because the TRIX indicator is too worrying to be used as a single indicator. On the other hand, the MACD indicator doesn't need an EMA indicator, because the signal line already provides that information, but additions can be made to increase the accuracy of the analysis

5. Interpret how the combination of zero line cutoff and divergences makes Trix operationally very strong.(screenshot required)
As we know that on a divergent signal, Bullish is indicated when TRIX moves up when the price is down, while bearish is shown when TRIX moves down when the price is up. Or in simple language is when the difference between the price movement and indicator movement then that's the time of divergence.
According to my observations and based on what I found in the market. The TRIX indicator often shows signal divergence when in a sideways condition, meaning that the TRIX indicator is very strong when operating sideways. where when the chart shows a sideways period after an uptrend, the TRIX indicator immediately gives an uptrend signal. On the other hand, if the chart shows a sideways period after a downtrend, then the TRIX indicator immediately gives a downtrend signal, and all of that is accurate. It can be concluded that the TRIX indicator can not only show trend identification but can also predict trends during sideways periods, which predictions are very accurate.

6. Is it necessary to pair another indicator for this indicator to work better as a filter and help eliminate false signals? Give an example (indicator) to support your answer. (screenshot required)
Of course, it is necessary, as we know that there is no perfect indicator in terms of accuracy. For that, we need additional indicators to be juxtaposed with the main indicators that we use. This is so that the collaboration of these two indicators can provide maximum results for our trading.
In this case, I will use the Bollinger Bands indicator as an additional indicator that functions as a filter to eliminate false signals. As we all know, the Bolinger indicator can give a good signal to sell or buy with the reference to the Bolinger band. For that, we can rely on this indicator to be juxtaposed with the TRIX indicator.
Based on the screenshot above, we can see the collaboration display of the TRIX Indicator and Bollinger bands. From this collaboration, the signal given by the Bollinger Band can be used as a more specific buy/sell point. The signal given by the TRIX indicator is about general information about the current trend, then we can use the Bollinger band indicator as a trade entry or exit point, we can even see the maximum selling point signal.
From the picture, I use the buy point when the green candle comes out of the upper band. Then when the green candle continues to rise to a maximum and enters a sideways period, the Bollinger band indicator gives a signal, namely, there is a red candle that comes out of the upper band. More convincingly, the TRIX indicator also gives a signal that the price is heading towards a bearish trend, so we can sell at that time with maximum profit. For the exit point or Stop loss, we can use the Bollinger band signal, that is, when the red candle comes out of the lower band. That is a strategy that I can give based on my knowledge of the use of the two indicators and course based on the function and how each indicator works.

7. List the pros and cons of the Trix indicator:
Pro:
- The TRIX indicator can filter market noise well, this can eliminate the trap of short-term cycles.
- TRIX indicator works more accurately in short time frames.
- Able to predict the trend when the chart shows a sideways period.
- Simple interface and easy to use.
- Displays divergence signals well.
Cons:
- we know that indicators using moving averages are less sensitive on longer time frames and will show a lot of lag.

8. Conclusion:
TRIX is an indicator as a technical analysis tool that is classified as a momentum oscillator that combines momentum and trend. In simple terms, the buy point is located when the TRIX indicator is above the 0 lines, that is, in a positive state. This means that a bullish trend has started and the price will continue to rise. Then, the selling point is when the TRIX indicator is below 0, which is in a negative state. This means that a bearish trend has started and the price will continue to fall.
In use, the TRIX indicator is recommended for traders who use shorter time frames because it will be more accurate. It is recommended to experienced traders who have basic knowledge in reading trends and be careful not to get caught in false signals.

Reference
https://id.tradingview.com/scripts/trix/
https://www.forexbrokerpedia.com/id/indikator-teknikal/indikator-trix/


