Hello steemian ...
This is my new post in the Steemit Crypto Academy community, on this season 6 week 2, I will be working on a homework from professor @reminiscence01 with the theme "Crypto Trading with Price Action”.

we will discuss it through the homework below:

1.) Explain your understanding of price action.
Price action is one of the technical analyses. A price action analysis is carried out by traders to find patterns in price movements that we see so random, these patterns are obtained based on price movements that have occurred before. To do price action analysis we don't need an indicator because of the principle of price action we only need to analyze the movement of the candle by candle. We use this price action as a tool to identify market conditions. Like other technical analyses, there is no technical analysis that guarantees 100% signal accuracy, nor does price action analysis. Two factors support this price action, the first is the time frame and the second is the forex calendar. To perform a price action analysis, there are several things we must know first:
1. Candle Behavior
Candle behavior is divided into 3 types:
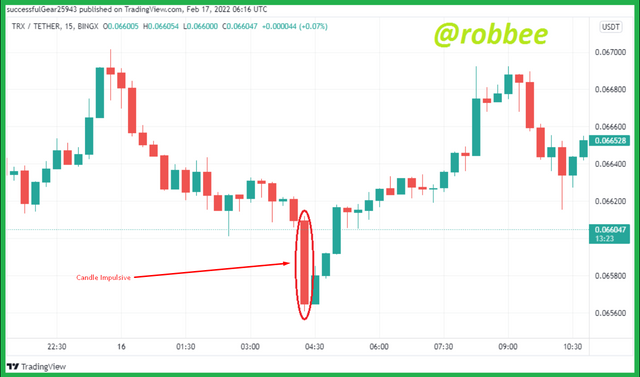
a. Candle impulsive
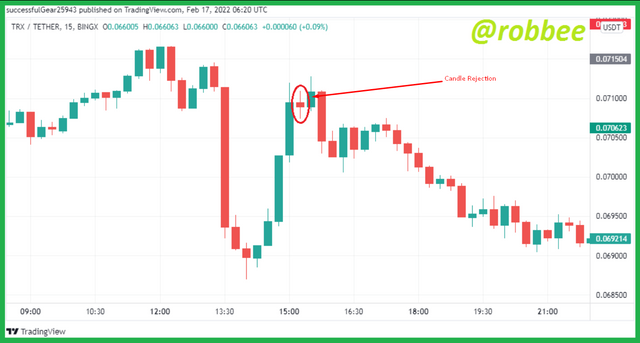
b. Candle Rejection
c. False Break
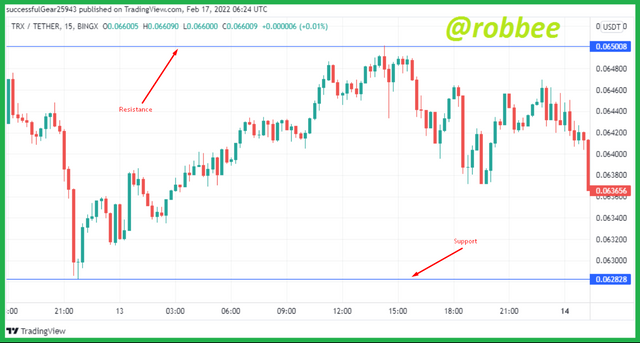
2. Support and Resistance
3. Supply and Demand
2.) What is the importance of price action? Will, you chose any other form of technical analysis apart from price action? Give reasons for your answer.
Price action is one of the most important and useful analyzes of the market. Several reasons make this price action very useful for analyzing market prices.
1. Understand the market structure.
When using price action analysis, we can find out the current market structure just by looking at the chart. The market structure in question is like we can identify the trend that is happening at that time, we can also identify trend reversals, and also we can find support and resistance areas which are very useful in the market. We can also know this by using other analytical techniques, but we need to do the analysis first. By using price action to find it is only necessary to look at the chart. The question is what is it used for? Information about trend direction, trend reversal, and the like is very useful in the market to get a profit. When we know this we can make entry into the market at the right time and exit the market at the right time which makes price action very useful if you want to analyze the market.
2. Reflection on Trader's Emotions and Psychology
Knowing the emotions and psychology of traders is one of the advantages of price action over other analytical techniques. As we know that market price movements are driven by traders, where traders are human beings who have their own emotions and psychology. By using price action we can find out the emotions and psychology of the market at that time by using certain patterns. One pattern that can be used to find out the emotions and psychology of the market at that time is the double top. When we know the emotions and psychology of the market by using price action, then we will know the next market movement. For example, if there is a double top pointing up on the price chart, a double top pointing upwards occurs because the market cannot continue its bullish trend, when this happens, traders will take action to sell the assets they have, this will make the trend reverse to be bearish. . So when a double top occurs on the chart, it indicates a trend reversal will occur.
3. Filter Price Action Noise and False Signals
As we know when trading, we often encounter false signals that can harm us when trading. With price action, we can filter out these false signals that can harm us. Besides being able to filter out false signals, price action can also filter out market noise that can make us confused when we want to trade. Market noise and false signals can be filtered out by looking at price movements in the market or by using Multi-Timeframe analysis. More details on Multi-timeframe analysis will be explained in another question.
From some of the explanations above, we know that price action analysis is a very good analysis that we use in the market. I prefer to use price action analysis than other analyses, but I never use only price action analysis on the market, I always combine price action analysis with other technical analyses to get better results, such as using indicator analysis and price action, using harmonic pattern analysis and price action, and others. The point is when doing technical analysis I always combine price action with other technical analyses to get better results.
3.) Explain the Japanese candlestick chart and its importance in technical analysis. Would you prefer any other technical chart apart from the candlestick chart?
As we know that the movement of up and down market prices is influenced by the amount of supply and demand that occurs in the market. The asset price will rise if the quantity demanded is greater than the quantity supplied, otherwise if the quantity supplied is greater than the quantity demanded will make the asset price fall. The ups and downs of market prices are visualized through a chart that can be seen by traders.
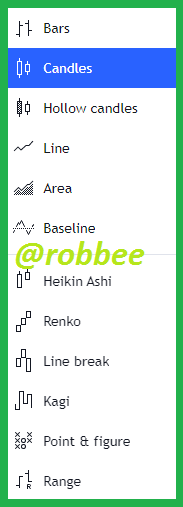
On the price chart, we can find out what is happening in the market such as high demand and supply at that time, we can also find out the history of prices that have occurred, from the price history we can also place support and resistance areas, and a lot of other information. which we can get with the price chart. Price charts are also indispensable for conducting market fundamental analysis. There are many options from the price chart display that can be used, as shown in the image below:
Of the many options for the visual display of price charts, the most commonly used visual display of price charts is candlesticks. The candlestick chart display gives us a lot of information, from the candlestick chart we can find out the opening price, closing price, highest price, and lowest price on each selected timeframe, this information is very useful for technical analysis. More details of the candlestick chart can be seen in the image below.
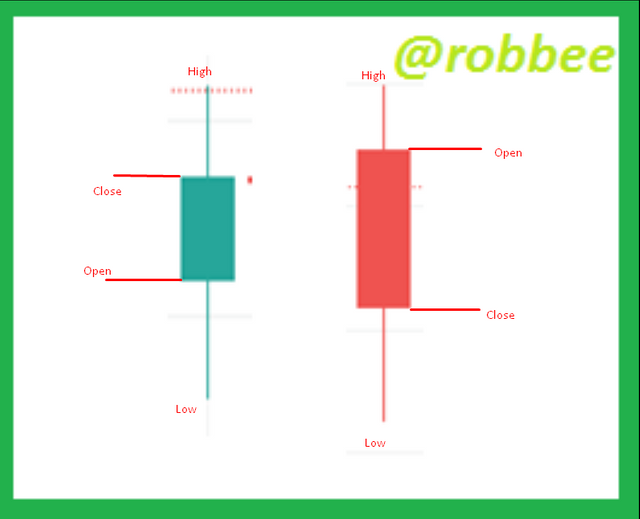
As the name implies, the shape of the candlestick resembles a candle that has a wick. Candlesticks have two default colors, namely green and red. The two default candlestick colors also provide information, if the candlestick chart is green, it means the chart is bullish, while if the candlestick is red, it means the chart is bearish. A bullish candlestick occurs if the closing price is above the opening price and vice versa if the closing price is below the opening price, a bearish candlestick will be formed.
From the candlestick chart, we can find out the opening price and closing price of the market by looking at the body of the candle, on the candlestick chart we don't forget the axis on the chart. The axis provides information on the highest bid and asks prices that occurred at that time. The up axis is the highest ask price and the down axis is the highest offer price.
With so much information provided by candlestick charts, making candlestick charts is one of the most important forms of candlesticks in conducting technical analysis, especially price action analysis. From the shape of the candlestick alone we can find out whether the chart will continue the trend or the direction of the trend will reverse when using price action analysis. If there is an impulsive candle on the chart, it means that the chart will continue its trend, on the contrary, if the rejection candle is formed, it indicates that there will be a trend reversal. The price action analysis can only be used if you use a candlestick chart. Therefore candlestick charts are charts that are indispensable in conducting technical analysis, especially price action analysis.
I prefer candlestick charts to other charts with a lot of information provided and also when doing price action analysis need candlestick charts. Although each chart has advantages and disadvantages, such as a line chart that only provides closing price information which has the advantage of reducing market noise, the drawback is that it provides too little information.
4.) What do you understand by multi-timeframe analysis? State the importance of multi-timeframe analysis.
The multi-timeframe analysis is one of the price action strategies used with one of the goals being to filter out market noise and can also filter out false signals. The multi-timeframe analysis is used by using more than one timeframe. The question is why use more than one timeframe to filter out market noise? As we know that each timeframe of the price chart, has a different trend. An example can be seen in the two images below.
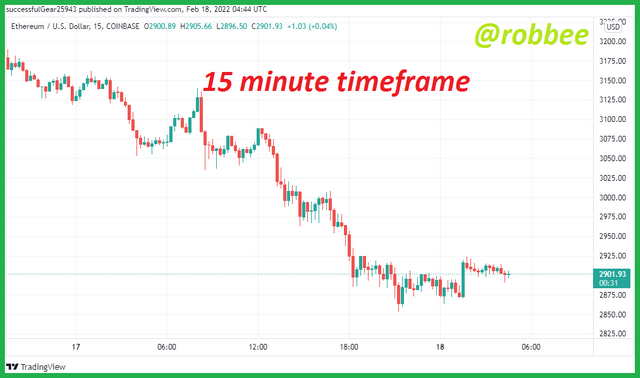
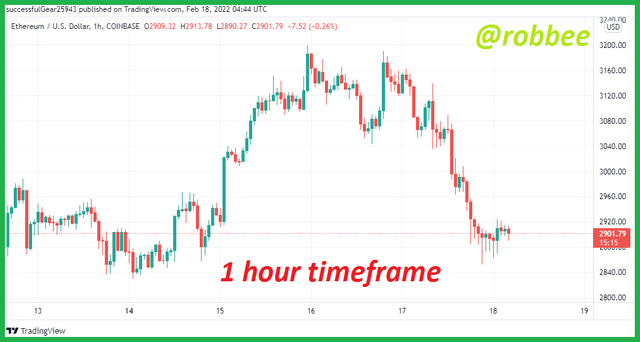
In the two pictures above I use two different timeframes, the first image uses a timeframe … and the second image I use a timeframe …, from the two images we can see that the two timeframes have different graphics. Many professional traders have used Multi-timeframe analysis as a good analytical strategy. These professional traders usually use a larger timeframe to see the direction of the chart or place support and resistance areas, then traders will use a smaller timeframe to place tighter entries, take profits and stop losses.
As explained earlier, Multi-timeframe analysis can filter out market noise. For more details, I will explain through the image below.
In the picture above I use a 15-minute timeframe, when this happens in the market we know that the chart has hesitancy to go up or down which makes us traders confused to take action to buy or sell entry because we don't know which direction the chart will go up or down. Then we can look at the chart on another timeframe to see if the chart will continue its bearish trend or the trend will turn bullish. Then I tried to change the timeframe to 2 hours to see the actual direction of the graph.
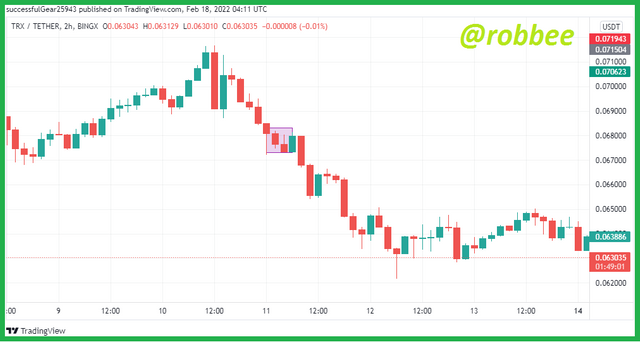
After changing the chart to a 2-hour timeframe, we can conclude that the actual chart will remain bearish, therefore we have removed the noise from the chart on the 15-minute timeframe and we now know what direction the chart will take next.
5.) With the aid of a crypto chart, explain how we can get a better entry position and tight stop loss using multi-timeframe analysis. You can use any timeframe of your choice.
To get a better entry and stop-loss using the Multi-timeframe analysis strategy is to use a higher timeframe first and then lower the timeframe so that we get a better entry and stop-loss from a high timeframe. For more details, I will explain using an image.
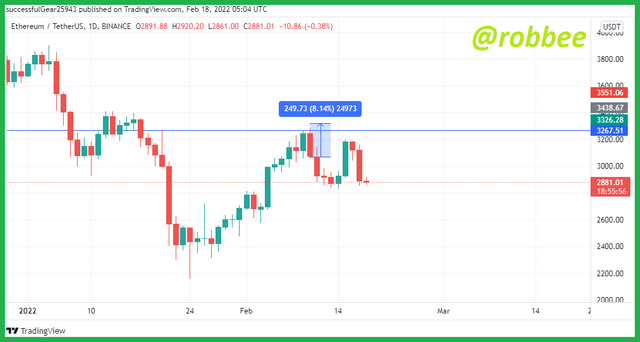
As you can see in the image above, I use the ETHUSDT coin on the tradingview platform. In the picture above I use a 1-day timeframe. In the 1-day timeframe as in the picture above, we can see that the price chart is bouncing off the resistance area, which means the chart will be bearish, because of that we can assume an initial entry into the market as shown in the picture and place a stop loss above the resistance area as in the example above. . In the picture above, it is 249.73 points and 8.14% of the initial entry assumption.
To get a better entry and other tighter stop losses, we can lower the timeframe as we wish, for more details, see the image below.
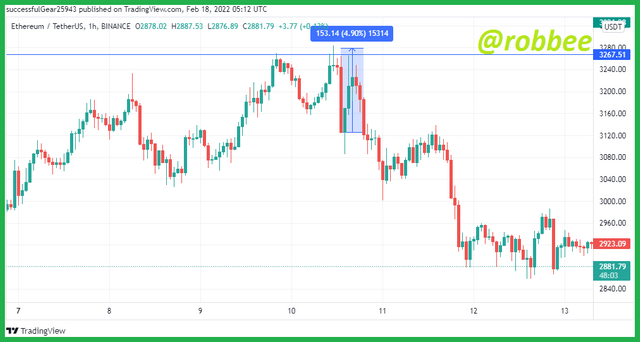
In the picture above I changed the timeframe from 1 day to 1 hour with the same coin, we get a better entry than before and also get a tighter stop loss. We can see when my 1-day timeframe has a stop loss of 249.73 points, then after I change the timeframe to 1 hour I have a stop loss of 153.14 points which is tighter than the 1-day timeframe. Apart from getting a better entry, on the 1-hour timeframe, we can see a double top pattern, which means a bearish signal that occurs because the chart bounces off the resistance area is a correct signal.
If you want to get a better entry and a tighter stop loss then we have to use a timeframe smaller than 1 hour, for example, it can be seen in the image below.
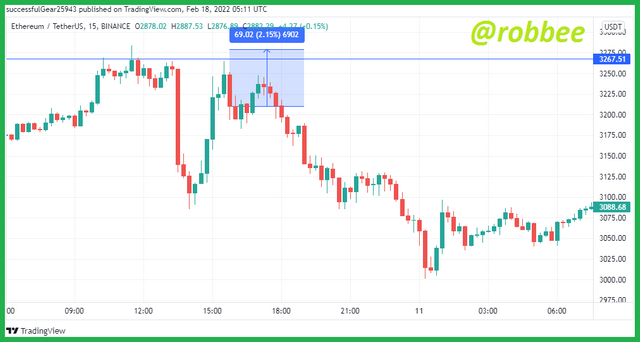
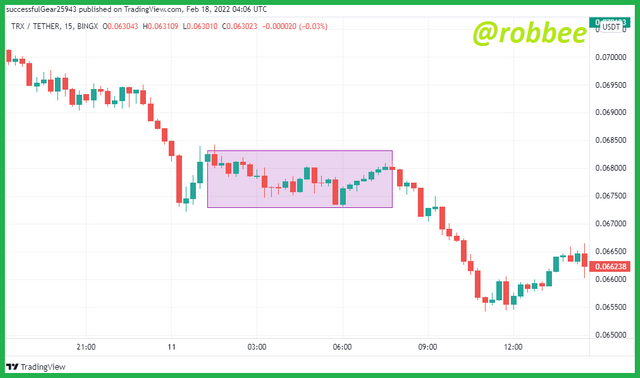
As can be seen in the image above, I am still using the same coin, namely ETHUSDT with a 15-minute timeframe. After shrinking the timeframe to less than 1 hour, we can see that I got a better entry and also got a tighter stop loss. The initial stop loss on the 1-hour timeframe has 153.14 points while the 15-minute timeframe has a stop loss of 69.02 points which is tighter than the stop loss on the 1-hour timeframe. Apart from this, the double top is still forming in the 15-minute timeframe. That way it proves that Multi-timeframe analysis is a good analytical strategy to use in the market to get better entries and tighter stop losses.
6.) Carry out a multi-timeframe analysis on any crypto pair identifying support and resistance levels. Execute a buy or sell order using any demo account. (Explain your entry and exit strategies. Also, show proof of transaction).
To solve this question, I use a trading platform that uses my country's currency as the exchange rate, namely indodax. Here I use CARDANO MARKET or ADA/IDR coins to analyze and buy coins. For more details, see the image below.
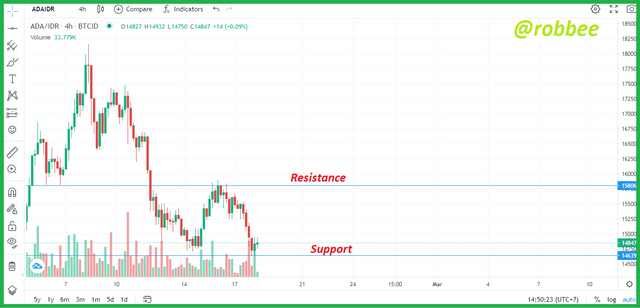
The picture above is an image of the ADA/IDR coin price chart in a 4-hour timeframe. In the 4 hour timeframe as you can see in the picture above, I put the support and resistance areas, then the chart bounces on the support area which means the chart will go up again, then I shrink the timeframe to get a good entry and other signals, I reduce the timeframe to 1 hour. The 1-hour timeframe can be seen in the image below.
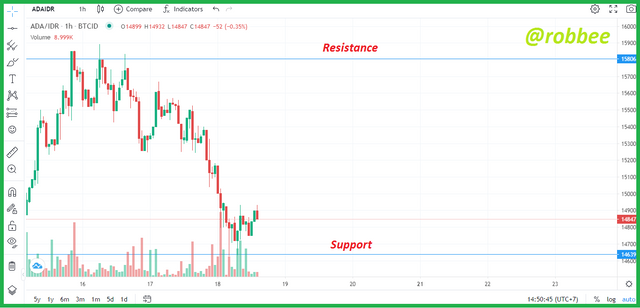
In the 1 hour timeframe as seen in the picture above, it can be seen that there is a candle rejection that gives a signal of a trend reversal, which was originally a bearish trend and will turn into a bullish trend. Due to the presence of two signals for a trend reversal to become bullish, I tried to reduce the timeframe back to 15 minutes. To view, it can be seen in the image below.
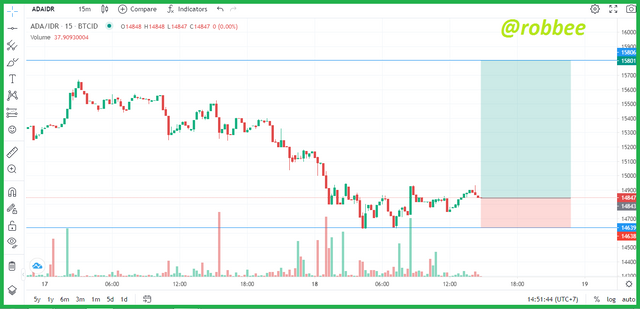
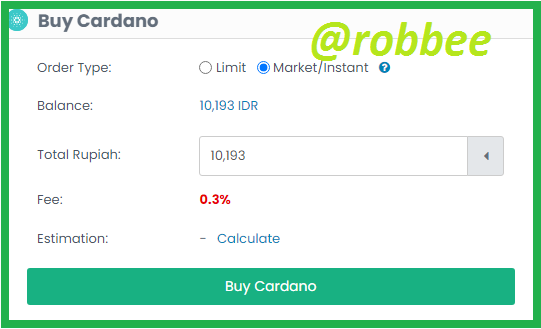
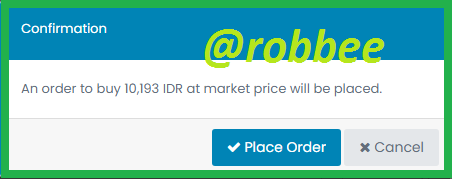
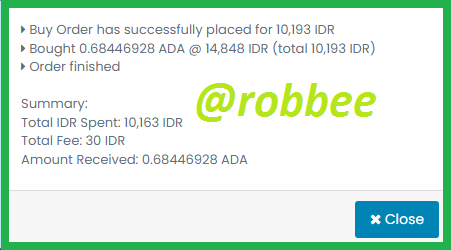
After I reduced the timeframe to 15 minutes, I found another trend reversal signal, namely a double bottom pattern. With the three signals I got, I decided to enter the market. I have already entered the market, but due to three strong signals of a trend reversal, I immediately entered at the price of 14,843 IDR or 1.04 USD. Then I put a take profit at the price of 15.801 IDR or 1.10 USD which is in the resistance area and put a stop loss at the price of 14.638 IDR or 1.02 USD which coincides with the support area.
Conclusion.
Price action is one of the technical analyses. A price action analysis is carried out by traders to find patterns in price movements that we see so random, these patterns are obtained based on price movements that have occurred before. Price action is one of the analytical techniques that can be used just by looking at the price chart alone can make us know the next price movement.
The science of price action is very necessary for the market, several reasons that make price action a very important science in the market are with price action we can understand the market structure, we can also know the reflection of emotions and market psychology, besides that we can also filter noise and false signals in the market, and others.
Many technical analysis strategies use this price action, one of the most basic techniques of this price action is the technique of reading candlestick charts. As in my initial explanation, we can find out the next price movement just by looking at the price chart. For example, when an impulsive candle occurs in the market, it indicates the chart will continue its trend, while if the candle rejection occurs, it indicates a trend reversal will occur, but what must be remembered is that the candlestick reading must be combined with other price action techniques such as multi-timeframe analysis techniques and others. This multi-timeframe technique is a price action technique used to filter market noise. With the many advantages of price action analysis, making price action analysis guarantees an important analysis used in the market.
References:
https://www.tradingview.com/chart/ITAaNOcQ/
https://indodax.com/en/