Hello steemian ...
This is my new post in the Steemit Crypto Academy community, on this season 6 week 4, I will be working on a homework from professor @pelon53 with the theme "Fibonacci Tools”.

we will discuss it through the homework below:

1.- Explain in your own words what you mean by Fibonacci retracement. Show an example with screenshot.
The Fibonacci retracements were coined by an Italian mathematician named Leonardo Fibonacci. Fibonacci retracement is based on the theory of the Fibonacci series which is formed on a pattern from a sequence of numbers from small to large which is obtained from adding up the two previous numbers, Example:
- 0.1,1,2,3,5,8,13,21,34,….and so on, the translation of the formula:
0.1,(0+1),(1+1),(1+2),(2+3),(3+5),(5+8),(8+13),(13+21 ),…
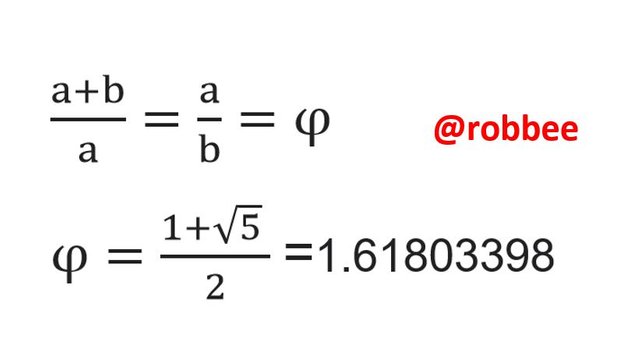
Not only that but the Fibonacci retracement is also based on the golden ratio, which is an irrational number that has a relationship between two numbers, for example, the relationship between the ratio of small values to large values is similar to the ratio between large values to small values. The irrational number is 1.61803398, which is obtained from the equation:
That is, the Fibonacci retracement is a collaboration between the Fibonacci sequence and the value of the golden ratio that is implemented so perfectly that it makes it a very useful trading analysis tool.
Based on the explanation of the basic Fibonacci retracement, we can conclude that the Fibonacci retracement is a trading analysis tool based on the collaboration between the Fibonacci series and the value of the golden ratio. In its application in today's modern world, Fibonacci retracements are used by traders to read the harmony of support and resistance points that are happening in the market.
The support and resistance points are based on the Fibonacci ratio number, where naturally the number 0.382 – 0.618 is the range for the chart to resist direction. If it is in a bullish trend, the range is interpreted as a support point. whereas if in a bearish trend the range is interpreted as a resistance point.

2.- Explain in your own words what you mean by Fibonacci extension. Show an example with screenshot.
Fibonacci extensions or it can also be said Fibonacci ratios in the trading world, especially in terms of price movement analysis, Fibonacci extensions are very helpful in determining when to sell and buy at the right time.
When using the Fibonacci retracement, we will get information about the possibilities that occur afterward, whether the trend will continue or reverse into the opposite trend. The display displayed by Fibonacci depends on the value of the Fibonacci ratio, namely 61.8%, 100%, 138.2%, 161.8%, 238.2%, 261.8% and 423.6% % (numbers as a percentage of the ratio). Fibonacci are 0.236, 0.382, 0.618, 1.618, 2.618, and 4.236).
In Elliot wave theory, the Fibonacci extension is the most important concept. Elliot wave theory, which explains the market movement through 5 waves, turns out to save the value of the golden ratio. This happens in wave 3, usually, the value of wave 3 has a ratio of 1.618, 2.618, or 4.236.

3.- Carry out the calculation of the Fibonacci retracement, for the levels of: 0.618 and 0.236. Pick a crypto pair of your choice. Show a screenshot and explain the calculation you made.
As we already know and also based on the lessons given by the professor that the formula of the Fibonacci retracement
R1 = X + [(1 - % Retrace1/100) * (Y – X)]
Where :
X = The initial value of the price where the Fibonacci Retracement begins.
Y = The maximum value of the price at which the Fibonacci Retracement ends.
So, in this assignment, I will explain an example of a calculation using the MANA/USC pair. Based on the MANA/USC price movement, then:
X = 2.2862 USC
Y = 2.5426 USC
ASKED:
0.618 = R4
0.236 = R1
- CALCULATION OF LEVEL 0.618 (R4)
So :
R4 = X + [(1 - % Retrace4/100) * (Y – X)]
= 2.2862 + [(1 -0.618) * (2.5426 – 2.2862 )]
= 2.2862 + [(0.382) * (0.2564)]
= 2.2862 + 0.097945
R4 = 2.3841 USC
So, the calculated value for the 0.618 Fibonacci retracement level is 2.3841 USC.
- CALCULATION OF LEVEL 0.236 (R1)
So:
R1 = X + [(1 - % Retrace4/100) * (Y – X)]
= 2.2862 + [(1 -0.236) * (2.5426 – 2.2862 )]
= 2.2862 + [(0.764) * (0.2564)]
= 2.2862 + 0.19589
R1 = 2.4821 USC
So, the calculated value for the 0.236 Fibonacci retracement level is 2.4821 USC.

4.- On a Live account, trade using the Fibonacci retracement, screenshots are required.
For this trading, I will do it on the Upbit trading platform:


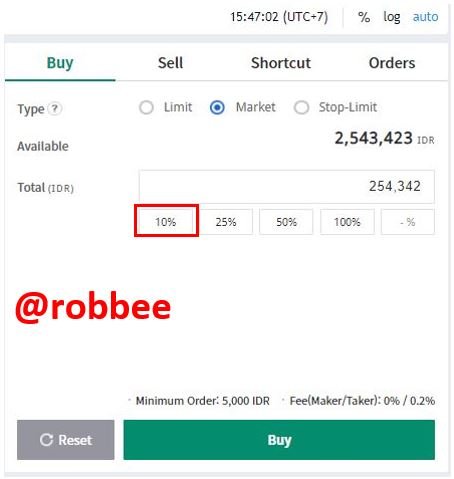
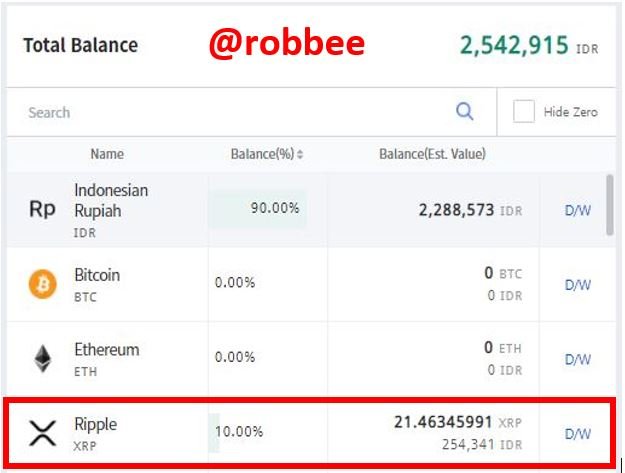
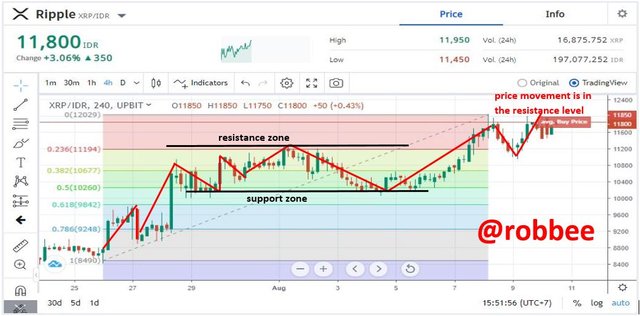
I will Trading in Ripple asset (XRP), I bought it at the price of 11850 IDR. And bought as much as 10% of my total wallet, which is 254341 IDR (17.68 USD), then I got 21.46 XRP. The condition of the price movement is in the resistance level, the possible level that occurs is a continuing uptrend or the occurrence of price resistance that creates a support level.

5.- On a Demo account, make a trade operation using the Fibonacci extension. Screenshots are required.
At this stage, it's a shame to do it again on Upbit platforms. Demo trading operations using the Fibonacci extension will be performed on ONBUFF assets (ONIT/IDR). I purchased for 1,880 IDR (0.13 USD).
On the buy, you can see that the asset is in a downtrend. It can be seen that previously the strongest support point was at 0.5. but then price the price decreased again so now it can be seen that the point 0.5 which was previously the strongest support point has now become a strong resistance point.
Therefore, in this purchase, we saw that the price touched the 0 Fibonacci lines, and then the price rose again. Therefore, we can analyze that if the next price reversal occurs, it will be more directed to the 0.236 points and if the price continues to rise and penetrates the 0.5 points again, it will be identified as a strong trend.

Conclusion
Fibonacci Tools is a trading analysis tool based on the collaboration between the Fibonacci sequence and the value of the golden ratio. In its application in today's modern world, Fibonacci retracements are used by traders to read the harmony of support and resistance points that are happening in the market.
For some people, the Fibonacci ratio is just a coincidence. But most traders in the trading world use it as an analysis of price movements. Fibonacci numbers and ratios are very helpful in determining when it's time to sell and buy at the right time so that you get a bigger profit.


