Hello steemian ...
This is my new post in the Steemit Crypto Academy community, on this season 5 week 2, I will be working on a homework from professor @utsavsaxena11 with the theme "Head and Shoulders and Inverted Head and Shoulders Pattern”.

we will discuss it through the homework below:

- Explain Head and Shoulder and Inverse Head and Shoulders patterns in details with the help of real examples. What is the importance of volume in these patterns(Screenshot needed and try to explain in details)
Head and Shoulder
The head and shoulder pattern is one of the very good patterns to use in analyzing the market. This head and shoulder pattern forms like a head and two are the name of the pattern. This pattern is a reversal (reversal) which, when formed indicates that the price will go against the current trend. Preformed. This pattern resembles a baseline with 3 apex ends, two of which are closest and the middle one is the highest.
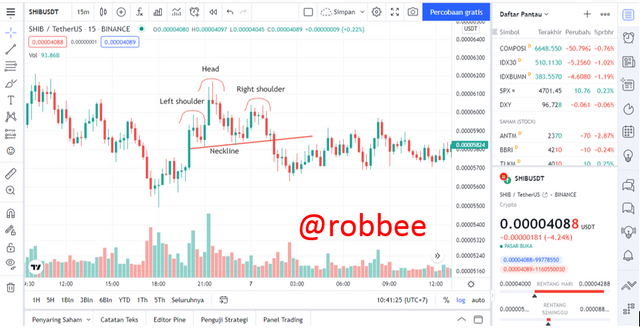
This pattern occurs when the market is forming an uptrend which will indicate a possible change in direction from a bullish trend to a bearish trend.
This pattern has 3 valid components to follow:
-Left shoulder: when the price forms the latest high then the price corrects to the latest low.
-Head: then the price rose again to form the latest high from the previous and corrected again.
-Right shoulder: after correction the price went up again, but did not form the latest high point, but only to the first highest level (on the left shoulder), then dropped back down.
Inverse Head and Shoulders
The Inverse Head And Shoulders pattern is not much different from the Head And Shoulders, only in a different direction, this pattern is also the best pattern in technical analysis. This pattern begins with the formation of the left shoulder, when the price drops to a low level then rebounds to a higher level,then the price formed at a new low level which indicates that the price has formed a head and the price is rising again, in the third step the formation of the right shoulder the price fell again, but did not break the previous low and then the price went back up to the neckline line. This pattern indicates a trend reversal from bearish to bullish trend.
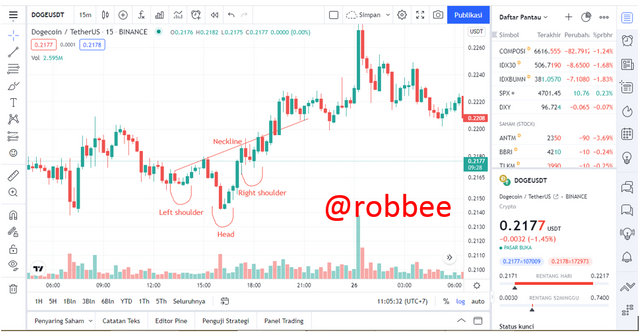
This pattern has 3 valid components to follow:
-Left shoulder: when the price forms the latest low, then the price corrects to the latest high.
-Head: then the price fell again to form the latest low from the previous one and corrected again.
-Right shoulder: after correction the price went back down, but did not form the latest low, but only to the first low (on the left shoulder), then rose through the neckline then this pattern is valid.
The larger the volume of formation, it indicates market movement activity. When the neckline breaks, this moment is very important, followed by large volume movements, such a large volume can give traders an idea that the market is making large-scale transactions.

2.) What is the psychology of market in Head and Shoulder pattern and in Inverse Head and Shoulder pattern (Screenshot needed)
Head and Shoulder
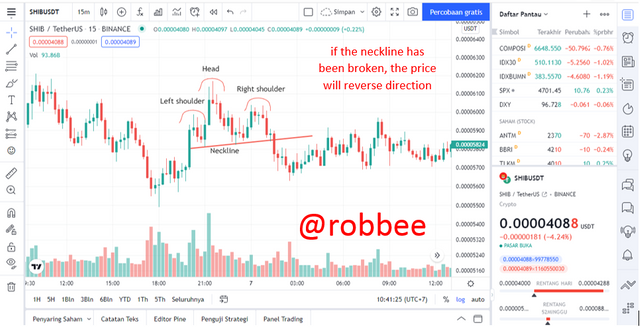
The head and shoulder pattern aims to reverse the trend direction from bullish to bearish. To use the Head And Shoulders pattern on the market, start by looking at the candlestick chart that matches the Head And Shoulders concept, namely the left shoulder, head and right shoulder, and don't forget to draw a neckline as a sign of reversal.
In the formation of the Head And Shoulders pattern, there are three steps observed in the market, the first step in the formation of this pattern is on the left shoulder, which is formed when the price forms a new high and corrects it to the latest low, the second step is the formation of a price head which forms the latest high.Or break through the previous high and then correct to the lowest level adjacent to the lowest level on the left shoulder, the third step is the formation of the formation of the right shoulder, the price moves up but is unable to penetrate the previous high, then followed by a decrease in price that reaches the lowest level on the left shoulder. This pattern will be valid if the price manages to cross the neckline.
Inverse Head and Shoulder
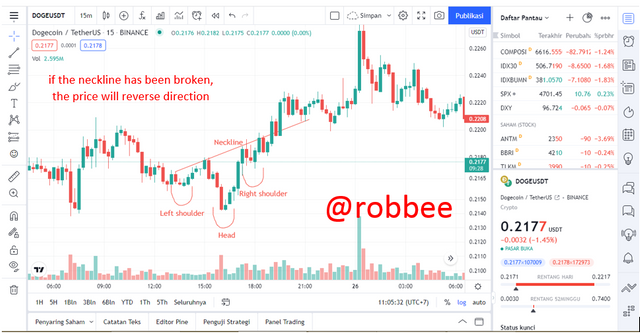
The inverse head and shoulder pattern aims to reverse the trend direction from bearish to bullish. The formation of the pattern is the same as the Head And Shoulders but the formation is the opposite. It begins with the formation of the left shoulder when the price drops to the latest low and then corrects to the latest high, then forms.Head formation, the price fell back down and formed the latest low and then rebounded to the highest level adjacent to the left shoulder, the last one was the formation of the right shoulder, when the price that had gone up, then fell back down to a low level adjacent to the left shoulder, because it was unable to broke the previous low and the price corrected to a higher level.When the price reached the neckline line and broke it at that point traders were able to take positions to enter.

3.)Explain 1 demo trade for Head and Shoulder and 1 demo trade for Inverse Head and shoulder pattern. Explain proper trading strategy in both patterns seperately. Explain how you identified different levels in the trades in each pattern(Screenshot needed and you can use previous price charts in this question)
In this question, I will give an overview of trading simulations using the Head And Shoulders pattern and the inverse Head And Shoulders pattern.
Explanation of Demo Simulation Trade for Head and Shoulder Pattern
In the Head And Shoulders pattern, the price must be in an uptrend. The formation of this pattern is at the highest level of the bullish trend. After choosing the market and looking at the candlestick chart.
The first thing to do is to look at the formation of a candlestick that resembles a head and shoulder formation, namely there is a left shoulder, head, and right shoulders. If the candlestick chart has formed a head and shoulder formation, then the market is already valid to use the Head And Shoulders pattern.
When the Head And Shoulders pattern has formed on the market candlestick chart, then draw the neckline using the trendline that connects the ends of the lowest levels of the left shoulders, head, and right shoulders. To determine a safe entry point, when the candlestick has broken through the neckline, the previous one the market is forming a bullish trend, when the candlestick breaks the neckline, the trend is reversing to become a bearish trend.

Entry
In the SHIB/USDT market I saw the formation of a head and shoulder pattern on the 15 M timeframe, then I drew the neckline between the left shoulder and the right shoulder, which is useful as a marker of price breakouts and to confirm the formation of the pattern, and I set the entry point at $0.000005840
Stop Loss
Setting a stop loss is very necessary so as not to experience a big loss. I set the stop loss at the top of the right shoulder, according to what is recommended in the use of the head and shoulder pattern.
Take Profit
I determine my profit target by measuring the length between the top of the head and the correction candle on the right shoulder or left shoulderWhich I show in the graph above.
Explanation of Demo Simulation Trade for Inverse Head and Shoulder Pattern
The inverse Head And Shoulders pattern is the same as the Head And Shoulders, only in a different direction. The target market must be in a bearish trend. The thing to do when using this pattern is the low point of the left shoulders and the low point of the right shoulders not exceeding the low point of the head.
When the candlestick chart has formed the following form, then draws the neckline at the end of the high level to combine it. To enter the market a candlestick must break the neckline line, so traders can take positions on the next candle. This pattern indicates a change in the direction of the trend from bearish to bullish.
Entry
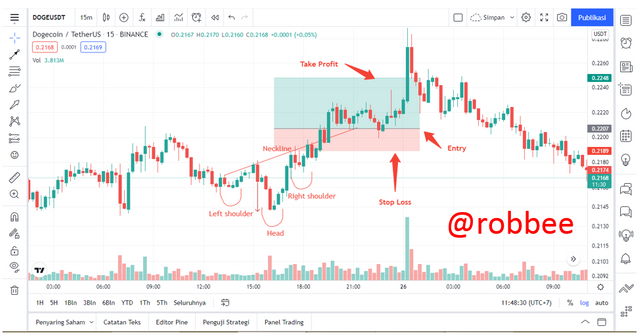
I use the DOGE/USDT market, which has formed an inverse Head And Shoulders on the 15 M timeframe. My entry point is at $0.2207 when there is a neckline breakout.
Stop Loss
I place the stop loss at the low level of the right shoulders. That point is a downward sign, if the price touches the low point of the right shoulders, the pattern is invalid.
Take Profit
Just like in the Head And Shoulders in the inverse head and shoulder pattern, I determine my profit target by measuring the distance between the tip of the head and the correction candle on the left shoulder. But the profit target point can be placed according to the trader's wishes.

4.)Place 1 real trade for Head and Shoulder(atleast $10) OR 1 trade for Inverse Head and Shoulder pattern(atleast $10) in your verified exchange account. Explain proper trading strategy and provide screenshots of price chart at the entry and at the end of trade also provide screenshot of trade details.(Screenshot needed.)
In the following I will trade directly using the head and shoulder pattern on the market.
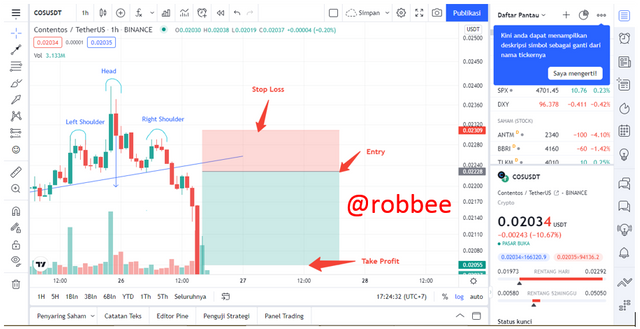
The market I use is COS/USDT on the 1 H timeframe. In this market I saw that the Head And Shoulders pattern was forming, then I pulled the neckline to determine my entry point after the neckline was broken.
I saw that there had been a break of the neckline and it was indicated by a reversal candle, so I placed my entry point at $0.02246 and my stop loss at $0.02309 which was located at the highest level of the right shoulders, my target was placed at the price $0.02054,my profit target is the result of the difference in the distance between the highest level of the head and the correction candle on the left shoulder which is measured with the help of the line.
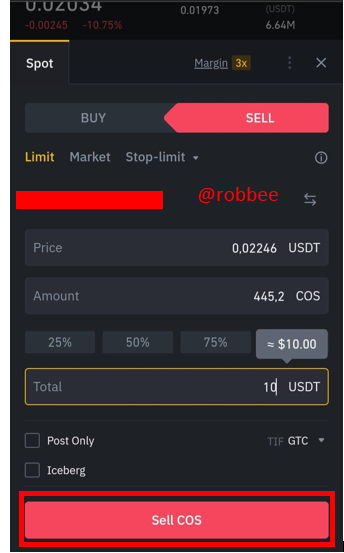
After I determine the entry, stop loss, and take profit points on the chart, then I enter my Binance account to place an order on the market. I sell on the COS/USDT market. The price of the order I take follows the current market price, which is $. 0.02246.
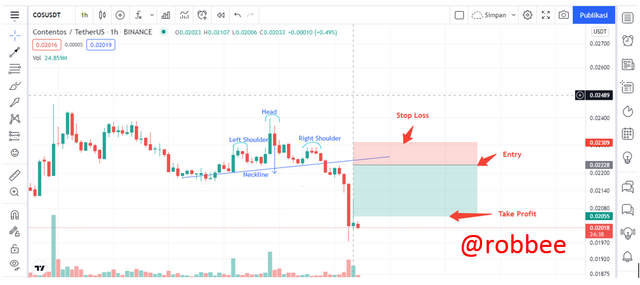
The trade that I took after I made the entry turned out to have touched the profit target that I had set. The price moved according to the prediction I had made. Here's a screenshot of the graph

Conclusion
The Head And Shoulders and inverse head and shoulder patterns are very trusted patterns to be used in technical analysis on the crypto market. The drawback of this pattern lies in the formation of the pattern formation which takes a little time before forming a head and shoulder formation.
The advantages of this pattern can be found in any timeframe. This pattern will form a Head And Shoulders or inverse Head And Shoulders formed when the three parameters have formed a left shoulder, head, and right shoulder formation. For a point marker to enter this pattern when the neckline line has been penetrated by the candle.