Hello steemian ...
This is my new post in the Steemit Crypto Academy community, on this season 4 week 8, I will be working on a homework from professor @reddileep with the theme "How to Trade Cryptocurrencies Profitably Using TD Sequential”.

we will discuss it through the homework below:

1). Define the Sequential TD Indicator in your own words.
The TD Sequential indicator is an indicator created by Tom DeMark, he is a successful trader and later dedicated himself to developing and advancing trading. He has benefited many other traders especially in the indicators he created.
The TD Sequential indicator is an indicator that serves to provide information about when a market reversal occurs and when a correction occurs by utilizing 3 elements, namely the countdown which will later appear on the chart display. Then the price element flips as a potential reversal signal. And next is the signal filter element which functions to identify when a correction or temporary price change occurs and also identifies when a long-term reversal or price change occurs and also changes the direction of the trend.

2). Explain the Psychology behind TD Sequential. (Screenshots required)
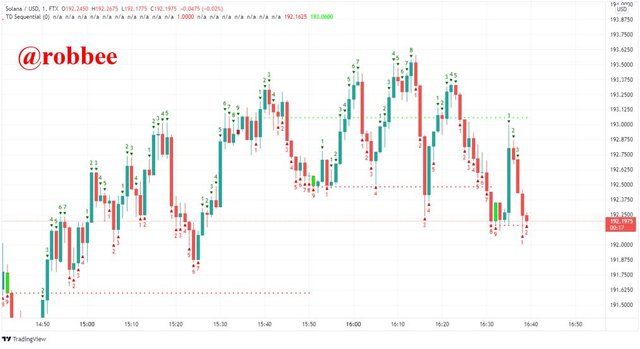
If we talk about the psychology behind sequential TD, then it will be about TD setting and TD Countdown. For setting TD, we can explain how to set TD to buy and how to set TD to sell. To buy, you can tell that it starts with the first 4 candlesticks must be in a bullish state while the next 9 candlesticks are price resistance or in a bearish state. 9 candlesticks in a bearish state must have a shorter length than the previous 4 bearish candles which means the closing price for these 9 candles must be lower. You can make a buy entry when you see that the 8th or 9th initial candle is shorter than the previous candle and after that candle 1 appears which indicates a reversal.
As for selling, you can see that it starts with the first 4 candlesticks must be in a bearish state while the next 9 candlesticks are price resistance or in a bullish state. 9 candlesticks in a bullish state must have a higher length than the previous 4 bearish candles which means the closing price for these 9 candles must be higher. You can sell or take profit when you see that the initial 9th candle is shorter than the previous candle and after that appears candle 1 which indicates a reversal. for the TD countdown this depends on how the TD rules are, then the next will be able to produce equality.

3). Explain TD Setup during bullish and bearish markets. (Screenshots required)
TD settings, namely buy and sell settings are based on 9 candlesticks, the following is an explanation:
TD settings during bullish market
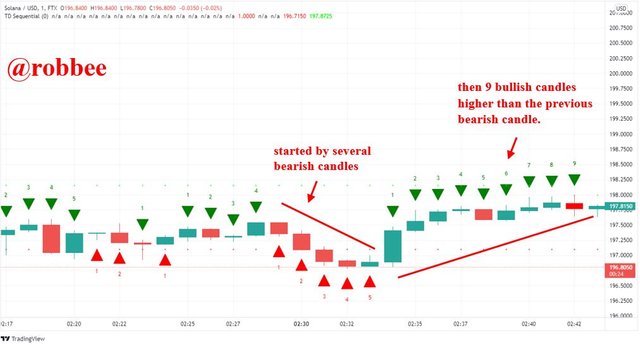
The TD setting in the bear market refers to 9 candlesticks that are higher than the previous 4 candlesticks, meaning we are referring to 13 candlesticks. The first 4 candlesticks must be bearish while the next 9 candlesticks are price resistance or in a bullish state. 9 candle stock in a bullish state must have a higher length than the previous 4 bearish candles which means the closing price for these 9 candles must be higher. However, to find perfection on 13 candlesticks is quite difficult because it is very rare to find such occurrences.
As the example, I took on the Solana/USD asset, in this case, the setting I made was to make sure that before the occurrence of 9 candlesticks in a bullish state, starting with a bearish candlestick that was lower than 9 bullish candlesticks, that is the TD rule during a bull market.
TD settings during bearish market
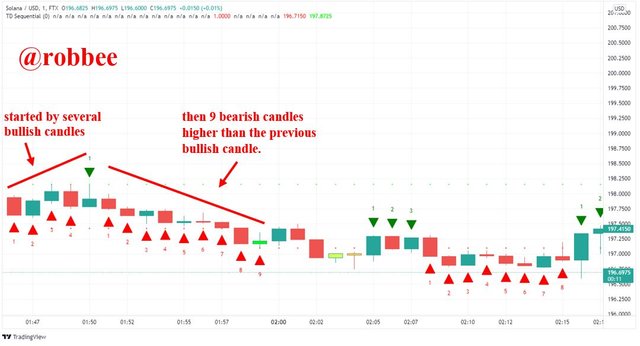
Setting TD in a bear market is easier to understand that it is the opposite of setting TD during a bull market. which refers to 9 candlesticks that are lower than the previous 4 candlesticks, meaning we are referring to 13 candlesticks. The first 4 candlesticks must be bullish while the next 9 candlesticks are price resistance or bearish conditions. 9 candlesticks in a bearish state must have a lower length than the previous 4 bullish candles which means the closing price for these 9 candles must be lower. However, to find perfection on 13 candlesticks is quite difficult because it is very rare to find such occurrences.
As the example, I took on the Solana/USD asset, in this case, the setting I made was to make sure that before the occurrence of 9 candlesticks in a bearish condition, starting with a bullish candlestick that was lower than 9 bearish candlesticks, that is the TD rule during a bear market.

4). Explain graphically how to identify trend reversal using the Sequential TD Indicator in the chart. (Screenshots required)
identify a trend reversal using the Sequential TD Indicator in the chart during a bull market is the last candle of the close before the reversal occurs, it must have a shorter candle length than the previous candle. In the example I took, it appears that the closing candle, namely candle 5, has a candle body that is shorter than the previous four candles, this indicates a price reversal will occur. At that time you can place an order for an entry buy at a price below it because it is indicated to go down.
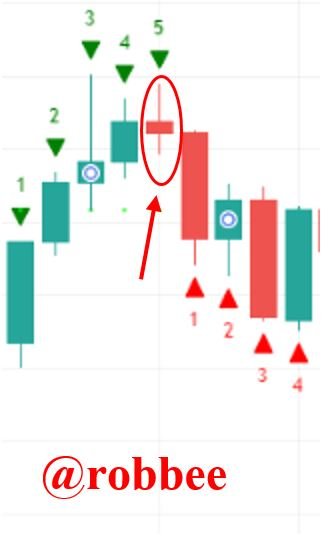
A short candle indicates that price pressure is starting to occur and it is an indication that a price change will occur. If you are in a bullish state, then you have to place a buy order because the price will go down and you will make a profit. Meanwhile, if it is bearish, you have to place a sell order because the price will go up and you will make a profit.

5). Using the knowledge gained from the previous lessons, perform a better Technical Analysis by combining the Sequential TD Indicator and making an actual coin purchase at the point where the TD 9 or 8 count occurs. Then sell it before the next resistance line. (You must indicate all relevant details including entry points, exit points, resistance lines, support lines, or other trading patterns such as Double bottom, Falling wedge, and Inverse Head and Shoulders patterns.)
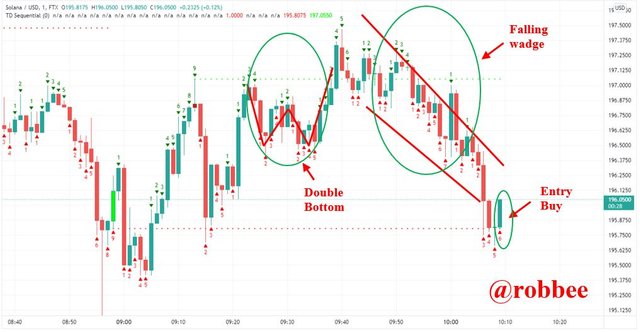
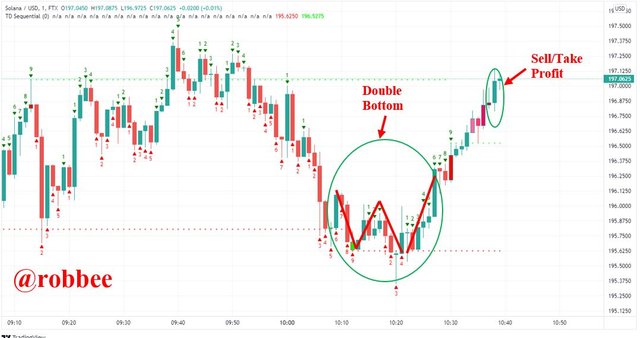
In this question, I will technically analyze the Solana/USD coin. It can be seen that before making a purchase, I found several patterns such as a double bottom which means the chart is trying to change the direction of the trend. Shortly after that, the trend went up, but soon after it fell slowly and formed a falling wedge pattern which at first indicated that the strength between sellers and buyers was equally strong. but in the end, the seller made a stronger resistance so the price fell and the falling wadge pattern was formed.
Currently, there is a downtrend and this is the right time to buy at the price of 196 USD, I also only bought 1 Solana.
I also traded for 30 minutes, then saw that the price soared to the price of 197 USD, with a profit of 0.51%. The price increase was initiated by a double bottom, which means the chart is trying to change the direction of the trend.

Conclusion
TD Sequential is a very useful indicator and has great benefits for traders. In addition, sequential indicators have very good accuracy, but this indicator has more difficulties than other indicators. This indicator is not suitable for beginners and sometimes it takes a lot of experience to use this indicator properly and accurately.

Reference
https://hackernoon.com/how-to-buy-sell-cryptocurrency-with-number-indicator-td-sequential-5af46f0ebce1
http://178.248.238.82/blog/for-professionals/alat-analisis-teknis-oleh-tom-demark-td-sequential/
https://www.tradingview.com/

