Hello steemian ...
This is my new post in the Steemit Crypto Academy community, on this season 6 week 1, I will be working on a homework from professor @reddileep with the theme "Leverage With Derivatives Trading Using 5 Min Chart”.

we will discuss it through the homework below:

1). Introduce Leverage Trading in your own words.
Leverage is the use of borrowed funds provided by a broker with a function to increase the profit or profit of traders who will trade. Leverage can help traders who don't have a lot of capital but still want to get big profits. Leverage is also defined as leverage, which means the more you use a loan, the greater your profit will be, but it will also impact your losses.
Leverage has several common proportions that are often used by most traders, namely the proportions of 1:25, 1:50, 1:100, 1:200, 1:400, and 1:1000. In addition, you can adjust the proportion of leverage according to your wishes, but you should not use leverage with a nominal that is not round like 1:333, 1:542, and so on.
Types of leverage
1). margin leverage
Margin leverage means that the margin will be smaller if the leverage is getting bigger. An example of the calculation is:
Margin leverage = Leverage x Transaction Value.
An example of such a case is if you use 1:100 leverage for a cryptocurrency transaction for 100 USD (eg 21,367 SAND = 100 USD). That means you only need a margin of 1 USD (0.21367 SAND) and also the actual capital you have is 1% or equal to 1 USD, which is 0.21367 SAND.
2). Real leverage
Real leverage is the total transaction value that you have divided by the amount of capital you have. An example of the calculation is:
Real leverage = total transaction value: total capital owned
An example of this is if you have a capital of 100 USD. Next you open to make a purchase (eg 213.67 SAND = 1000 USD). That means your real leverage is 10x greater than the capital you have.

2). What are the benefits of Leverage Trading?
Leverage opens opportunities for traders who have little capital to get maximum profit. With a small amount of capital, they only need to manage good leverage and can start trading immediately to make a profit. At first, trading could only be done by wealthy people because they had sufficient capital. After leverage appears, now anyone can trade even if you don't have a lot of money.
Huge profit potential, because if traders are given sufficient loan funds, they will have many opportunities to open a large number of positions. So that if traders have the opportunity to open many positions, the greater their potential to achieve large profits.
Interest-free leverage is enough to help traders. This removes the worries of the traders after making a loan from the broker. This makes traders more comfortable in trading without disturbing their psychology due to high-interest bills.
Leveraged trading is very helpful for traders with fast trading styles, for example, scalpers. The scalpers will get more profits because even if they get out of the market quickly, of course, their profits will also increase.

3). What are the disadvantages of Leverage Trading?
Leveraged trading exposes traders to a greater risk of loss. Of course, the greater the capital, the greater the risk of loss. If traders have large leverage, then it will make them experience larger losses than expected if wrong in doing calculations. For safety, it is highly recommended that traders place a stop loss (SL) on each of their trades.
Leveraged trading can lead to over-trading risk. Over-trading can affect the psychology of traders in making decisions about their trades. Over-trading traders usually find it easy to open trading positions regardless of their fund management and trading risk management. Leverage causes these traders to think that they have a lot of funds when in reality it is just leverage and not their real money. To anticipate the risk of over-trading, traders should limit their leverage and use only 1:100 or 1:200 leverage.
In leverage trading, there is a margin call, which is a certain limit provided by the broker in the balance of the traders. If a trader incurs a loss causing his balance to drop past the margin call limit, then the broker can forcibly close that trader's portfolio even in its entirety even if the trade is in profit. this of course has a bad impact on every trader.
The risk of not being exposed to margin calls can be prevented by implementing good management when trading. We recommend that each position that is opened only uses capital below 10% so that the rest can be an alternative to anticipate losses.

4). What are the Basic Indicators that we can use for Leverage Trading? (Need brief details for any essential Indicators and their purposes)
For basic indicators, I tend to like some indicators in this trade. Those are Bollinger Bands, MACD, and EMA (Exponential Moving Average).
- Bollinger Bands
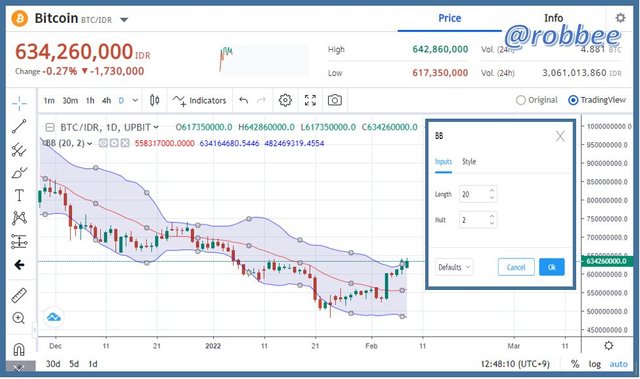
Bollinger bands are indicators that can be used to know the level of market volatility so that it can be seen that the asset is in oversold or overbought conditions. In this setting, it is recommended to use 2 standard deviations based on the 20-day moving average. This setting will later make the distance between the Upper and lower bands further apart so that it shows a very clear trend, so it will be very easy to draw to identify it.
- MACD
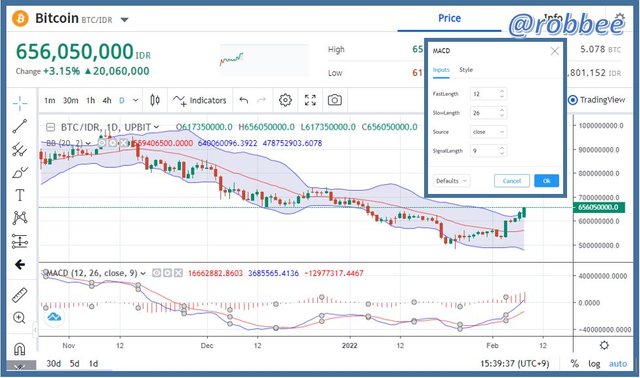
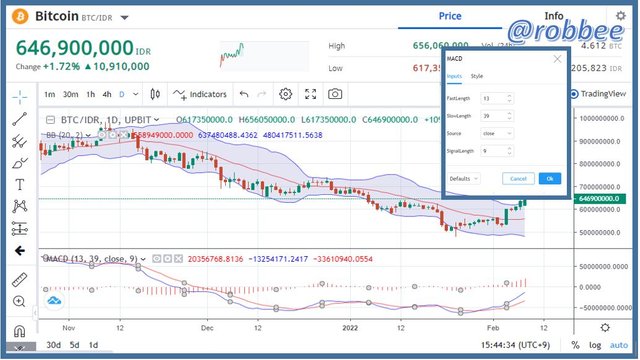
MACD is an indicator that can be used to know the market conditions of an asset-based on the direction of the trend and its momentum. So that we will get very clear information about when is the best time to enter and get the best information about the best time to buy and sell. In making entries, traders should use a fast MACD with settings (12, 26, 9) marked with a zero line cross. Then to exit, traders should use the slow MACD with the settings (13, 39, 9) marked by the crossing of the signal lines.
- EMA (Exponential Moving Average)
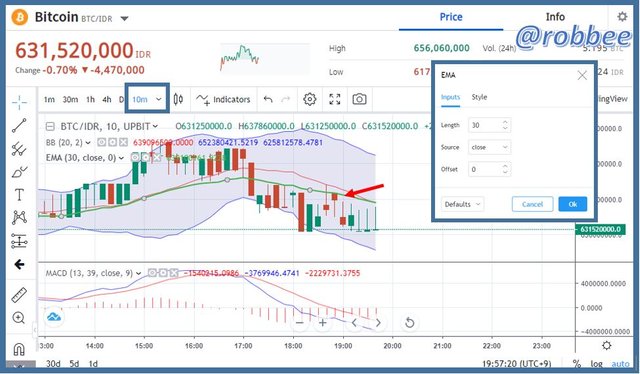
The EMA is an indicator that can be used to signal a trend signal. Unlike the moving average (MA) line on the Bollinger band indicator and also different from the SMA (Simple Moving Average) indicator, the EMA indicator has a reaction speed and sensitivity that is better to price movements because EMA uses an exponential calculation formula. For the settings, set the EMA to EMA30 with a timeframe of 10 minutes.

5). How to perform Leverage Trading using special trading strategies (Trading Practice using relevant indicators and strategies, Screenshots required)
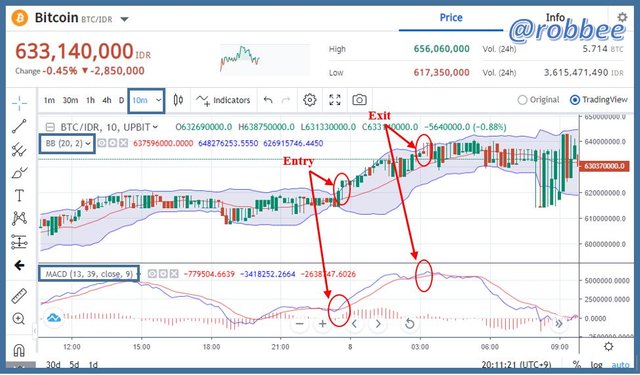
For this trade, I will practice trading using the MACD indicator (12, 26, 9) and Bollinger bands using 2 standard deviations based on a 20-day moving average with a 10-minute timeframe. I used two indicators to get more convincing results. For this question, I will practice trading on BTC/IDR assets.
Based on the trading practice picture above, I purchased 23:40 (UTC +7). When buying with a candle signal, the candle breaks through the upper band, which indicates that traders are encouraged to enter buy because the position is trending. The MACD indicator shows strengthening momentum as well as the crossing of the MACD line supports and confirms that this is the perfect time to buy.
Then, I did an exit at 03:10 (UTC +7). At the time of the sale, the candle signal penetrated the upper band but the market was experiencing overbought. Overbought is a sign that the market is expected to decline. The MACD indicator shows the weak momentum and also the intersection of the MACD line supports and confirms that this is the right time to get out of the trade. This is a strategy to trade quickly and safely.

6). Do a better Technical Analysis considering the above-explained trading strategy and make a real buy long or sell short position at a suitable entry point in any desired exchange platform. Then close that buy or sell position after appearing trend reversal signal from the Parabolic SAR indicator. Here you can also close your Buy or Sell position using any other desired Trading Method in addition to the signal coming from the Parabolic SAR indicator. However, here you must prove that trading method as a reason for closing your position. (Usually, You should demonstrate all the relevant details including entry point, exit point, resistance lines, support lines or any other trading pattern. Use at least 2X leverage and no more than 10X )
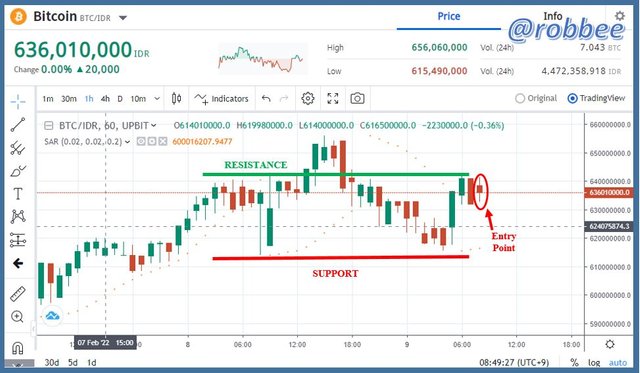
Technically, the chart for the BTC/IDR pair is currently showing a good time to buy because the SAR point is below the chart. Then another reason that supports the reason why this condition is good for entry is that 3 SAR points have appeared. So based on the tips given by the inventor of the Parabolic SAR indicator, namely J Welles Wilder, showing 3 dots is enough to be a condition that it is an accurate signal.
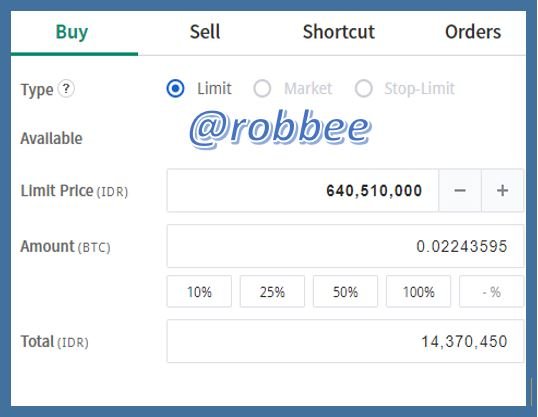
In this purchase I used 10x leverage with a capital of 100 USD (1,437,045 IDR) to 1000 USD (14,370,450). with 1000 USD, I bought at 44571.33 USD (640.510,000 IDR), so I got 0.02243595 BTC.
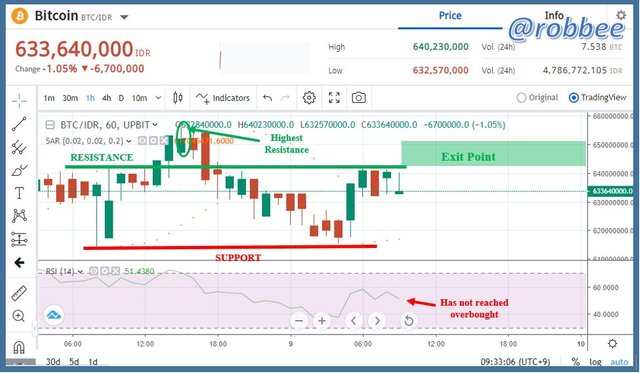
To determine the exit point, I added the RSI indicator to read market conditions. The indicator signal shows at 55 so the market is still oversold (has not passed 70). Judging from the chart that it looks like it will break the resistance point, it is very likely that the RSI will indicate an overbought market condition. Therefore, I think that we can take profit in this trade but don't make an exit point above the highest resistance, just make an exit point below it.

Conclusion
Leveraged trading has the upside of helping novice traders to increase their capital to make large profits. But on the other hand, sometimes leverage can cause psychological problems for some traders because they are complacent with a lot of capital so that not a few of them suffer losses and even exceed the margin call limit.
In the use of leverage, traders should be wise and do not take too much leverage. The use of risk management is indispensable for leveraged traders. Traders should be able to control their capital as well as possible.
There are many ways for traders to be successful in leveraged trading. The use of the right indicators and good technical analysis is a very important asset for traders to get maximum profit on leveraged trading.

