Hello steemian ...
This is my new post in the Steemit Crypto Academy community, on this season 5 week 2, I will be working on a homework from professor @pelon53 with the theme "Metric Indicators”.

we will discuss it through the homework below:

1.) Indicate the current value of the Puell Multiple Indicator of Bitcoin. Perform a technical analysis of the LTC using the Puell Multiple, show screenshots and indicate possible market entries and exits.
One indicator that is often used by Bitcoin miners is the Puell Multiple matrix indicator. This puell multiple indicator helps Bitcoin miners to get various information on the activities of other Bitcoin miners. This puell multiple uses the calculation of the current number of miners divided by the historical average of one year. This pull multiple indicator is the same as other indicators that can help to get buy or sell signals, so the puell multiple indicator can be used to find out buy and sell signals that make miners or investors profit. The following is the current Bitcoin value in puell multiple indicator.
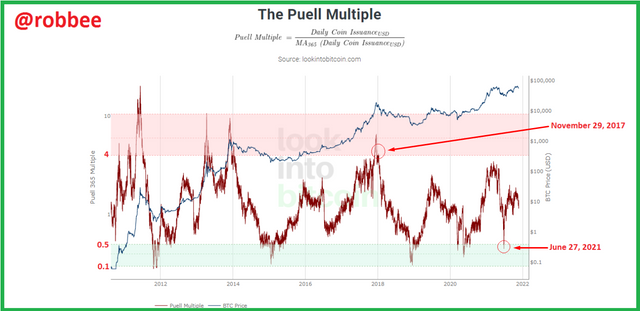
In the puell multiple indicator picture above, we can see two red and green zones. The green zone starts from 0.1 to 0.5, if the pull multiple indicators enter the green zone then it gives a buy signal for investors because the miners' profitability is low. In the picture above, the puell multiple indicator last entered the green zone on 27 June 2021 with a value of 0.45.
The red zone on the puell multiple indicator starts from values 4 to 10, this red zone indicates a sell signal for bitcoin miners and also for investors who have made previous purchases. The red zone gives a sell signal because the miners' profitability is already high. Puell multiple indicator entered the red zone last time from November 29, 2017, to December 22, 2017.

Here I am doing this task on November 26, 2021, but in the puell multiple indicator the last update was on November 24, 2021, with the Bitcoin multiple indicator puell value is 1.404486, which indicates that the Bitcoin multiple indicator puell on 24 November 2021 is between the green and red zones.
The following is an analysis of the LTC technique using the Puell Multiple Indicator.

The use of the puell multiple indicator on LTC is the same as the use of the puell multiple indicator on Bitcoin when the green zone indicates a buy signal while the red zone is a sell signal.
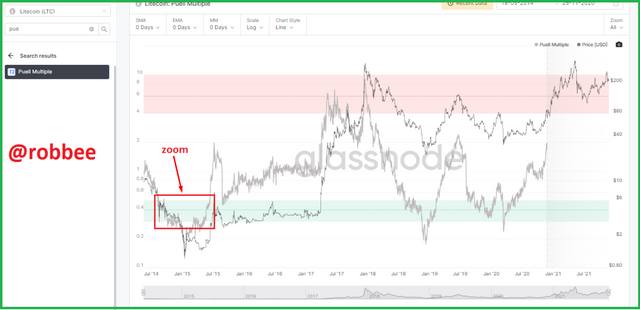

In the picture above, the first time LTC touched the green zone on the puell multiple indicator was on August 12, 2014, with the puell multiple indicator LTC value being 0.465 and the LTC price being $5.65.

The pull multiple indicator lasts so long in the green zone before rising to touch the red zone. The green zone started on August 12, 2014, until June 13, 2015. On June 13, 2015, the puell multiple LTC touched the value of 0.466 with a price of $1.88 LTC.
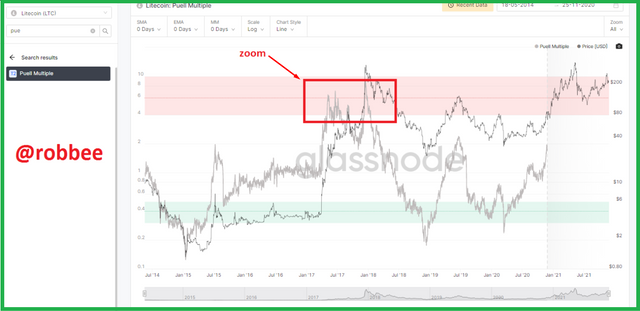

The puell multiple indicator started to enter the red zone which signaled investors and miners to sell on 02 May 2017 with multiple indicator values of 4.25 and an LTC price of $16.70. Puell multiple indicator takes approximately 2 years to hit the red zone. This puell multiple indicator also takes a long time to get out of the red zone, even though the puell multiple indicator has been out of the red zone but the puell multiple indicator re-enters.

The puell multiple indicator on LTC last touched the red zone on January 14, 2018, with a puell multiple values of 4.43 and an LTC price of $240.08. Until now, the pull multiple on LTC has not touched the red zone again.
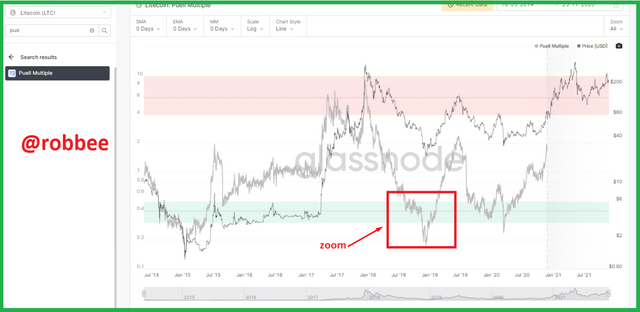


The puell multiple indicator started to touch the green zone again on August 10, 2018, with a puell multiple value of 0.46 for $59.39, the green zone lasted until February 9, 2019, with a puell multiple value of 0.496 and an LTC price of $44.82.
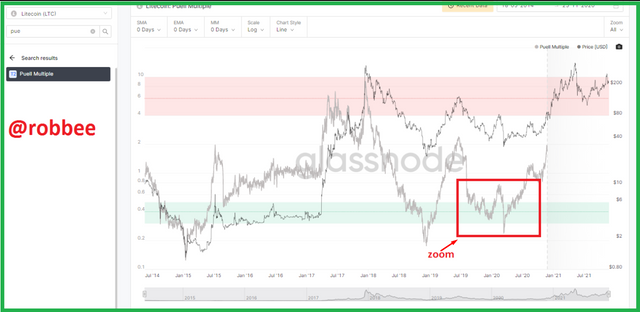


After the puell multiple left the green zone on February 9, 2019, the puell multiple has not touched the red zone again, instead, the puell multiple has again touched the green zone on August 16, 2019, with a puell multiple values of 0.49 and an LTC price of $74.91, this green zone lasts until the 5th June 2020 with a puell multiple of 0.48 and an LTC price of $47.09.
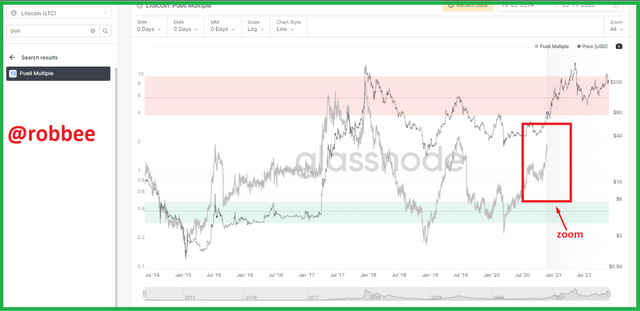

When I created this task the puell multiple on LTC was at 1,703 and the LTC price was $82.34, the puell multiple is currently outside the green zone as well as the red zone.

2.) Explain in your own words what Halving is, how important Halving is and what are the next reward values that miners will have. When would the last Halving be. Regarding Bitcoin
Bitcoin halving Every 4 years, halving means that the bitcoin reward that will be given to miners will be reduced by half. Currently, the halving has occurred several times, the first being in 2012 where the bitcoin reward which was previously 50 BTC per block later became 25 BTC per block. The second is 2016, the reward is "halved" to 12.5 BTC per block, and the last is in 2020, the bitcoin reward is 6.25 BTC per block. It is estimated that bitcoin will end its halving in 2140.
Furthermore, it is estimated that bitcoin will experience a halving in 2024 as it follows a 4-year cycle. It is estimated that at that time the reward that will be received is 3,125 BTC per block.
The reward that miners currently receive is 6.25 BTC per block, this is based on the halving that occurred in 2020.
The 2 coins that have halved are BTCV (Bitcoin Vault) and ELCASH (Electric Cash). Different from Bitcoin, BTCV halving once every 6 rounds, starting from 2019 and ending in 2024. Meanwhile, ELCASH coins have halving once a year, starting in 2020 and ending in 2030.

3.) Analyze the Hash Rate indicator, using Ethereum. Indicate the current value of the Hash Rate. Show screenshots.
Hash rate is one of the indicators used by Bitcoin miners to determine the level of mining speed. To be able to complete a block of crypto asset transactions on the blockchain we have to make guesses, the value of this hash rate indicator depends on the difficulty of the guesses given. When the miners can complete the given guesses, the miners will be rewarded in the form of Bitcoin. The hash rate is not only used to measure the speed of mining, the hash rate is also often used to see the health of the Bitcoin network. The higher the hash rate, the security of the Bitcoin network will be stronger from cyber attacks and other attacks that harm miners. The hash rate will increase if the machines used by miners to find the next block are increasing.
The image below is a hash rate indicator on Ethereum.
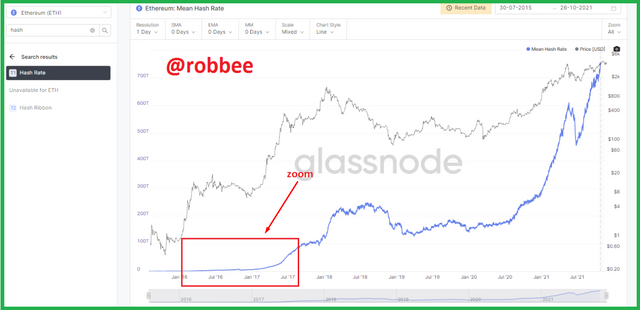

From the hash rate indicator graphic above, we can see that the hash rate value below 2017 can be said to be very low, the increase in the hash rate value started in 2017. The hash rate value started to touch 10 TH/s with a price of ETH $ 14.95 on 26 February 2017.
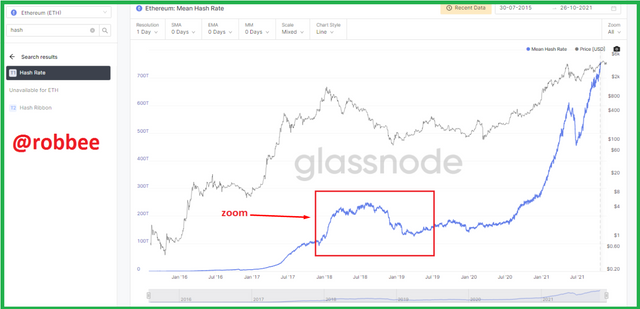


Until then, the hash rate on Ethereum continued to increase, although there had been a decline, although, before the decline, the highest ethereum hash rate was 247 TH/s for $466.79. The hash rate continued to decline until March 30, 2019, with a hash rate of 126 TH/s and an ETH price of $143.20.
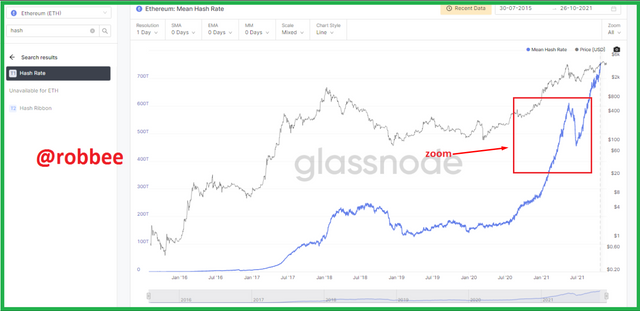


After previously experiencing a decline until March 30, 2019, the hash rate chart jumped again to touch the hash rate value of 610 HT/s and the price of ETH $2,762.41 on May 20, 2021. Then the hash rate fell again until the hash rate touched 455 TH/s and the price of ETH is $1,816.24.
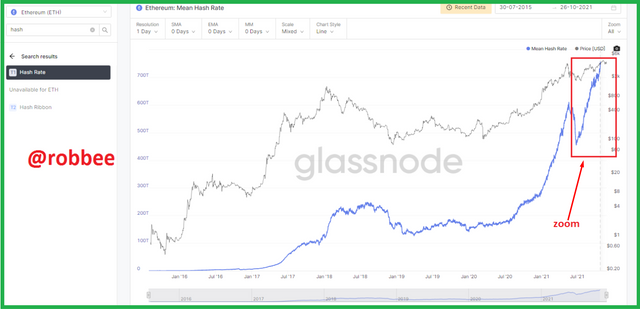

The hash rate value is still increasing after a slight decline until 20 May 2021, currently, the hash rate is 755 TH/s and the price of ETH is $4,132.42.
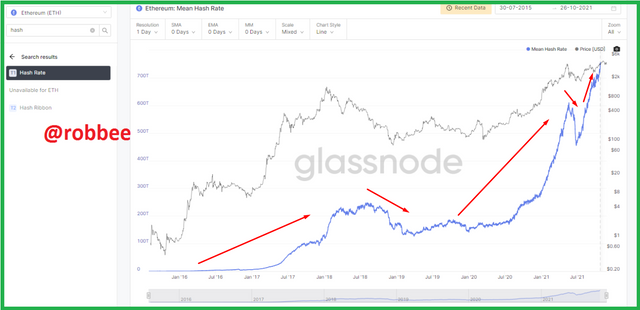
From the picture above, we can see the overall increase in the hash rate value, which initially the hash rate was below 10 TH/s and then started to rise in 2017 until now the hash rate has touched 755 TH/s.

4.) Calculate the current Stock to flow model. Explain what should happen in the next Halving with the Stock to Flow. Calculate the Stock to flow model for that date, taking into account that the miners' reward is reduced by half. Show screenshots. Regarding Bitcoin.
To find the stock to flow value, we must know the formula used to find the stock to flow value, the stock to flow formula is:
For stock value, we can see it on the coinmarketcap platform. The stock of BTC on November 27, 2021, is 18,884,225.00 BTC. So :

Stock = 18,884,225.00 BTC
Next, we look for the annual flow value, to find the flow value using the formula:
For the value of the prize, it can be seen in the table of having calculation results below:

Annual flow = 6.25 BTC/Block * 52,560
Blocks/year = 328,500 BTC/Year
So :
SF = 18,884,225.00 BTC / 328,500 BTC/Year
SF = 57.49
To find the value of the SF indicator line using the formula:
Then the SF Line:
SF model = 0.4 * (57.49)^3
SF Model = 0.4*190.010.2
SF models = 76.004.08 BTC
Here I will look for the stock to flow value at the next having, which is in 2024, and the following is the calculation using the same formula as before.
SF = stock/flow
Stock = 19,687,500 BTC (this value is obtained from the calculation of having in the previous table)
Annual flow = Rewards / Block * annual block production
Annual flow = 3.13 BTC/Block * 52.560
Blocks/Year = 328,500 BTC/Year
SF = 19,687,500 BTC / 328,500/year
SF = 59.93
Model SF = 0.4 * SF^3
SF Model = 0.4 * (59.93)^3
SF Model = 0.4 * 215,244.9
SF models = 86,096.96 BTC
The SF model for the current having is 76.004.08 BTC while the SF model for the next having is 86,096.96 BTC, with the increase in the SF value in the next having signifies that Bitcoin is more scarce and automatically the price will be expensive.
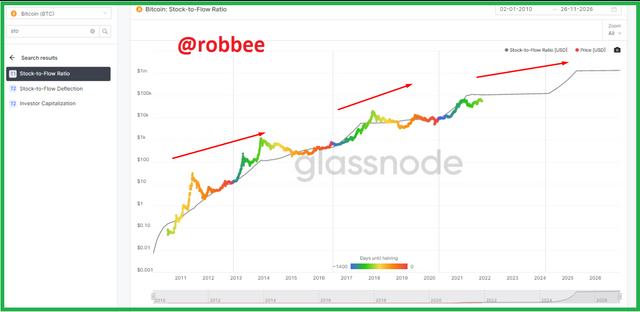
From the stock to flow chart above, we can also see that stock to flow will continue to rise in the coming year, and also the chart above proves that the calculations made are correct because the results of the calculations and the graph are both rising.

5.) Conclusion
The main function of the indicator helps us in carrying out all activities in the crypto world, whether it is trading or mining. In this lesson, I'm learning more about the matrix indicators used when mining BTC. Each matrix indicator has its use, and in this lesson, there are three matrix indicators studied, namely puell multiple, hash rate, and stock of slow. Although the three matrix indicators have their respective uses, the important point is that the matrix indicators provide us with information about Bitcoin mining and others.
The current pull multiple indicator, gives us information that the current state of the pull multiple on LTC and BTC is in a position between the red zone and the rain zone, which means that it's not yet time for miners or investors to buy or sell. The hash rate indicator provides information that the hash rate on ETH from 2017 to 2021 has a high rising graph. While the stock of flow provides information that BTC will continue to rise at the next having.

References:
https://studio.glassnode.com/metrics?a=LTC&category=&m=indicators.PuellMultiple&s=1582932476&u=1621330125&zoom=
https://www.lookintobitcoin.com/charts/puell-multiple/
https://koinpro.co/hashrate-mining-adalah/
https://blog.pluang.com/cerdascuan/hash-rate-adalah/
https://studio.glassnode.com/metrics?a=ETH&category=&m=mining.HashRateMean&zoom=all
https://coinmarketcap.com/currencies/bitcoin/
https://studio.glassnode.com/metrics?a=BTC&category=&m=indicators.StockToFlowRatio&zoom=all
