Hello steemian ...
This is my new post in the Steemit Crypto Academy community, on this season 6 week 4, I will be working on a homework from professor @reminiscence01 with the theme "Psychology of Trends Cycle”.

we will discuss it through the homework below:

1.) Explain your Understanding of the Dow Jones Theory. Do you think Dow Jones Theory is Important in technical analysis?
Most likely novice traders who enter the world of trading do not know the Dow Jones theory, they will immediately learn technical analysis to gain profits when trading. But when I will teach about trading to new traders, I will recommend for new traders to learn the theory from Dow Jones, I do this because Dow Jones theory is the most basic theory in trading strategy before we get to know other trading strategies.
Like the initial explanation that the Dow Jones theory is basic in trading strategies popularized by someone through the wall street journal, namely Charles Dow, his name will be easy to remember because his name is embedded in the name of the theory he popularized. Charles Dow is a journalist and editor at one of the journals that introduced his theory, namely the Wall Street Journal, and also Charles Dow is the founder of Dow Jones and Company, where the company name also embeds his name so that his name and theory are easy to remember.
As we know that a theory will not be published without science, every theory must be based on a science that is found. The basic science of the Dow Jones theory was discovered by Charles Dow when he saw stock price movements tend to rise or fall in a stock trend which was later discovered by Charles Dow. But what we must know is that Charles Dow only discovered the basic knowledge of the Dow Jones theory, while the Dow Jones theory was not published directly by Charles Dow.
The Charles Dow theory was first published by William P. Hamilton with his book entitled "The Stock Market Barometer". The question is why didn't Charles Dow publish his theory? This was due to the death of Charles Dow in 1902, due to the death of Charles Dow, William P. Hamilton replaced Charles Dow's editor position at the Wall Street Journal and developed the knowledge discovered by Charles Dow into a theory in his book. Not only that, the theory of Charles Dow and William was later developed by Robert Rhea in his book entitled "The Dow Theory" which we still use to conduct market analysis universally.
There are 5 basic principles of Dow Jones theory, these 5 basic principles are:
- The Market Absorbs Everything,
- The Market Has 3 Types of Trends,
- Trend Has 3 Phases,
- Trend Confirmed by Trading Volume,
- Belief in Trends Until Signals Appear.
The 5 basic principles of the Dow Jones theory above are the basis of all technical analysis, and of course, this Dow Jones theory is very useful in technical analysis, and in my personal opinion before studying other technical analyses, we should first study Dow Jones theory for ease of studying analysis. other techniques. I can say here that the Dow Jones theory is the basis of every technical analysis used when trading.

2.) In your own words, explain the psychology behind the Accumulation and Distribution phases of the market. (Screenshots required).
As many traders know, market prices can be manipulated, driven by big investors. Of course, I believe that the market price movements made by big investors are profitable for them. Meanwhile, retail traders can only follow the direction of the trend and follow the way big investors think to make a profit. Therefore retail traders will use technical analysis to take advantage of the market direction movements made by large investors. Profits in trading are obtained when we enter buy at a low price and sell at a high price or we buy at the beginning of a bullish trend, besides that, we can also get profits when selling at a high price and buying back at a low price or selling at the beginning of a trend. Bearish. In addition to the above advantages, we can get other benefits if we know the market is in a state of accumulation and distribution, therefore I will explain how the accumulation and distribution phases are.
Accumulation Phase
The accumulation phase is a phase where large investors will make purchases in stages until the assets are collected by the targets desired by the big investors, when the assets collected by large investors have been met, they will make injections to make the graph experience an uptrend. As retail traders, when we know that the market is in an accumulation phase, we can prepare ourselves to profit when the chart experiences an uptrend. The accumulation phase is marked by the chart being in a sideways trend, when this happens we can create support and resistance areas to be a signal when the chart exits the accumulation zone and begins to experience an uptrend. For more details, see the image below.

As can be seen in the image above, when the chart is in an accumulation phase, we can place support and resistance areas to profit when the chart experiences an uptrend. Placement of support and resistance is because, at the accumulation stage, the graph will usually experience an uptrend. When the chart is out of the accumulation zone as can be seen in the picture above, the chart is in an uptrend. If we as retail traders can follow the steps made by big investors then we will also benefit. when the chart starts to experience an uptrend, there will be one time that makes the chart move sideways again like in the picture above. When the chart experiences an uptrend after exiting the accumulation zone and then the chart moves sideways again, there are two possible phases at that time. The first phase is the distribution phase which will be explained in the next title, and the second phase is reaccumulation. We are often deceived when the accumulation phase occurs, so when the next graph experiences sideways, that phase is a distribution phase that makes us exit the market, therefore we must know how the distribution phase is and how the reaccumulation phase is.

To find out whether the phase is a distribution phase or a reaccumulation phase, it can be seen on the breakout of the graph, when the graph penetrates upwards then the phase is a reaccumulation phase, which means the graph will rise again, if the graph breaks down, it means that the phase is a distribution phase. In the picture above, we can see that the chart has broken upwards, which means that this phase is a reaccumulation phase and we don't need to get out of the trade.
Distribution Phase
The distribution phase is a phase in which large investors will exit the trade in the same way as the accumulation phase, which is gradual until all assets are sold so that they get a profit according to their initial target when the large investor's assets have been sold, the graph will automatically be bearish until the graph will enter the accumulation zone again. As retail traders, when we know that the market is in a distribution phase, we can prepare ourselves for profit by selling assets in the distribution zone. The distribution phase is marked by the graph being in a sideways trend, when this happens we can create support and resistance areas to be a signal when the graph comes out of the distribution zone and begins to experience a downtrend. For more details, see the image below.
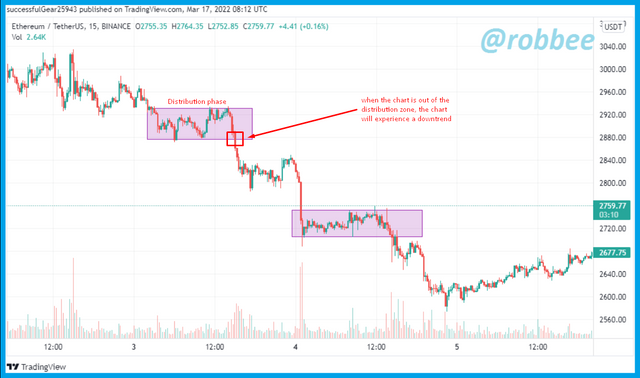
As can be seen in the image above, the chart has initially entered a distribution phase where big investors have started to gradually exit the trade. When this happens we can place support and resistance areas to confirm the phase. We can sell assets when the chart breaks out of support, which means the zone is a distribution zone. When all the assets owned by large investors have all been sold, the chart will experience a downtrend, but what you need to remember is that when the chart exits the distribution zone from the bottom and the chart experiences a downtrend, it does not mean that the assets owned by large investors have all been sold out. We are often deceived when the chart is out of the distribution zone, so we assume that the assets owned by large investors have been sold out, so when the chart stops a downtrend and experiences sideways, we assume that the sideways is a zone of accumulation again and make purchases that make us experience loss. There are 2 possibilities of the sideways trend, firstly the sideways trend is an accumulation zone and the second possibility is that the sideways trend is a redistribution zone.

To find out whether the zone is a redistribution phase or an accumulation phase, it can be seen when a break occurs. When the graph breaks above the zone, the phase is a distribution phase, on the other hand, when the graph breaks down from the zone, the zone is a redistribution zone. Therefore, when you want to purchase after the distribution zone occurs, you should wait for the chart to experience a price breakout. As in the example image above, we can see that the graph has a downward break, which means that the zone after the first distribution phase is the redistribution phase.
We as retail traders must know the phases in the market to enter and exit at the right time so that we get profits when trading. to get a profit when trading from the phases that I have described previously, then we can conclude that we get profits if we buy in the accumulation phase and sell in the distribution phase.

3.) Explain the 3 phases of the market and how they can be identified on the chart.
Apart from the accumulation and distribution phases that I have explained above, we also have to know the phases that occur in the market or better known as market trends to get an advantage when trading. There are 3 types of market trends, where each trend has a different way of earning profits. When the type of market trend is a bullish trend, a bearish trend, and sideways.
1. Bullish trend
A bullish trend is an uptrend or the price of an asset will increase if the trend is bullish. A bullish trend is usually formed because the amount of demand is more than the amount of supply. We know how a bull trend is formed from the amount of supply and demand. Now, what is the shape of the bullish trend on the price chart? When the trend is bullish, the price chart will increase and have a longer green candle dominance, which means the candle is bullish. For more details, see the image below.
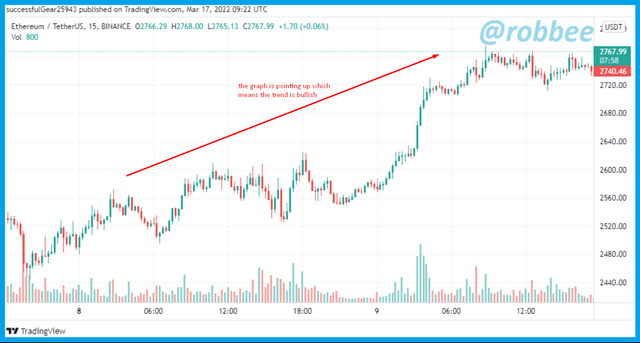
As can be seen in the picture above that the movement of the chart is directed upwards with the dominance of the long green candle. Apart from that, two certain conditions make the chart in a bullish trend, if these two conditions are not formed then we cannot say that the chart is in a bullish trend. When a bullish trend is formed on the chart, the first condition is that the chart will always form a new high that is higher than the previous high, and the second condition is that the graph of a new low is higher than the previous low. If both of the above conditions are met, the chart is in a bullish state.

To get a profit during a bullish trend is to enter a buy at the beginning of a bullish trend.
2. Bearish Trend
A bearish trend is a downtrend or the price of an asset will decrease if the trend is bearish. A bearish trend is usually formed because the amount of supply is more than the number of requests. We know how a bearish trend is formed from the amount of supply and demand. Now, what is the shape of the bearish trend on the price chart? When the trend is bearish, the price chart will decrease and have a long red candle dominance, which means the candle is bearish. For more details, see the image below.
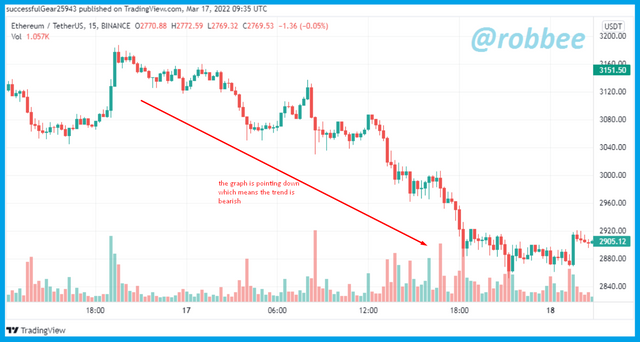
As can be seen in the picture above that the movement of the chart is directed downwards with the dominance of the long red candle. Apart from that, two certain conditions make the chart in a bearish trend, if these two conditions are not formed then we cannot say that the chart is in a bearish trend. When a bearish trend is formed on the chart, the first condition is that the chart will always form a new low that is lower than the previous low, and the second condition is that the chart's new high is lower than the previous high. If both of the above conditions are met, the chart is in a bullish state.

To get a profit during a bullish trend is to do an entry-sell at the beginning of a bearish trend.
3. Sideways
If the chart's bull trend is up, the chart's bearish trend is down, then when it's sideways the chart moves horizontally. These sideways are often said to be on a broken chart. There is no dominant candle movement on this sideways. When the chart is sideways, the chart will be in the support resistance zone and then the chart will bounce several times in the support and resistance areas before the breakout occurs. For more details, see the image below.

As can be seen in the picture above, the chart moves horizontally and moves within the support and resistance zones. When the chart is in a sideways state, we can make several entries. We can do the first entry by taking advantage of the chart bounce, when the chart hits the support area, we can make a buy entry and place a take profit when the chart hits resistance. We can do the second entry when the chart has a breakout in the support or resistance area.
Apart from identifying the bullish trend, bearish trend, and sideways as above, we can also use technical analysis to see the trend that is being formed on the chart. We can also use the help of indicators to see the movement of the trend direction. There are many ways to identify trends, we can use any method to identify trends according to our needs and ease of use.

4.) Explain the importance of the Volume indicator. How does volume confirm a trend? Do this for the 3 phases of the market (Screenshots required).
Previously we have discussed the phases of the market and market trends. These two things are very closely related. As I explained earlier that the market trend consists of 3 types, bullish trend, bearish trend, and sideways, while the market phase consists of the accumulation phase and distribution phase. When the market is in the accumulation phase, the market will move sideways. When the market is in a state of accumulation and forming sideways, then we will usually create support and resistance areas to find out when the chart will break out of the accumulation zone and form a bullish trend. What we have to pay attention to here is whether every chart out of the zone will immediately experience a bullish trend, of course not. It is possible that when the chart exits the accumulation zone then the chart re-enters the zone, which means that the signal given is a false signal. To anticipate this we can use the volume indicator to ensure that when the chart exits the accumulation zone, the chart will continue to rise until the distribution phase. To find out how to use it can be seen in the image below.
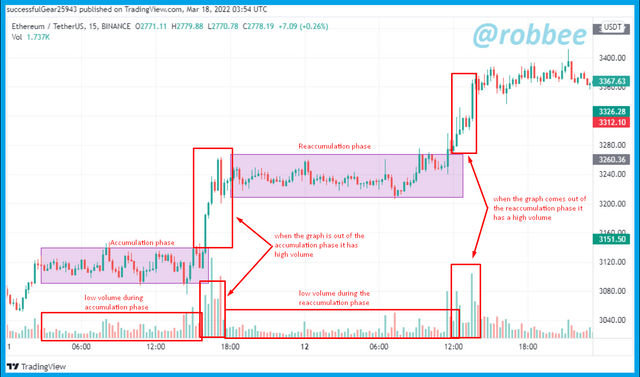
As can be seen in the accumulation and reaccumulation phases above, when the graph in the accumulation and reaccumulation phases we can see that the volume formed is relatively small and flat because the volatility formed is relatively small. As we know, after the graph goes through the accumulation phase, the graph will experience a bullish trend, the bullish trend after the accumulation phase is indicated by a graph that comes out of the accumulation phase and then increases with a note that the volume formed is high, if the graph exits the accumulation phase and is followed by volume is low, then a bullish trend will not be formed. We can see in the picture above, after the accumulation and reaccumulation phases, the chart experienced a bullish trend followed by high volume.
Likewise in the distribution phase, when the graph enters the distribution phase, the low volume will form. As we know that after the distribution phase there will be a bearish trend, a bearish trend will occur if the graph exits the distribution phase followed by the graph heading down and has high volume, if this happens then the graph is really out of the distribution phase, for more details can be seen in the image below.
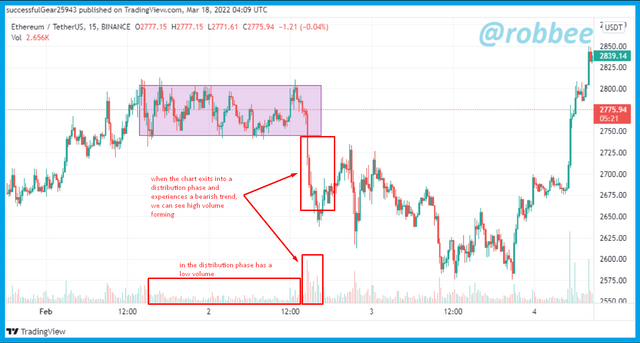
As can be seen in the image above, in the distribution phase a low volume is formed, when the graph exits the distribution phase we can see that a high volume is formed. From these two examples, we can conclude that volume is very necessary to know the market is in a state of accumulation and distribution phase, then the volume is also very necessary to see market movements when it comes out of the accumulation and distribution phase.
In addition to using volume in the distribution and accumulation phases for profit, volume can also be used to identify the direction the trend will continue or the trend will reverse. For that, I will explain how to confirm the trend using volume.
1. Confirm the bullish trend using volume
As we know that a bullish trend will form when the chart creates a new high that is higher than the previous high and the chart also creates a new low that is higher than the previous low. If these two things are formed then a bullish trend is occurring. We also have to pay attention to one important thing when the formation of a bullish trend, as we know that the chart will form a new high and a new low during a bullish trend when the chart forms a new low in the bullish trend which is usually called a retracement. The formation of a new low is said to be a retracement with a note that low volume is formed, if the low volume is formed when a new low is formed, a retracement is formed not a trend reversal. If a high volume is formed when a new low is formed, it can be ascertained that the bullish trend has stopped and a trend reversal will occur, an example can be seen in the image below.
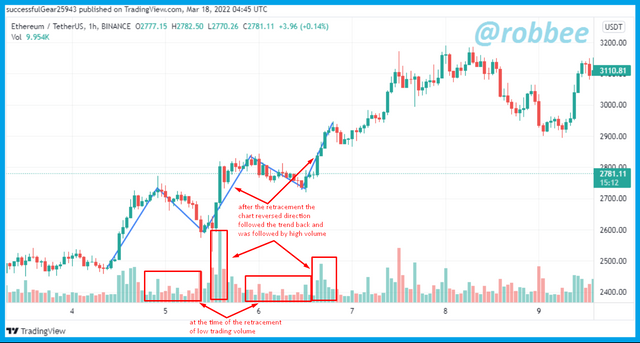
As can be seen in the example image above, low volume is formed during the retracement, which means the bullish trend will continue, besides that, we can see after the retracement the chart rises again followed by high volume. Therefore, to confirm a bullish trend, we should see low volume during the retracement and high volume when the chart rises after the retracement.
2. Confirming the Bearish Trend using volume
As we know that a bearish trend will form when the chart creates a new low that is lower than the previous low and the chart also creates a new high that is lower than the previous high. If these two things are formed then a bearish trend is occurring. We also have to pay attention to one important thing when the formation of a bearish trend, as we know that the chart will form new highs and new lows when the trend is bearish when the chart forms new highs in the bearish trend which is usually called the retracement. The formation of a new high is said to be a retracement with a note that low volume is formed, if the low volume is formed when a new high is formed, a retracement is formed not a trend reversal. If a high volume is formed when a new high is formed, it can be ascertained that the bearish trend has stopped and a trend reversal will occur, an example can be seen in the image below.
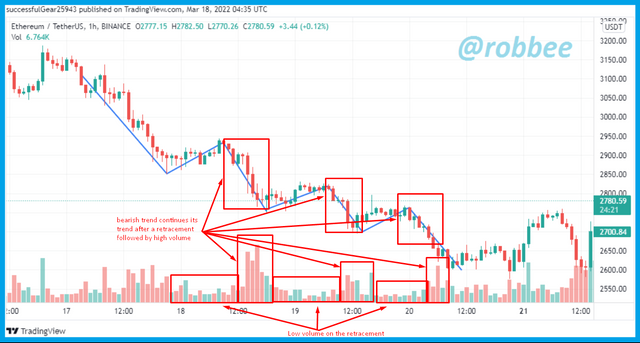
As can be seen in the example image above, low volume is formed during the retracement, which means the bearish trend will continue, other than that we can see after the retracement the chart drops again followed by high volume. Therefore, to confirm a bearish trend, we should look for low volume during the retracement and high volume when the chart drops after the retracement.
3. Confirm Sideways using volume
To confirm sideways using volume is fairly easy. As we all know that sideways move horizontally without having the price go up or down. Sideways will be in the support resistance zone and move to bounce in the support and resistance area. To confirm sideways using volume, we have to see when the chart is in a sideways state then the low volume will form. For more details, see the example below.
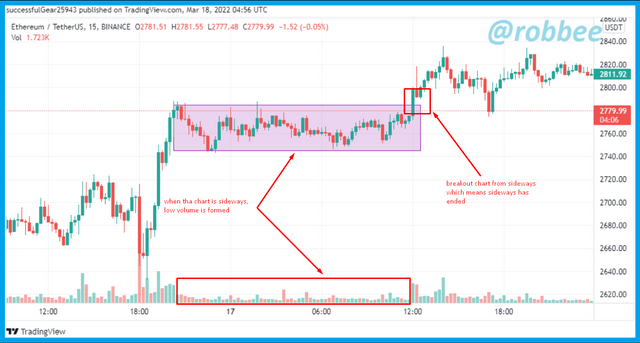
As can be seen in the example above, we can see the movement of the chart is directed horizontally within the support and resistance areas. Next, we look at the volume indicator, we can see that when the chart is in a sideways state, the low volume will always be formed as in the picture above. When the market is in a sideways state, usually we will wait for the market to breakout upwards or downwards, when the market experiences an upward or downward breakout then a high volume will form to give a signal that the sideways will end.
From some of the explanations above, we can conclude that the volume indicator is a very important indicator to confirm the direction of the trend and also to confirm the accumulation and distribution phases. Therefore, we can look at the 5 basic principles of the Dow Jones theory, which is to use volume to confirm the trend, which means that volume is needed to confirm the trend in the market.

5.) Explain the trade criteria for the three phases of the market. (show screenshots)
Previously we already knew 3 phases that occurred in the market or commonly called market trends, namely the bull trend, bearish trend, and sideways. Each market trend has its criteria, with these criteria we can enter the market to get a profit. Therefore, I will explain the criteria for each trend.
Bullish Trend
Previously I explained that the bullish trend is an uptrend that occurs because the number of requests is greater than the number of offers, this is what makes a bullish trend occur. Therefore, here are some criteria for the bullish trend that we must pay attention to before making an entry buy in the market.
- For the first, I have explained many times. Before entering the market in a bullish trend, we must make sure that the chart is moving up. When the chart moves up, make sure the chart always forms a new high that is higher than the previous high and a new low that is higher than the previous low. Finally, make sure after the retracement the chart has increased with high volume.
- To make an entry during a bullish trend, we can do it when the chart reverses direction again following the trend after the retracement that forms a new low. In short, we are waiting for the chart to make a retracement that forms a new low, after the chart reverses direction following the trend again we can start buying entries.
- After making a buy entry, then we can place a stop loss and take profit. We can place the stop loss below the new lowest price, for take profit, we can place it in a ratio of 1:1 or 2:1 from the stop loss.
The three criteria above are things that we must pay attention to get profits when a bullish trend occurs. For more details, see the image below.

As can be seen in the image above, initially the graph moved up. Then we can see that the chart is forming a new high higher than the previous high and a new low higher than the previous low. Because the bullish trend has been identified, I make a buy entry when the chart reverses direction following the trend again after the retracement. Then I place my stop loss below the new low and place my take profit in a 2:1 ratio of the stop loss.
Bearish trend.
Previously I explained that the bearish trend is a downtrend that occurs because the amount of supply is greater than the number of requests, this is what makes a bearish trend occur. Therefore, here are some of the criteria for a bearish trend that we must pay attention to before making a sell entry in the market.
- For the first, I have explained many times. Before entering the market in a bearish trend, we must ensure that the chart is moving down. When the chart moves down, make sure the chart always forms a new low that is lower than the previous low and a new high that is lower than the previous high. Finally, make sure after the retracement the chart has increased with high volume.
- To make an entry during a bearish trend, we can do it when the chart reverses direction again following the trend after the retracement that forms a new high point. In short, we are waiting for the chart to make a retracement that forms a new high, after the chart reverses direction following the trend again we can start selling entries.
- After making a sell entry, then we can place a stop loss and take profit. We can place the stop loss above the new high, for take profit we can place it in a ratio of 1:1 or 2:1 from the stop loss.
The three criteria above are things that we must pay attention to get profits when a bearish trend occurs. For more details, see the image below.

As can be seen in the image above, initially the graph moved down. Then we can see that the chart forms a new low lower than the previous low and a new high lower than the previous high. Because the bearish trend has been identified, I make a sell entry when the chart reverses direction following the trend again after the retracement. Then I place my stop loss above the new high and place my take profit in a 2:1 ratio of the stop loss.
sideways
Sideways is a market movement that moves horizontally. There are many entry points in the sideways market, so doing a third sideways entry is very risky because there is no clear movement pattern that makes us unable to enter at a clear point. Even so sideways has their criteria.
- To make an entry when the market is sideways at first we must identify the sideways market, the sideways market occurs when the market moves horizontally and moves within the support and resistance areas. When the chart is in a sideways state, the low volume will be formed, besides that the chart will bounce several times in the support and resistance areas.
- To enter into the sideways market is very easy, we can buy entry under two conditions, the first condition is when the chart bounces off the support area while the second condition is when the chart breaks out the resistance area, which means the chart is out of the sideways zone. We can also do sell entries in two conditions, the first condition is when the chart bounces off the resistance area, while the second condition occurs when the chart breaks out of area support, which means the chart is out of sideways.
- For the placement of stop loss and take profit on the sideways there are several kinds. When we make a buy entry because the chart bounces off the support area, we can place a stop loss under the support area while we can place our take profit in the resistance area, while when we enter a buy when the chart experiences a resistance breakout, we can place a stop loss in the support area. while we can place the take profit with a ratio of 1:1 from the stop loss. When we do a sell entry because the chart bounces off the resistance area, we can place a stop loss above the resistance area while we can place a take profit on the support area, whereas when we make a sell entry because the chart has a support breakout, we can place a stop loss in the resistance area while We can place take profit with a ratio of 1:1 from the stop loss.
Even though there are criteria for entry in the sideways market, I do not recommend entering in the sideways market, you should wait until the chart experiences a bullish trend or a bearish trend. Maybe I will give a few examples of entry in the sideways market.


6.) With the Trade criteria discussed in the previous question, open a demo trade for both Buy/ Sell positions.
To solve this question I used the indodax platform to do the analysis and execution. Indodax is an exchange platform from my country Indonesia. Therefore, below I will explain the buy and sell positions that I have done.
Entry buy
To do an entry buy I use the AAVE/IDR coin with a 15-minute timeframe. Immediately, you can see below the results of the analysis I did.

As can be seen in the picture above, the chart is moving in a bullish trend. We can see in the chart above that the chart forms a new high that is higher than the previous high and a new low that is higher than the previous low. Before I make an entry we can see that the chart is forming a retracement to a new low, we can see that low volume is forming during the retracement. After the chart makes a retracement the chart reverses direction following the direction of the previous trend with high volume. Therefore I decided to enter for 2211653 IDR or 153.89 USDT. Then I put my stop loss below the new low, which is at the price of 2179305 IDR or 151.59 USDT, and put my take profit with a 2:1 ratio of the stop loss at 2276235 IDR or 158.33 USDT. For proof of purchase, see the pictures below.


Entry sell
To make a sell entry I use the ADA/IDR coin with a timeframe of 30 minutes. Immediately, you can see below the results of the analysis I did.

As can be seen in the picture above, the chart is moving in a bearish trend. We can see in the chart above that the chart forms a new low that is lower than the previous low and a new high that is lower than the previous high. Before I make an entry we can see that the chart is forming a retracement to a new high, we can see that low volume is forming during the retracement. After the chart makes a retracement the chart reverses direction following the direction of the previous trend with high volume. Therefore I decided to make a sell entry at the price of 11868 IDR or 0.825 USDT. Then I placed my stop loss above the new high, which was at 11914 IDR or 0.829 USDT, and placed my take profit with a 2:1 ratio of the stop loss at 11776 IDR or 0.819 USDT. For proof of purchase, see the pictures below.


7.) Conclusion
Dow Jones theory is a basic theory of technical analysis that should be studied first before studying other technical analysis because Dow Jones theory is the basis of all market technical analysis theories. The Dow Jone theory is a theory discovered by Charles Dow and later developed by several people such as William P. Hamilton and Robert Rhea. The Dow Jones theory has 5 basic concepts that are still used today, the 5 basic concepts of the Dow Jones theory are the market absorbs everything, the market has 3 types of trends, the trend has 3 phases, the trend is confirmed by trading volume, believes in the trend until a signal appears.
Dow Jones theory also teaches us the market psychology behind the accumulation and distribution phases. The accumulation phase is a phase in which large investors purchase assets gradually until the assets are collected according to the target, while the distribution phase is a phase where large investors sell assets that have been collected previously. As retail traders, we have to know where the accumulation and distribution phases are to make a profit when trading.
In addition to the above phrases, the market also has 3 types of trends. The 3 types of trends in the market have different ways of getting profits, the three trends are the bullish trend, the bearish trend, and the sideways. A bullish trend occurs when the chart moves up, a bear trend occurs when the chart moves down and sideways occurs when the chart moves horizontally. Every trend and phase that occurs in the market has one thing in common, the thing is that trends and phases require trading volume to identify them. Therefore volume is an indispensable tool for identifying trends and phases when it comes to profit.
Every trend that occurs in the market has its criteria. One of the criteria for a bullish trend is that the chart must be in an uptrend, then the chart forms a new high that is higher than the previous high and a new low that is higher than the previous low. One of the criteria for a bearish trend is that the chart must move down, then the chart forms a new low that is lower than the previous low and a new high that is lower than the previous high. While one of the sideways criteria is that the chart must move horizontally and the chart will usually bounce in the support and resistance areas.

References:
https://www.tradingview.com/chart/ITAaNOcQ/
https://indodax.com/en/
https://www.mentarimulia.co.id/edukasi/teori-dasar-trading-bernama-teori-dow/
