Hello steemian ...
This is my new post in the Steemit Crypto Academy community, on this 16th week I will be working on a homework from professor @stream4u with the theme "Pivot Points.".
Pivot point is an indicator that has a function to be able to determine the level of support and resistance level in a certain period, this is based on the previous period that experienced changes or price movements. Therefore, traders can know when to bounce and breakout at each level.
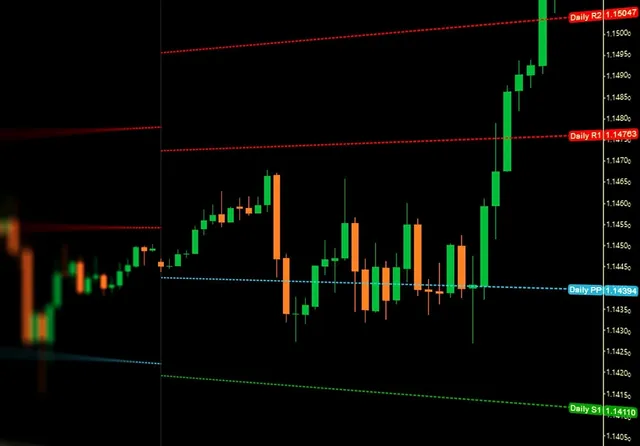
SOURCE:https://poshtrader.com/education/pivot-point-indicator-and-strategy/
For that I will immediately explain it according to the homework given by professor @stream4u.
1. Discussed your understanding of Pivot Points. (Title For this topic will be Pivot Points)
Pivot point is an indicator that has a function to be able to determine the level of support and resistance level in a certain period, this is based on the previous period that experienced changes or price movements. Therefore, traders can know when to bounce and breakout at each level. To determine the breakout, traders can observe the SR level as a guide for opening long or short positions.
2. Details about Pivot Point Levels.
There are several levels at the pivot point, namely the first resistance level (R1), the first support level (S1), followed by the R2 level, S2 level, R3 level, and S3 level. All of this is determined by the pivot point which is based on the highest, lowest and closing price movements in the previous period.
3. Pivot Point Calculation and R1 R2 S1 S2 Pivot Levels Calculation.
First of all, we have to determine the pivot point (PP) first.
PP = (highest price + lowest price + closing price) / 3
After that, we can calculate the pivol level R1 R2 S1 S2, namely:
RI = (2 x PP) – lowest price
R2 = PP + (highest price – lowest price)
SI = (2 x PP) – highest price
S2 = PP - (highest price – lowest price)
4. How to Apply Pivot Point on Chart. (Screenshot with tag your name)
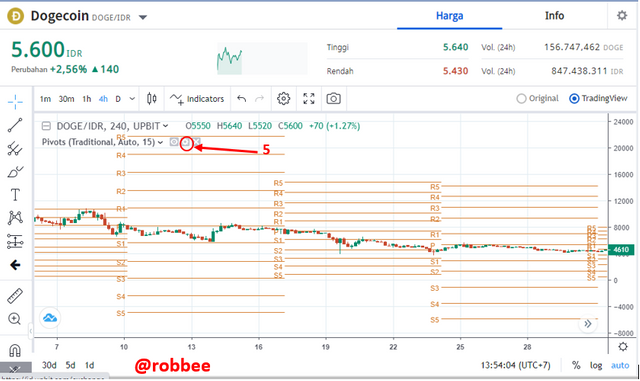
To apply pivot points to the chart, I will use the upbit platform and the dogecoin chart as an example:
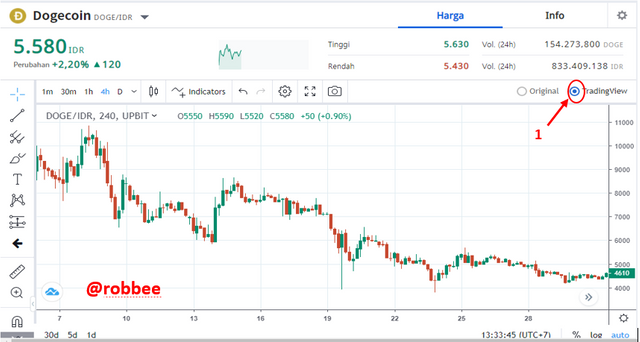
1.make sure you choose the trading view view because for the original view there is no indicator option.
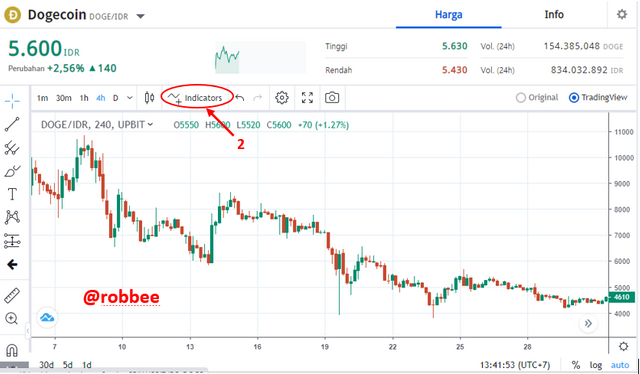
2.select the indicator menu.
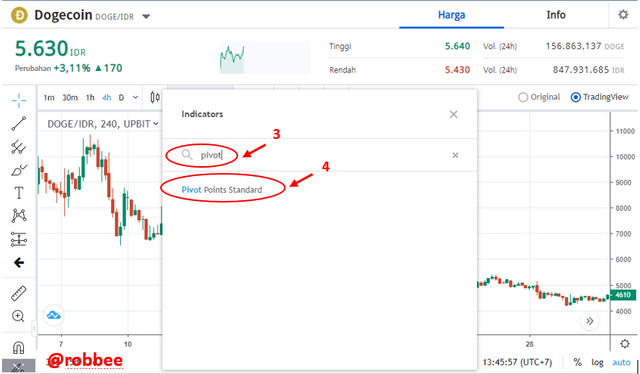
3.After selecting the indicator menu, then do a search for the pivot points indicator.
4.After finding the pivot points indicator, click on it and the display will appear.
5.before using it you should check the pivot points settings menu.
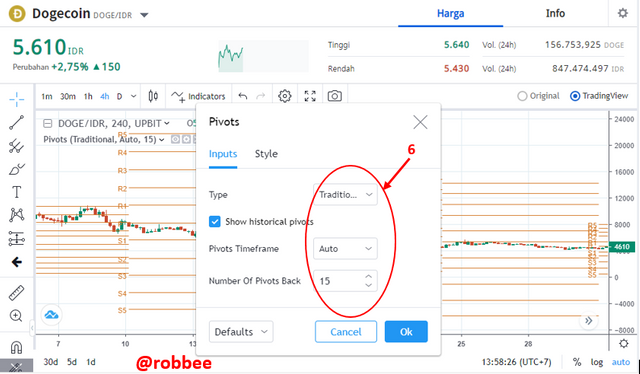
6.set the settings as you wish. I used the default settings, type is traditional, pivots timeframe is auto and number of pivots back is 15.
7.after setting the settings then finished. You can directly use the pivot points indicator.
5. How Pivot Points Work. (Screenshot with tag your name)
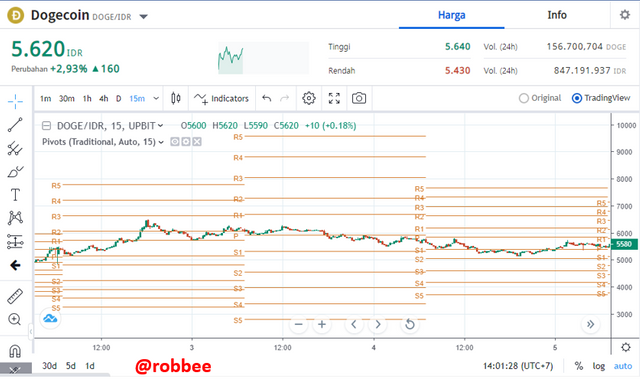
How pivot points work is to first determine pivot levels such as support and resistance levels. Which one to determine the level is to know the pivot point first. The way pivot points work is very useful and very suitable for short-term traders, and of course the profits are not too big. This pivot point is a good indicator to use in observing resistance and support signals at various levels, Pivot points tell traders that the best entry for traders is from the support signal and the best time to exit is when the resistance level is not broken.
Pivot points work when the market price is in the high, low, and close for each day and is calculated using the previous day's market price, based on observations on that day's candlesticks. For example, if you want to trade on May 21, then you need to observe the candlestick's high, low, and close on May 20. On the chart, the pivot level shows you when the market price will reverse and change direction.
6. Pivot Point Reverse Trading.
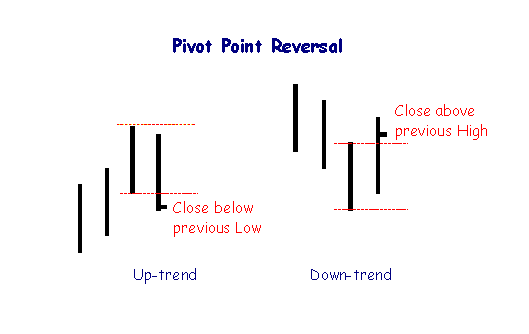
SOURCE:https://www.incrediblecharts.com/technical/pivot_point_reversal.php
Pivot Point Reverse Trading shows the correlation between price movements such as high, close low. In Pivot Reverse Trading, closing below the previous low with the highest, it occurs after an uptrend. While the close is above the previous high with the lowest low, it occurs after a downtrend.
7. What could be a common Mistakes in Trading with Pivot Points
Common mistakes in Trading with Pivot Points are:
- No knowledge of No knowledge of supply and demand
- When traders follow the pivot line at random without having any knowledge of price movements in the market
- No knowledge and references to get a high price timeframe
- Ignoring support and resistance levels
- Use only low timeframes and ignore high timeframes
- Not consistent on one strategy
8. What could be the reasons For Pivot Points is Good.(Pros/Advantages)
Pivot points are one of the most suitable indicators for use with support and resistance levels, and have their own formula for observing them directly on the chart. Then the pivot points indicator also has a fairly good price prediction level so that traders can easily predict when is the right time to take profit.
9. Apply the Pivot Points indicator in the Today chart (the day when you making this task) and set the chart for 15 minutes. Explain the market trend till the time of writing the task and how it will be next till the end of the day. You can give possibilities on both the side bearish and bullish.
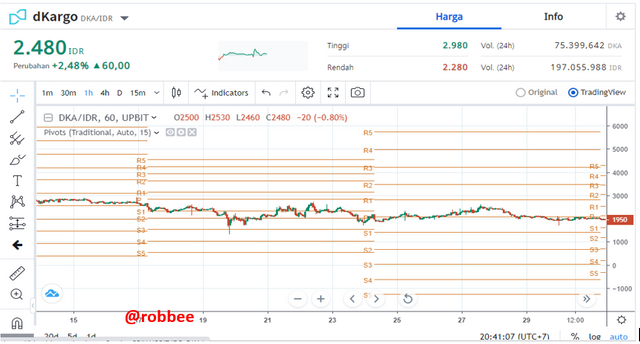
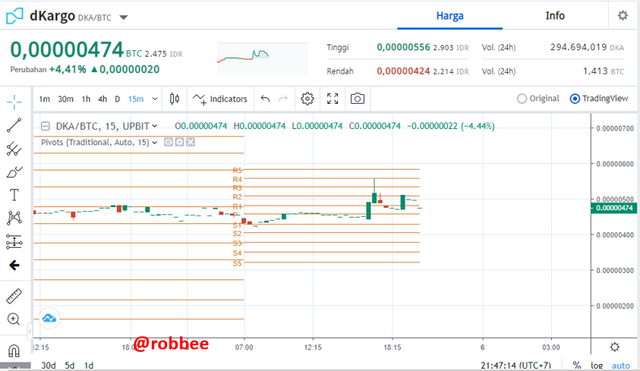
At the time I applied this chart the price of the dCargo/BTC pair was 0.00000474 BTC (5th June 2021, 21:15) which is the actual low pivot point below resistance 1. indicating the pivot point, with S1, S2, S3 S4 and S5 being below it is bearish and R1, R2, R3, R4 and R5 above it is for bullish price. In the chart, the actual high is at the average of the resistances (R2) and (R3) and is almost touching (R4) or reaching 0.00000558 BTC.
10. Weekly Price Forcast For Crypto Coin: XXXXX(Based on all previous lectures of technical studies Forcast the Weekly price for any Crypto coin, Title will be the same just replace XXXXX with the Coin name and covered all below points in it as a part of Price Prediction for the next 1 week.)
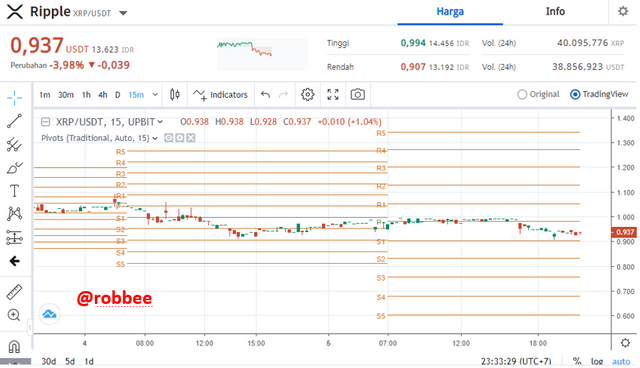
As of today June 5th at 23.30, the price of XRP/USD is $0.937 USD. I got the information from the trading volume of the last 24 hours.
My prediction about this in the next 1 week on the price of XRP/USD is to tend to S1 because the price opens below the pivot. Based on a high of 1.085, a low of 0.789 and a close of 01,085. then for the next week the price will be at R3 1.4797 USD, R2 1.2823 USD, R1 1.1837 USD, Pivot Point 0.9863 USD, S1 0.8877 USD, S2 0.6903 USD, S3 0.5917 USD.
During the week of Saturday, June 12: XRP will average at $0.8877 as the price will tend to follow the direction of S1.
The reason I use the XRP coin is because the price is quite stable, making it easier for me to analyze price movements using the pivot points indicator.
11. Conclusion.
In terms of analyzing cryptocurrency trading and technical analysis, Pivot point indicator is an excellent indicator in making accurate predictions about the best entry and exit points, determining good support and resistance levels. However, you should know that each indicator has its own advantages and disadvantages. Therefore, in addition to relying on indicators, you must also have the ability to analyze a coin.
This is everything I know about Pivot Points, I'm writing this based on some of the references I've studied.
Hi @robbee
Thank you for joining The Steemit Crypto Academy Courses and participated in the Homework Task.
Your Homework Task verification has been done by @Stream4u, hope you have enjoyed and learned something new.
Thank You.
@stream4u
Crypto Professors : Steemit Crypto Academy
#affable
Downvoting a post can decrease pending rewards and make it less visible. Common reasons:
Submit