Hello steemian ...
This is my new post in the Steemit Crypto Academy community, on this season 6 week 3, I will be working on a homework from professor @pelon53 with the theme "Support and resistance breakouts”.
we will discuss it through the homework below:

1.- Explain in detail the advantages of locating support and resistance on a chart before trading.
The advantage of finding support and resistance on the chart before trading is as a guide as well as information for us to find out the highs and lows that are difficult for the price of an asset to penetrate. By knowing this we can find out about how the continuation of the market, whether the trend will continue or there will be a price reversal.
In general, there are three advantages to finding support and resistance on a chart before trading:
help analyze and confirm trends.
This is indicated by the price breaking through one of the support or resistance limits. When the price breaks the support line, it will be confirmed as the start of a bearish trend and if the price breaks the resistance level, it will be confirmed as the start of a bullish trend.To determine when the time is right for Entry.
This is indicated by the price failing to penetrate the support limit, so when the closing price is above the support limit, then it is the right time for Entry Buy. Conversely, if the price manages to break through the support limit when the closing price is below the support limit, then it is the right time for Sell Entry.To determine when is the right time to Exit.
This is indicated by support and resistance levels which if you use the support level as an entry buy, the resistance level can be used as a reference for taking profit. And if then the price turns out to have broken through the downward support point, then you can make it a stop loss area.
2.- Explain in your own words the breakout of support and resistance, show screenshots for the breakout of a resistance, use another indicator as a filter.
When discussing breakouts, of course, we cannot ignore support and resistance. Support means the lower limit of the chart that is difficult for the price to break and resistance is the upper limit of the chart that is difficult for the price to break, and a breakout is a condition where the price breaks one of the support or resistance levels.
Breakout support is a condition where the price manages to break through the lower support point and this indicates a bearish trend will occur. On the other hand, a support breakout is a condition where the price manages to break through the upper resistance point and this indicates that a bullish trend will occur.
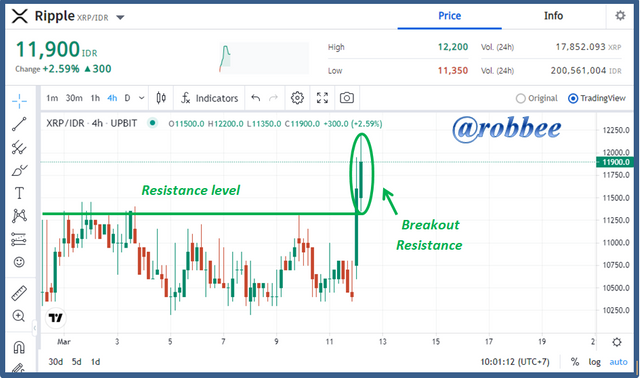
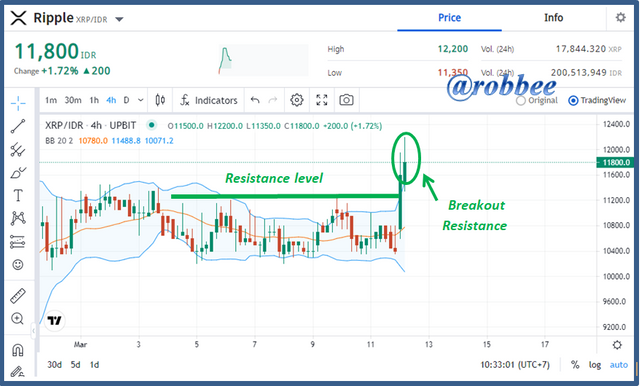
To use the indicator as a filter to identify breakout resistance, I tried to use the Bollinger Bands indicator.
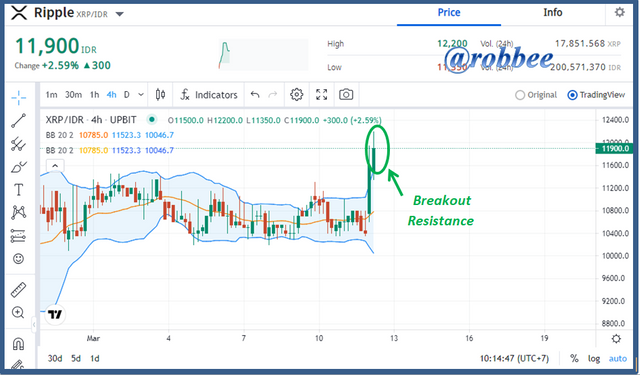
From the screenshot above, we can see that the Bollinger band filters out breakouts with candle signals coming out of the upper band. The breakout candle came out of the upper band perfectly, and this is by the philosophy of the Bollinger band indicator, namely if the candle comes out of the upper band, it is a signal to enter.
3.- Show and explain support breakout, use additional indicator as filter, show screenshots.
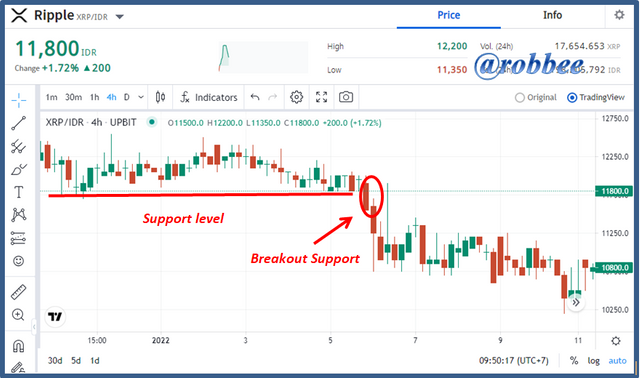
As I explained earlier Breakout support is a condition where the price manages to break through the lower support point and this indicates a bearish trend will occur. To answer this question, I will be using the XRP/IDR asset pair. In addition, I will also use an additional indicator as a filter, namely the Bollinger band indicator.
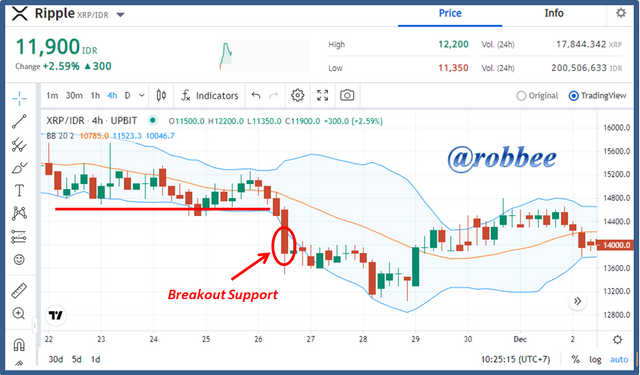
From the screenshot above, we can see that the Bollinger band filters out support breakouts with candle signals that exit the lower band. The breakout candle comes out of the lower band as a filter and this is following the philosophy of the Bollinger band indicator, namely if the candle comes out of the lower band, then it is a signal to sell.
4.- Explain what a false breakout is and how to avoid trading at that time. Show screenshots.
A false breakout occurs when the chart initially breaks out in the support or resistance area, then the chart does not continue its movement as it should and instead returns to the support and resistance area. For more details, see the image below.
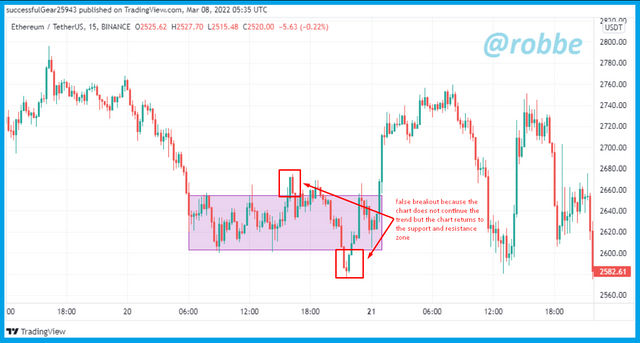
In the picture above there are two false breakouts that we can see. First, we can see that the chart has a breakout in the resistance area, which means the chart will increase, but, after a breakout in the resistance area, the chart re-enters the support and resistance zone, which means a breakout in the resistance area is a false signal. Then in the same picture, the chart had a breakout in the support area which gave us a signal that the chart would decline, but after experiencing a breakout the chart support area did not continue its decline and the chart re-entered the support and resistance zone, meaning a breakout in the support area. is a false breakout.
how to avoid False Breakout
To avoid a breakout when trading, you must have patience and not be in a hurry to enter or exit a trade. You can use the daily timeframe as a reference and tell how the tail of the chart is when the level and resistance are at their closing prices.
When a breakout occurs, do not immediately make a purchase, but you must wait for a signal at the closing price. You can buy when the signal at the closing price is above the resistance level and sell when the signal at the closing price is below the support level.
5.- On a demo account, execute a trade when there is a resistance breakout, do your analysis. Screenshots are required.
I will do this demo trade on the Upbit platform with XRP/IDR assets. In analyzing this chart I used an additional indicator to help me analyze it technically, namely the Bollinger Bands indicator.
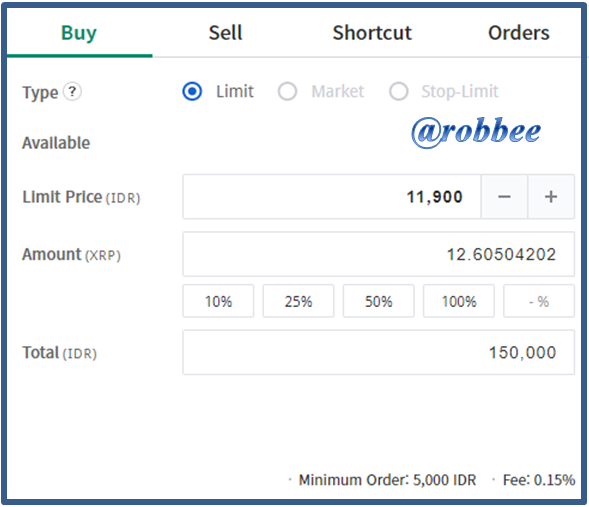
From the picture above, it can be seen that I made a demo purchase of 150,000 IDR (10.47 USD) and I got 12,605 XRP. The analysis I did was started by observing the resistance level, by seeing that the candle had a breakout past the resistance limit. After that, I tried to see the signal given by the Bollinger band indicator to confirm the signal. From observing the signal given by the Bollinger Band indicator where the candle crosses the upper band, this is confirmed as a breakout resistance and this is the right time to buy.
6.- In a demo account, execute a trade when there is a support break, do your analysis. Screenshots are required.
I will do this demo trade on the Upbit platform with MANA/IDR assets. In analyzing this chart I used an additional indicator to help me analyze it technically, namely the Bollinger Bands indicator.
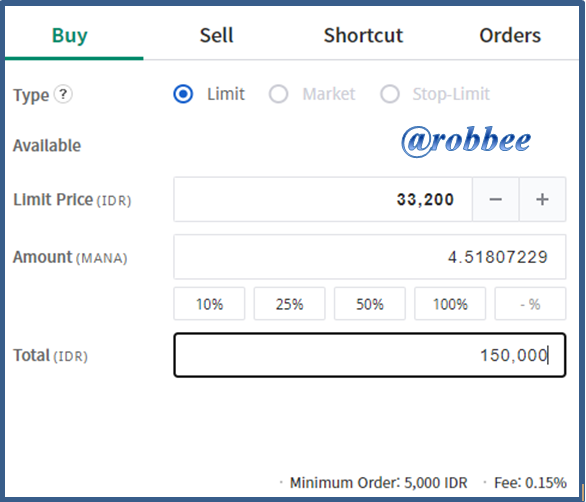
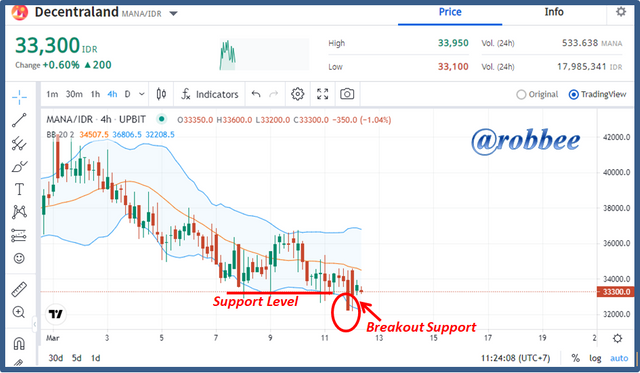
From the picture above, it can be seen that I made a demo purchase of 150,000 IDR (10.47 USD) and I got 4,518 MANA. The analysis I did was started by observing the support level, by seeing that the candle had a breakout past the support limit. After that, I tried to see the signal given by the Bollinger band indicator to confirm the signal. From observing the signal given by the Bollinger band indicator where the candle crosses the lower band, this is confirmed as a support breakout. However, this can also be indicated by a false breakout, because the price does not tend to fall after a breakout, therefore you should wait for a few more candles to confirm the downtrend.
7.- Conclusion
The advantage of finding support and resistance on the chart before trading is as a guide as well as information for us to find out the highest and lowest points that are difficult for the price of an asset to penetrate. By knowing this we can find out about how the continuation of the market, whether the trend will continue or there will be a price reversal.
Breakout as one of the signals of breaking the support and resistance points is certainly something that traders are looking forward to entering into trading. For traders, it is hoped that they will not immediately rush into purchasing because it could be a false breakout, for traders must understand that.