Hello steemian ...
This is my new post in the Steemit Crypto Academy community, on this season 4 week 5, I will be working on a homework from professor @allbert with the theme "Trading with Accumulation / Distribution (A/D) Indicator”.

we will discuss it through the homework below:

1. Explain in your own words what the A/D Indicator is and how and why it relates to volume. (Screenshots needed).
what is A/D Indicator
The A/D indicator (accumulation/distribution) is an indicator created using the comparison between the trading volume and the highest price with the close. The A/D measure will provide signals and information about how strong the trend is based on the divergence between the volume flow and the stock price.
If the A/D line goes up, it will be confirmed as an Uptrend and if the A/D line goes down, it will be confirmed as a downtrend. If there is a time when the indicator goes down, it means that the accumulation and buying volume is not strong enough to push the price up, this will be a sign that the price will decline. Conversely, if there is a moment where the indicator goes up while the price goes down, it means that the accumulation and buying volume has the power to push the price up, this will be a sign that the price will increase.
why does it have to do with volume?
This indicator is related to volume because the volume is a variable which is a multiplier whose value is something important in the basic formula of this indicator. As I explained earlier that volume is used as the basis for the concept.

2. Through some platforms, show the process of how to place the A/D Indicator (Screenshots needed).
In this question, I will explain how to use the A/D indicator on two platforms namely TradingView and Upbit.
1). TradingView
To use it on the TradingView platform, make sure you are logged in to the website https://www.tradingview.com/. Then in the main menu select the chart menu.
After the chart is displayed, it is recommended that you convert the chart to a crypto asset chart to suit this task, I took the example of BTC/USDT.
Then select the indicator menu, then look for the accumulation/distribution indicator. Then click.
After that, the indicator will appear as shown below and you can use it right away.
2). Upbit
To use it on the Upbit platform, make sure you have entered the website https://id.upbit.com/ (Upbit Indonesia).
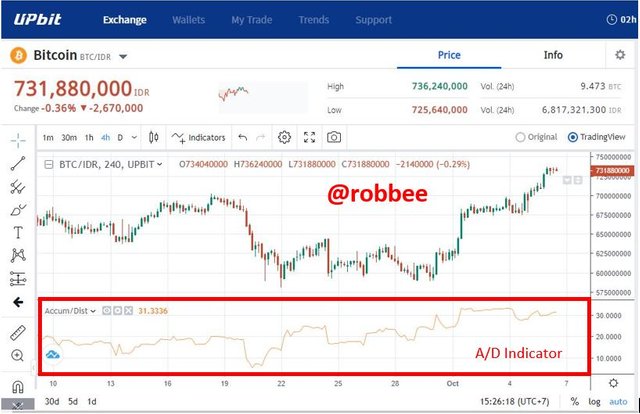
Make sure you already have an account, then in the Exchange menu select the view to be TradingView. Then you just need to look for it in the indicators menu, then look for the accumulation/distribution indicator. Then click:
After that, the indicator will appear as shown below and you can use it right away.

3. Explain through an example the formula of the A/D Indicator. (Originality will be taken into account).
the formula of the A/D indicator is as follows:
Explanation :
A/D(t) = current accumulation/distribution value
H = current highest price
L = Current lowest price
C = Closing price
Vol = Volume
A/D(t-1) = previous accumulation/distribution value
Example of formula calculation on BTC/USD coin
Is known :
H = $55,568.46
L = $53.775.58
C = $54,452.65
Vols = $39,378,648,229
A/D(t-1) = 576
Question :
A/D(t)…?
Then based on the formula
So the current accumulation/distribution of BTC coins is 581.

4. How is it possible to detect and confirm a trend through the A/D indicator? (Screenshots needed)
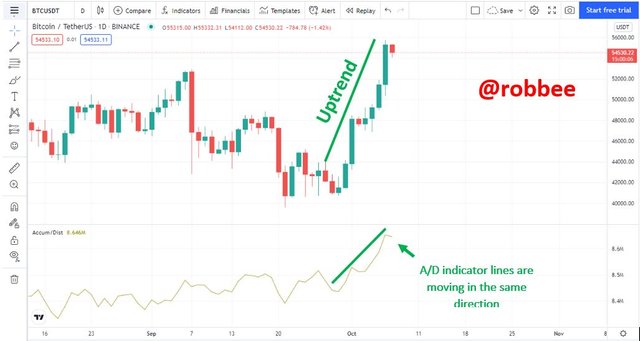
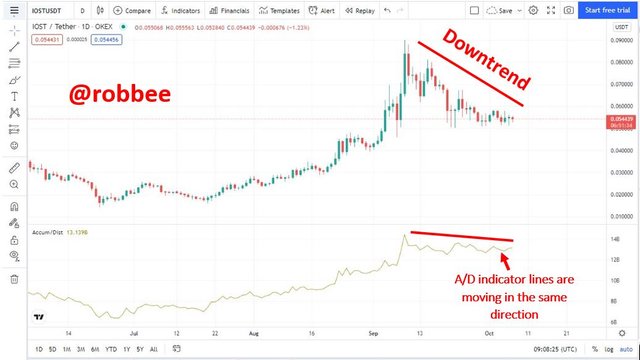
It is very simple to detect and confirm trends via the A/D indicator. the same as the movement of the candlestick. If the A/D line goes up, it will be confirmed as an Uptrend and if the A/D line goes down, it will be confirmed as a downtrend.
Example if the market is confirmed to be in an uptrend:
Based on the chart BTC/USDT At the moment there is a clear uptrend followed by the A/D indicator line moving in the uptrend direction as well. This confirms that there is an uptrend going on, in real life, this means a lot of money has gone into the asset and a lot of people are holding their asset and holding it.
Example if the market is confirmed to be in a downtrend:
Based on the IOS/Tether chart At the moment there is a clear downtrend followed by the A/D indicator line moving towards the uptrend as well. This confirms that there is a downtrend, in real life, this means a lot of money has gone out of the asset and a lot of people have sold their assets so the assets have been distributed.
Example of A/D indicator detecting the next price movement:
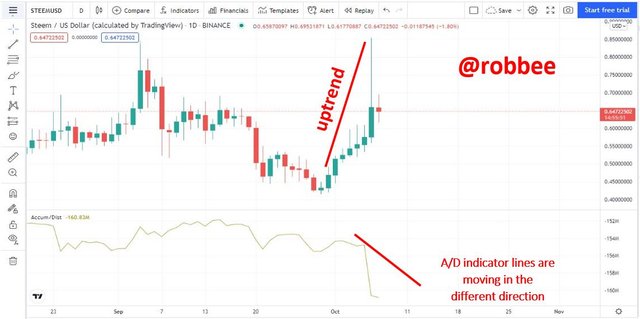
In addition to confirming the uptrend and downtrend, the A/D indicator can also detect the next price movement. If there is a moment where the indicator goes down while the price goes up, it means that the accumulation and buying volume is not strong enough to push the price up, this will be a sign that the price will decline. Conversely, if there is a moment where the indicator goes up while the price goes down, it means that the accumulation and buying volume has the power to push the price up, this will be a sign that the price will increase.
The example below is an A/D indicator that detects a signal of a price decline that will occur on the STEEM/USD asset. The price of steem shows a rising price trend, while the A/D indicator shows a decline. This means that the price of STEEM/USD will soon decline.

5. Through a DEMO account, perform one trading operation (BUY or SELL) using the A/D Indicator only. (Screenshots needed).
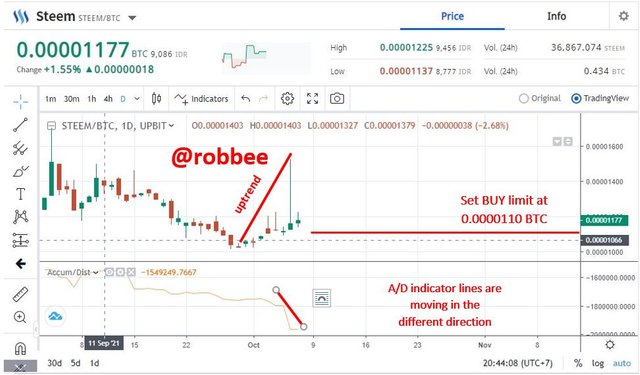
At this stage, I will carry out a BUY trading operation stage on the Upbit platform using the A/D Indicator. I made a purchase on a STEEM/BTC asset at the current price of 0.00001177 BTC.
Based on the chart above, I buy when there is a divergence of movement between the price and the lines of the A/D indicator. the price movement shows in the direction of the uptrend while the A/D indicator line shows the opposite, namely in the downward direction. This is a signal that signals that there will be a price decline or in real life, it means that the accumulation and buying volume is not strong enough to push the price up.
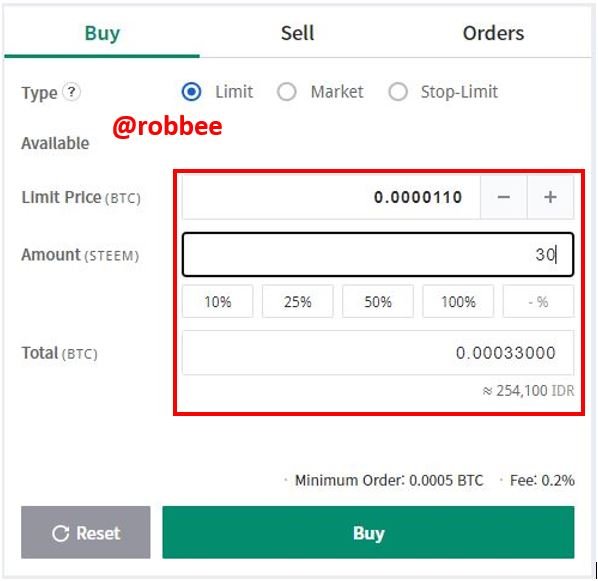
Therefore, in this situation, I also set a buy limit at the price of 0.0000110 BTC. I bought 30 STEEM for 254,100 IDR (17.9 USD).

6. What other indicator can be used in conjunction with the A/D Indicator. Justify, explain and test. (Screenshots needed).
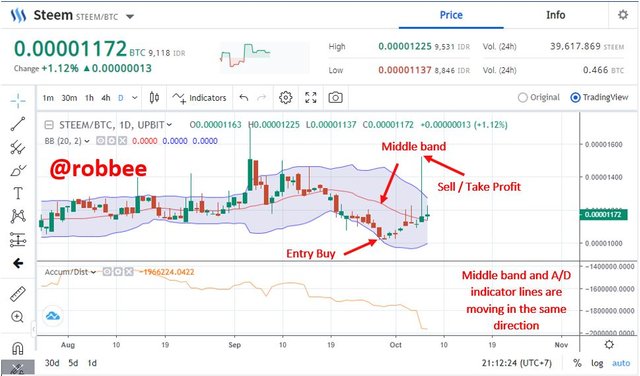
In my opinion, another indicator that can be used in conjunction with the A/D indicator is the Bollinger Bands indicator. Why is that, the answer is because the middle band on the Bollinger band shows a similar movement on the line of the A/D indicator. I have tested it on the STEEM/BTC coin, when using the A/D indicator the price moves, and the A/D indicator lines move in opposite directions. When using the Bollinger bands indicator, the middle band shows that the movement is the same as the A/D indicator lines which are both heading downwards even though the price is showing an upward movement.
This means that the A/D indicator and the Bollinger band indicator are the right combinations although not perfect because there is no 100% correct indicator. In addition, buying and selling can also be seen based on the help of Bollinger bands, namely when the price crosses the upper band and the A/D indicator also shows a downward movement and is then confirmed with a price movement line going up, this is a very accurate sell. Meanwhile, when the price crosses the lower band and the A/D indicator also shows an upward movement and is then confirmed with a downward price movement line, this is a very accurate buy.

Conclusion
A/D indicator (accumulation/distribution) is a cumulative indicator using a comparison between the trading volume and the highest price with the closing price. The A/D measure will provide signals and information about how strong the current trend is based on the identification of the divergence between the volume flow and the stock price.
The A/D indicator and the Bollinger band indicator are the right combinations although not perfect because no indicator is 100% correct. However, beginners are not advised to use this method because it is too risky. It takes experience and a strong trading base to use this method well.

Reference
https://www.forexbrokerpedia.com/id/indikator-teknikal/cara-menggunakan-indikator-accumulationdistribution/
https://id.nesrakonk.ru/accumulationdistribution/
https://id.upbit.com/
https://www.tradingview.com/




Hello @ Thank you for participating in Steemit Crypto Academy season 4 week 5.
Downvoting a post can decrease pending rewards and make it less visible. Common reasons:
Submit