Welcome guys.
I hope you're all doing very well this week. Steemit is a lovely community in general. The assignments I do on this platform is really impacting my life with vast knowledge and increasing my standard of living. In today's post, I shall talk about Introduction To The Principles Of Crypto Analysis. Professor @imagen has made extensive lecture on this topic and it was very helpful going through it. Without further talks, let's get straight to answering his questions at in his post.
Q1. What Are The Differences Between Fundamental Analysis And Technical Analysis? Which One Is Used Most Often?

The analysis of market charts and prices of assets in the cryptocurrency ecosystem is a huge component of trade for users. The ability of a trader to properly analyze details in the market are key to attaining greater profits from simple trades. In anything else, there are different strategies/principles used in analyzing market charts.
The two broad analysis techniques used in forex trading are the Fundamental Analysis and the Technical Analysis. I'm sure as Steemians these are some of the first and basic things we talk and research about in most of the blogs and assignments we do off late. Most times, one way or the other, we come across these two terms/concepts on this platform.
Differences Between Fundamental Analysis And Technical Analysis
Before we get to the differences between fundamental and technical analysis, let's be sure on the definitions of these concepts.
Fundamental Analysis:
Fundamental analysis basically refers to the process of examining, estimating and breaking down the intrinsic value of any asset/stock in the market? Intrinsic value? What does this mean?
Well, intrinsic value is more or less the monetary value, or better yet the price value of any asset. Before we can determine the trend or future trend of any stock, it is it's intrinsic value that is most needed. It gives us the real price of the stock and why it is not greater/lesser than that price. Hence, fundamental analysis is used for evaluating the intrinsic value of assets to determine whether or not the trading in these stocks will bring profit or loss in the near future.
Technical Analysis:
This type of analysis is based on the ability to use market charts or patterns, including stock prices and volume to make predictions on future market trends and identify good trading periods during the price movement.
The Differences:
Some of the many differences between fundamental and technical analysis include;
| Fundamental Analysis | Technical Analysis |
|---|---|
| Fundamental analysis is based on the intrinsic value of stock | Technical analysis is based on the price action of the stock in a market |
| Fundamental analysis does not depend on chart patterns and trends | Technical analysis employs the use of chart patterns and trends |
| Fundamental Analysis talks about thee intrinsic value of an asset | Technical analysis does not depend on the intrinsic value of an asset |
| Fundamental analysis is highly recommended for long term trading strategies | Technical analysis is preferred for shorter term trading strategies. |
| Fundamental analysis takes into account the demographics/economics of the market in which the stock is traded | Technical analysis takes into account the supply and demand of the stock irrespective of the market |
| Fundamental analysis is needed to determine whether or not the price of a stock in the market is underpriced or overpriced | Technical analysis does not determine asset prices |
| Fundamental analysis is relatively time-consuming since one needs to background research on market positions and the value of the companies involved in the same market | Technical analysis does not consume as much time as compared to fundamental analysis |
| Fundamental analysis is highly relevant in trading in unlisted companies | Technical analysis is highly employed when trading in listed companies |
| Suitable for investors | Suitable for traders |
The most often used analysis by traders actually depends on the type of trade onethe technical analysis, since we actually have more traders in the market than investors, even though investors invest more funds/stocks into the market.
Q2. Choose One Of The Following Crypto Assets And Perform A Fundamental Analysis Indicating The Objective Of The Project, Financial Metrics And On-Chain Metrics[* Cardano (ADA), Solana(SOL), Earth(MOON), Chiliz(CHZ), Polkadot(DOT)]

In this question, let's elaborate on fundamental analysis using the Solana(SOL) blockchain.
Background of Solana:
Solana Blockchain was founded in March last year by Solana Labs. Its face, Anatoly Yakovenko is the founder and CEO of Solana Labs. It's one of the fastest growing blockchain application platforms, contending with other DApps such as Ethereum. Its native token is the Sola Token (SOL), used for convenient transactions on the blockchain ecosystem. Solana is able to support over 50,000 block transactions per second, creating approximately 1 block every 400milliseconds.
The main objectives of Solana is to solve the scalability issues in the blockchain network, and ensure ease of business transactions by offering lower gas fees, safe and faster transactions per minute, and thus, prevents congestion in the market. This will make it the masters of blockchain infrastructure for modern cryptocurrency platforms.
Solana employs the use of Proof of Stake (PoS) as well as the Proof of History (PoH) consensus in its operation. This makes it possible for the network to achieve the higher speeds of transactions and avoiding market congestion. The use of PoS and PoH makes Solana a user-friendly platform for all with easier operatives.
Solana has been integrated into a vast number of DApps projects and platforms that operates in DeFi, NFTs, and Web3 applications. Some of these projects/DApps include Raydium, Serum, Audius, Phantom, etc.
Financial Metrics:
Analyzing the financial Metrics of a product/platform is key when performing fundamental analysis. In this aspect of fundamental analysis, we take into focus its circulating supply, liquidation, market capitalization, market volume, etcetera.
To better analyze these data, let use the coingecko website. As seen below, we have the various information on the analysis required of this token.
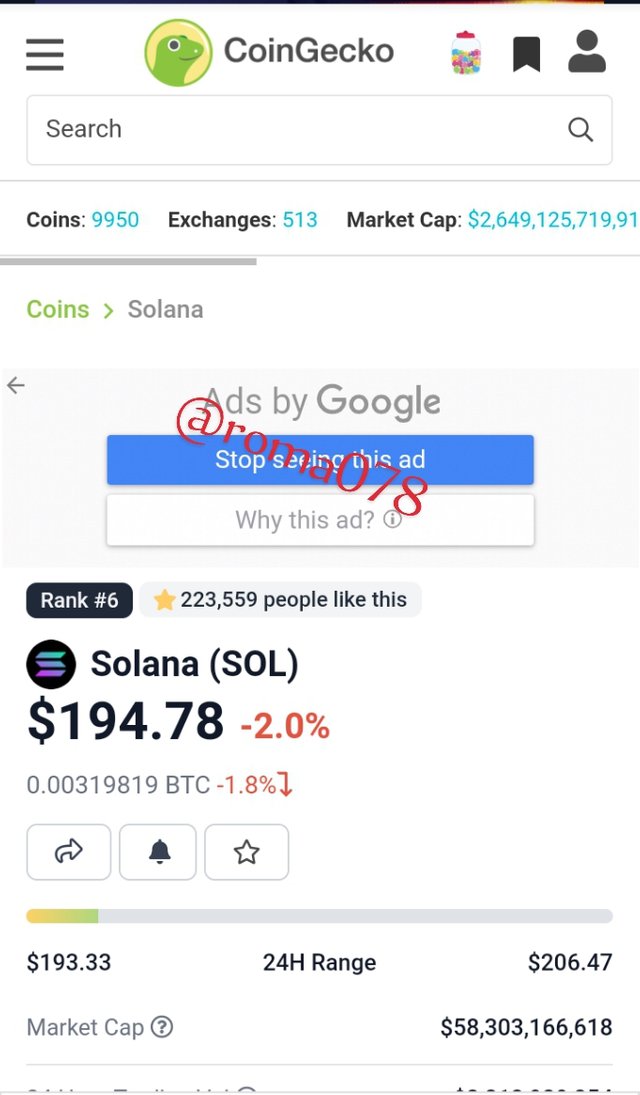
As at today, as seen above, the Solana (SOL) is ranked #6. with;
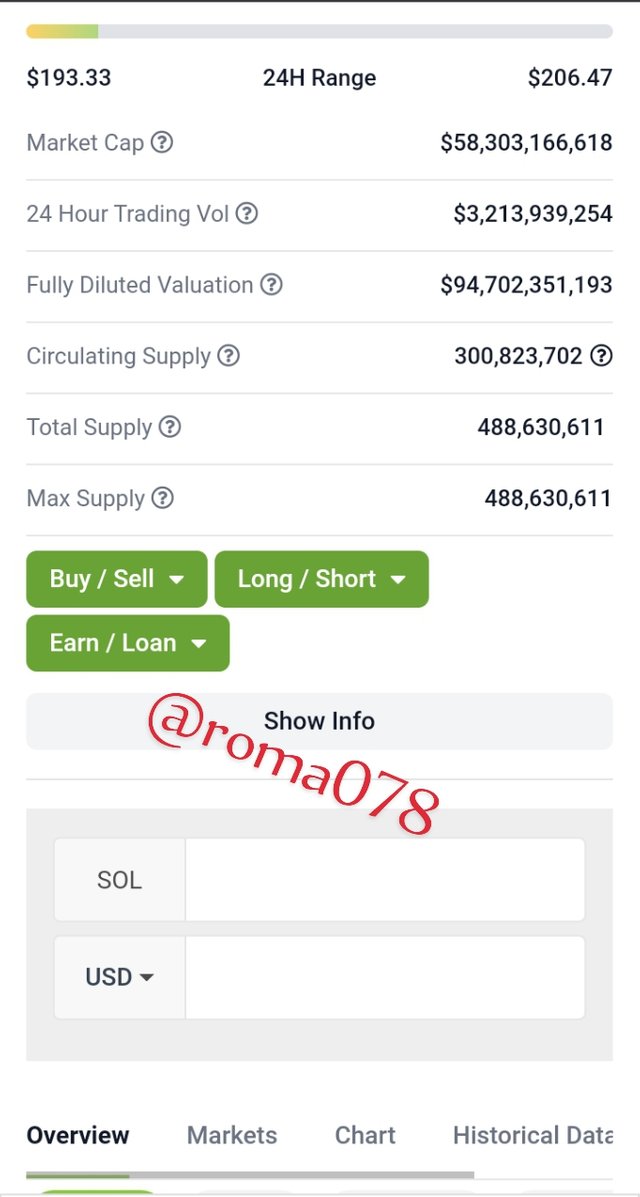
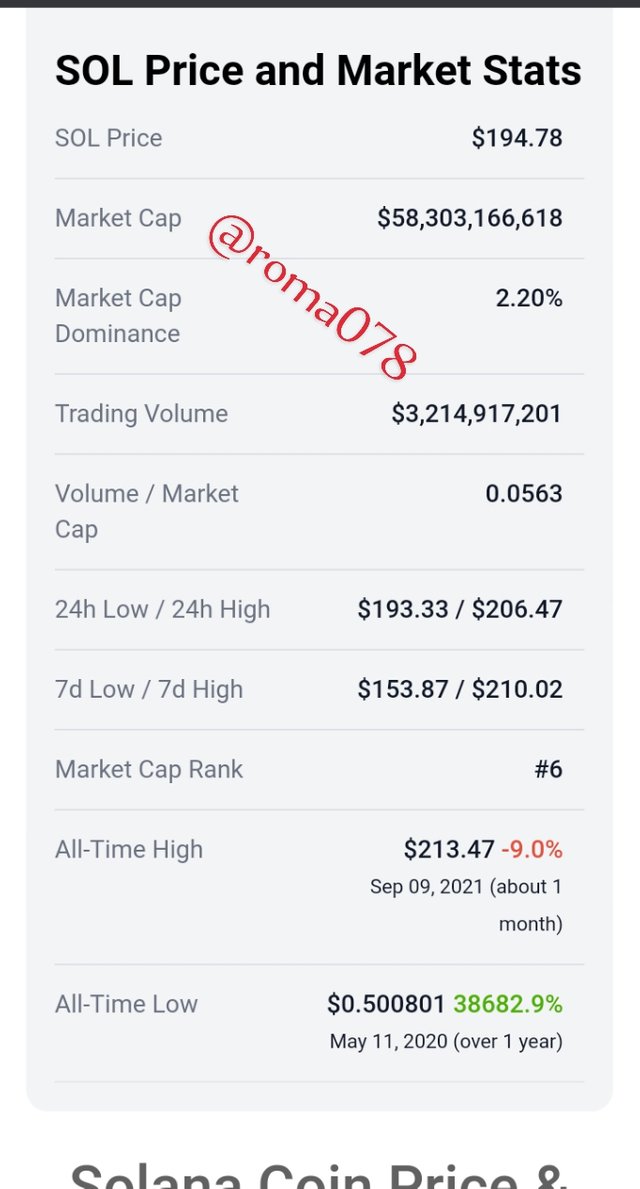
Current Price = $194.78
24H Volume = $3,213,939,254
Circulating Supply = 300,823,702 SOL
Market Cap = $58,303,166,618
Total Supply = 488,630,611
Fully Diluted Market Cap = 94,564,156,323
All-time High = $213.47 (Sep 09,2021)
All-time Low = $0.50 (May 11,2020)
Solana currently has a 24hr trading volume of $3,213,939,254 indicating a downsurge within this period.
The circulating supply of SOL is over 300 million SOL. This value indicates the total amount of the Solana coin in the market for trade by the general public.
The Market Cap indicates the actual monetary status of Solana circulating supply in the market. It is calculated by multiplying the current price and the circulating supply. Hence, the current market cap of SOL is $58,303,166,618.
Solana has an inflation rate of about 8%, indicating that this rate will decrease by about 15% year-on-year(YOY). This will mean that even at higher prices, SOL will not lose its market cap, hence, making it a good investment option.
On-Chain Metrics
To analyze the On-Chain metrics of Solana, I'll be using the Solana block explorer. The image below shows the homepage of the site.
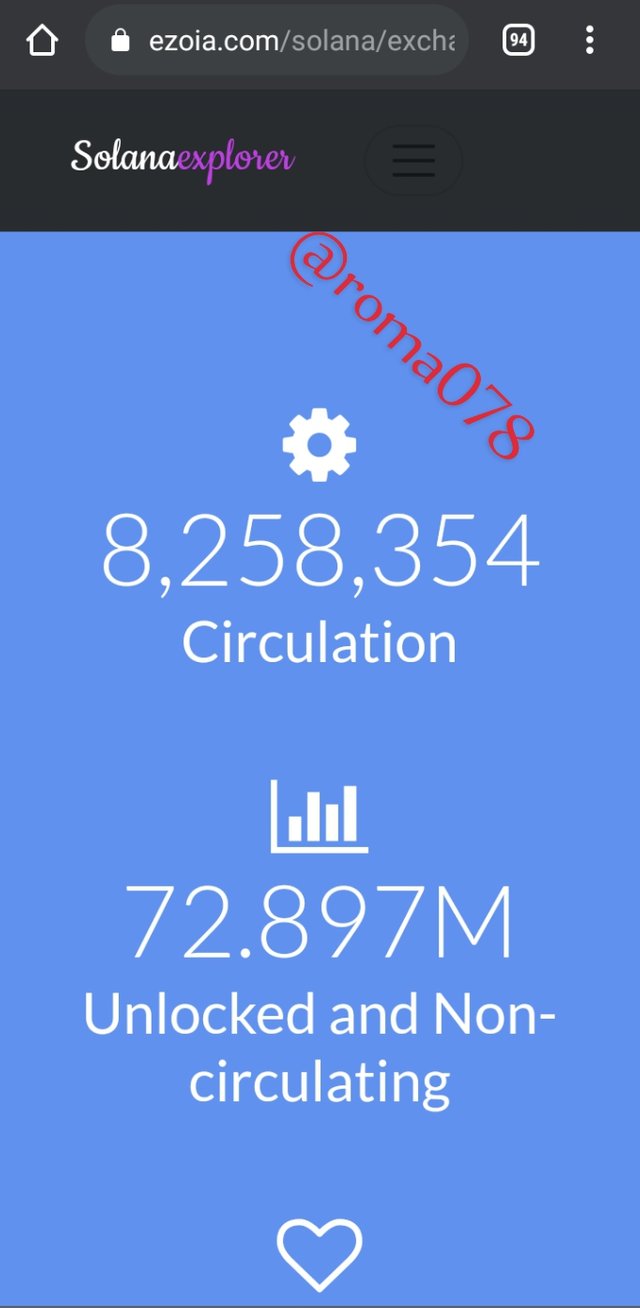
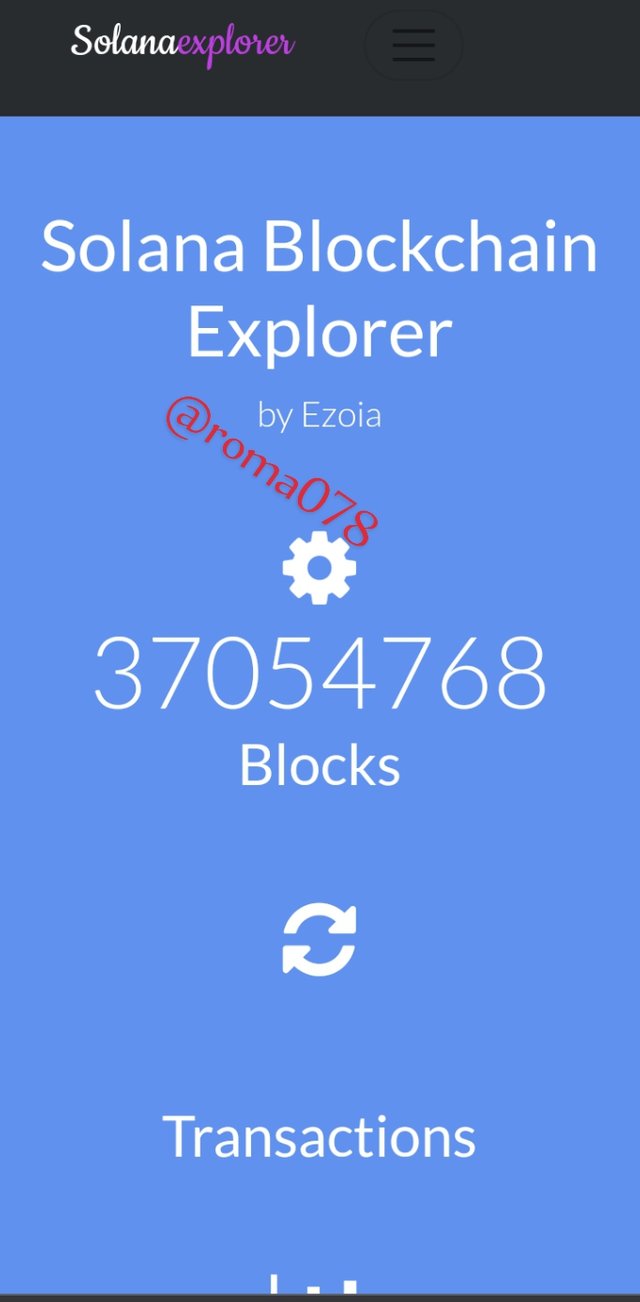
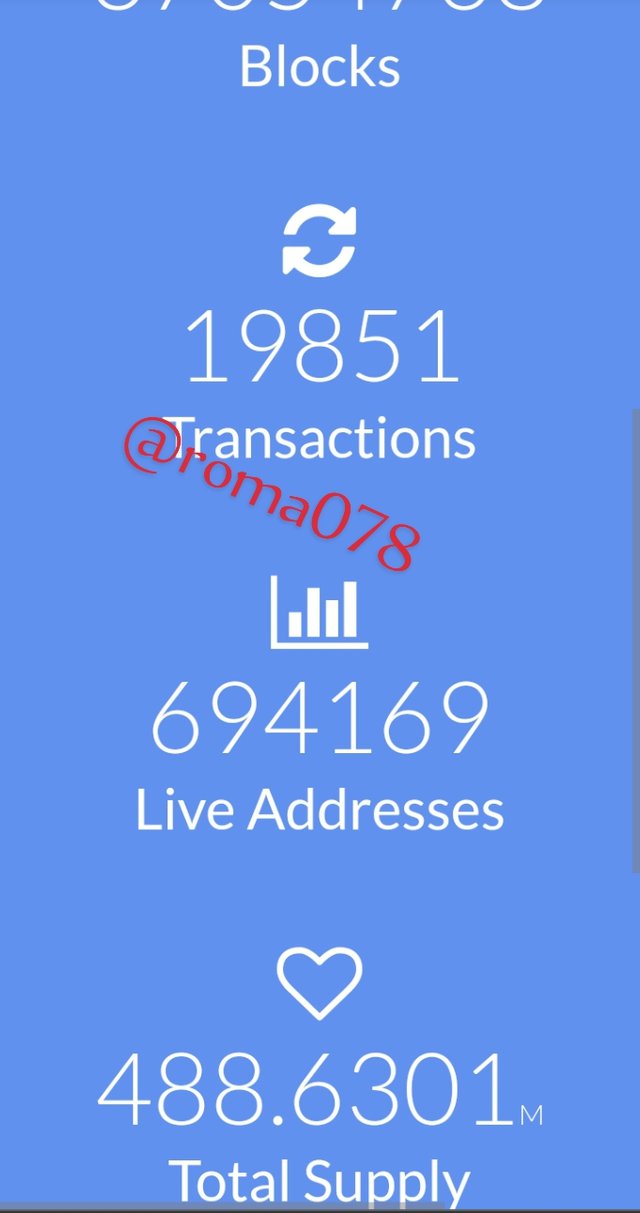
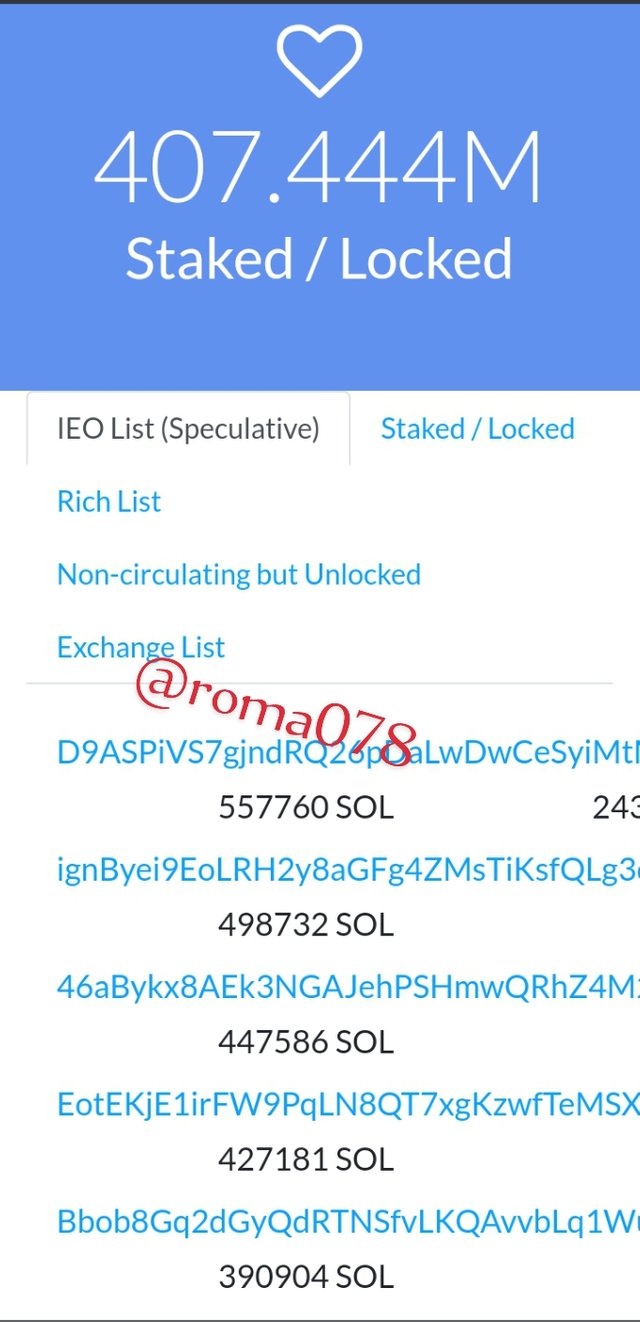
The future of Solana is key to every crypto trader/enthusiast. The image above displays that the total number of blocks as at the time of writing this post is 37,054,768. Also, the total amount of SOL tokens that have been released as at this time was about 72.9 million SOL and counting. As at the time, there was a total of 407.444 million staked coins of the total issuance.
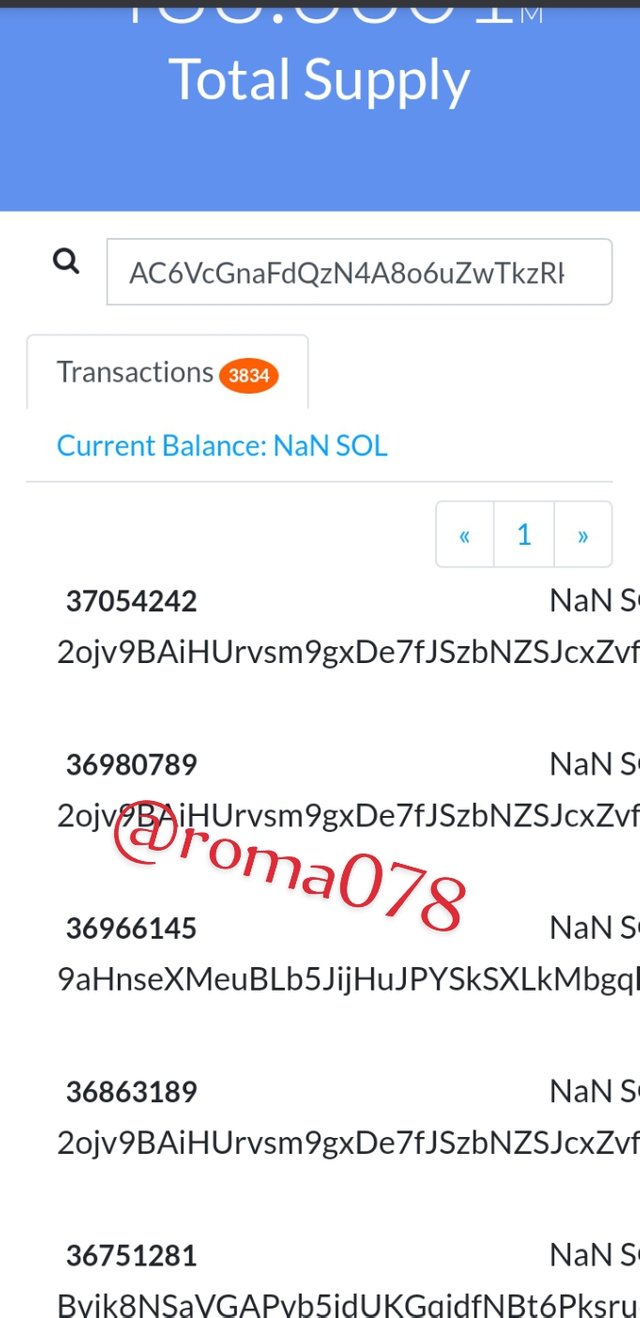
Below, we can see the details of the most recent block transaction, including it's address.
Q3. Make A Purchase From Your Verified Account Of At least 10 USD Of The Currency Selected In The Previous Point. Describe The Process(Show Screenshots):

For this activity, let's purchase the SOL token using my USDT fund since there's some asset of it in my account.
First of all, I log into my verified Binance account as shown in the image below
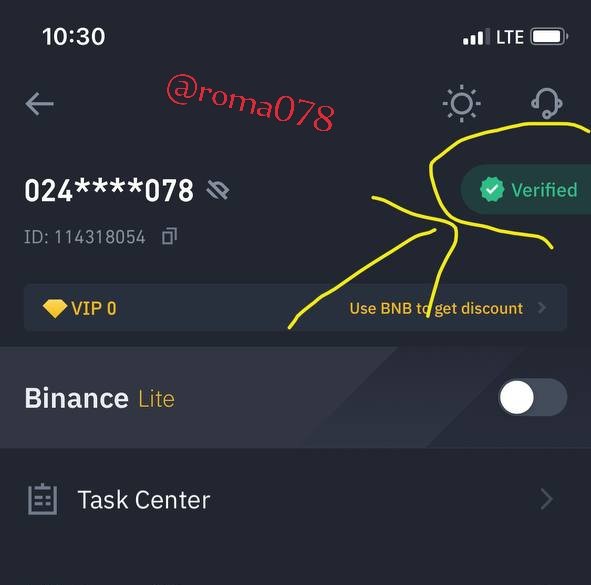
Screenshots from Binance App Next, I click on the Trades option on the bottom of my screen
A pop out window appears, showing trade options. From the search bar, I select my preferred asset pair that I wish to do my transaction with. ie; SOL/USDT
Next, I simply click on "Buy" order, to trade a $11 USDT for a $40 SOL token as seen in the screenshot below.
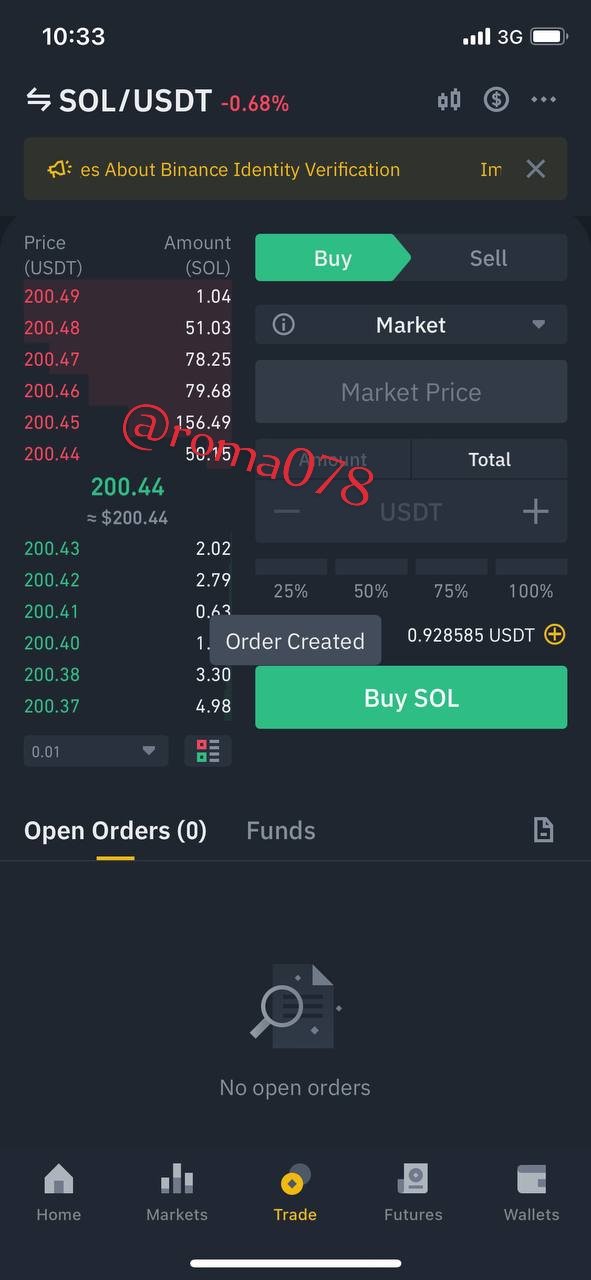
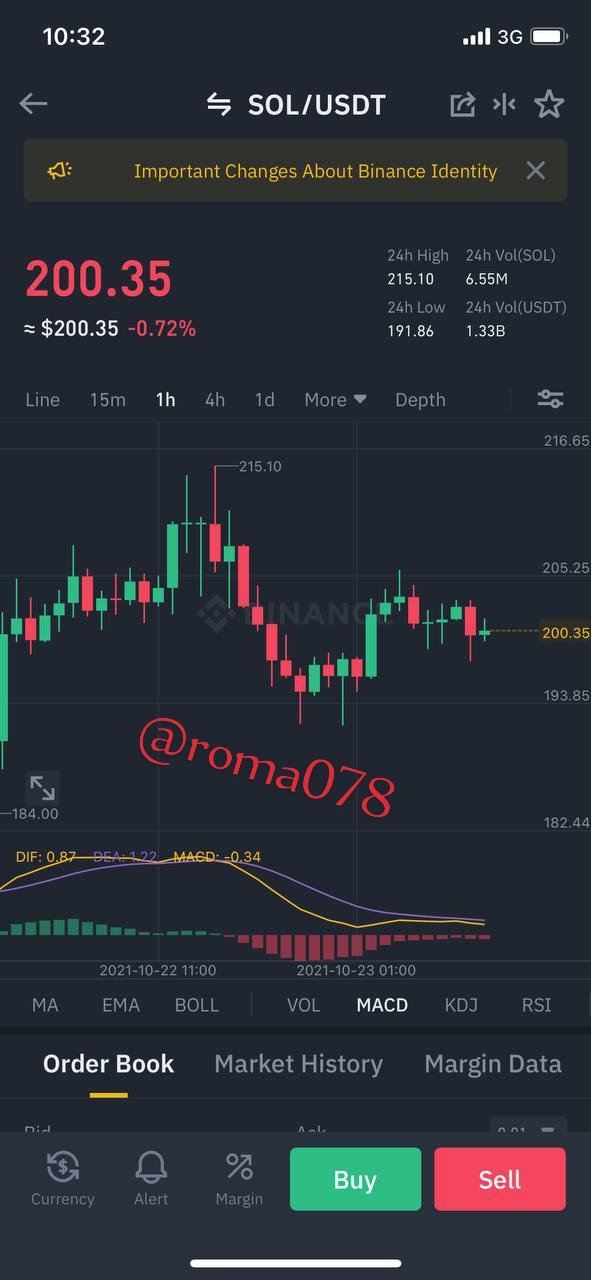
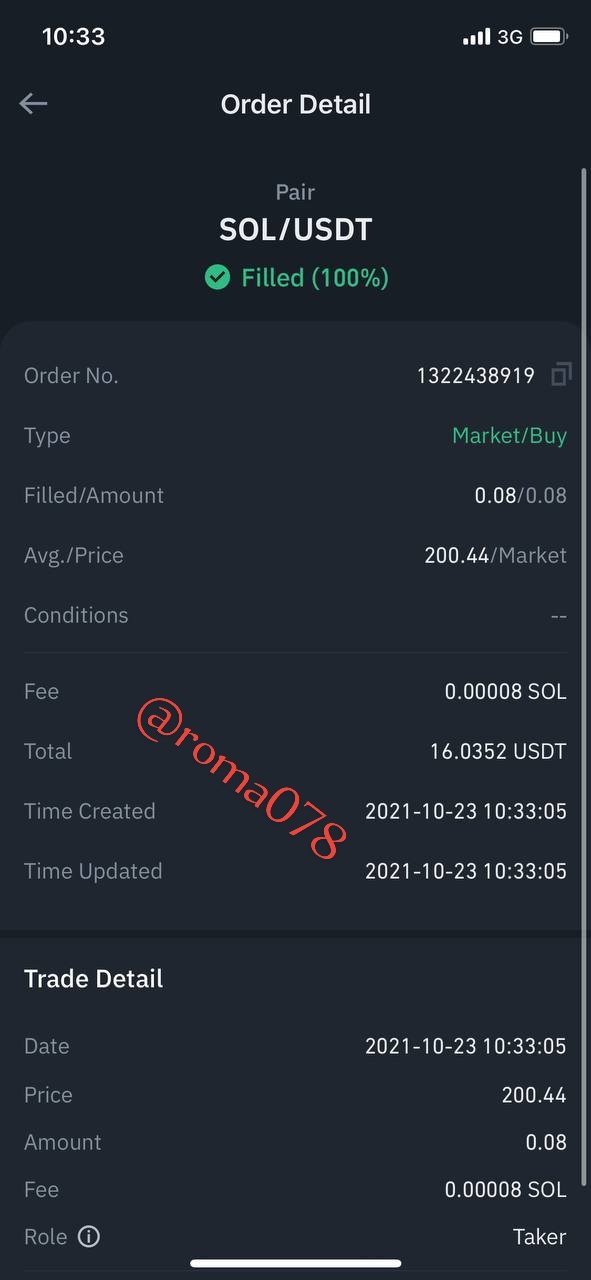
- I confirm my trade order and transaction by visiting the details of my transaction process. As seen below, the details include the date, fee, Average price, Role, etc.
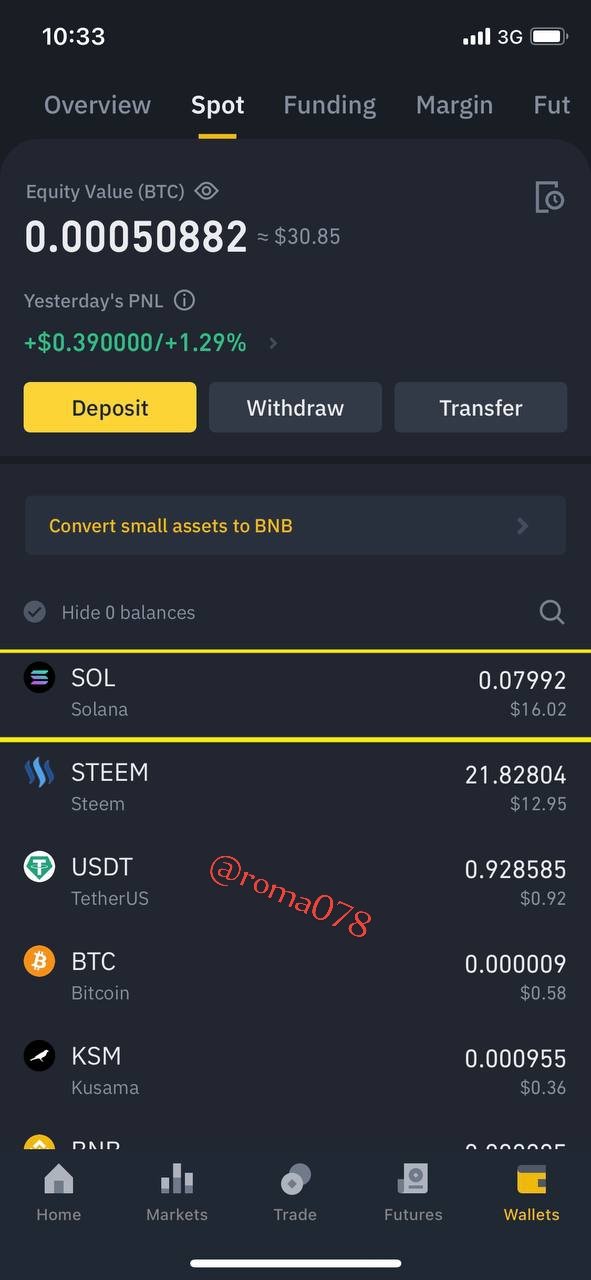
Q4. Apply Fibonacci Retracements To The Previously Selected Asset With A 4HR Timeframe On The Platform Of Your Choice. Observe The Evolution Of the Price At 24 And 48 Hours. Did It Go Up Or Down In Value? Look To Identify Resistance And Support Levels. (Show Screenshots At 0, 24 And 48 Hours Of Purchase Where The Date And Time Are Observed):

To achieve this task, let's use the Tradingview platform. I choose this platform because I'm used to it, it's user-friendly, and simple to explain with. On the charts homepage, I select my preferences, including the SOL/USDT pair I'm going to work with, I set the timeframe to a 4H own as shown in the screenshot below: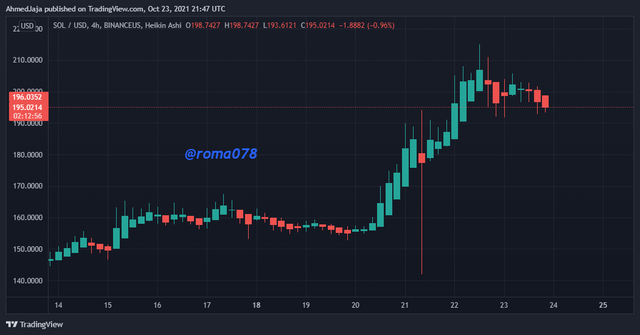
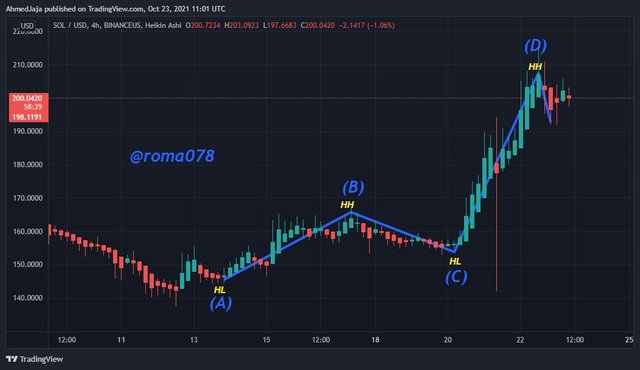
From the chart image below, we can clearly see the trend of the prices as the candles continue to move in a bullish pattern. The prices continue to make higher highs and higher lows. Bullish trends are characterized by higher highs and higher lows, as indicated in the image.
If it were a bearish trend, we'd have noticed a series of lower lows and lower highs too.
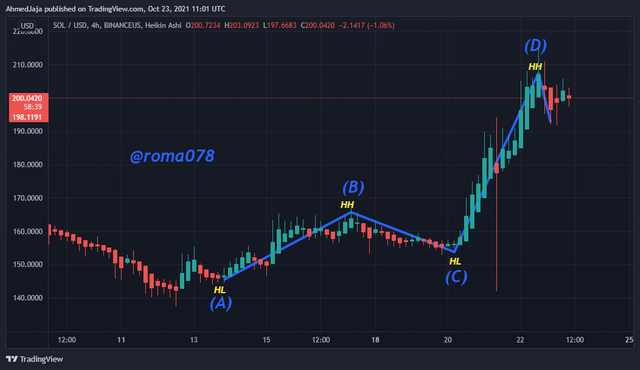
After establishing the trend of the current chart to be bullish, I can easily add the Fibonacci Retracement to my chart from the tools section.
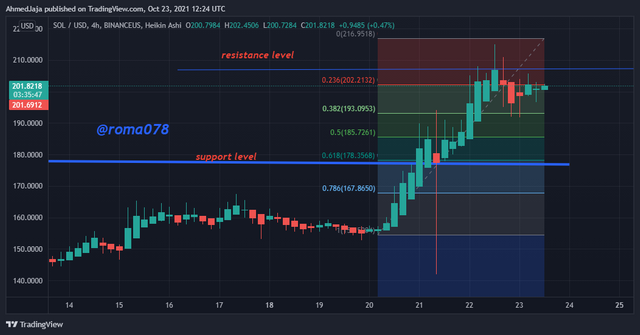
To do so, we start by applying the retracement line to the recent higher low, then extend it to the most recent higher high. In this case, I start from the point C to point D as illustrated below.
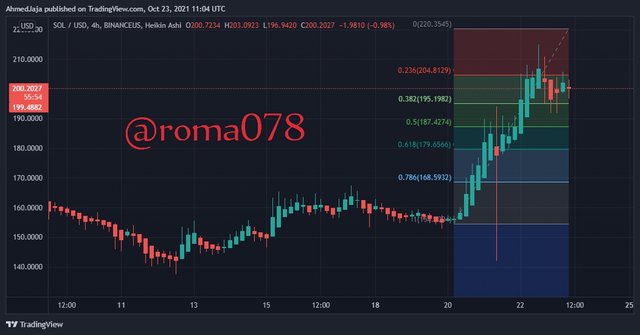
The current price of the asset is $202.072 having decreased from about $206.517 in the last 24Hrs. The support is seen at the 178.303 mark, whereas my resistance line is. set at 207.1. The price has been seen to increase from $184.873 from 48hrs ago.
Q5. What Are Bollinger Bands? How Do They Apply To Crypto Technical Analysis? With Which Other Tool Or Indicator Do You Combine Bollinger Bands To Analyze A Crypto? Justify Your Answer.

Bollinger bands are one of the many technical analysis trading tools used in determining and analyzing price trends in a crypto market. This tool was created in the 1980s by John Bollinger and has become one of the most majorly used technical indicators in the globe. It can be applied to charts of short timeframes, to long term trading periods.
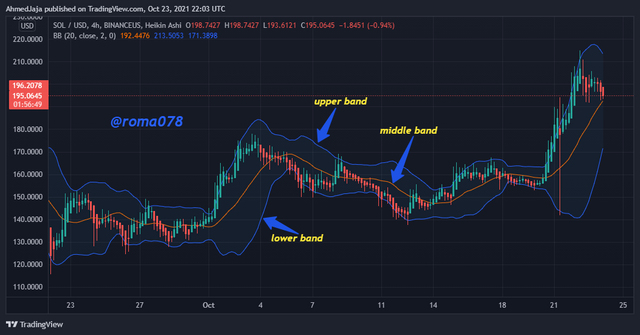
Bollinger bands are made up of three lines, an upper band, a lower band and a simple moving average as the middle line. These band line help identify areas of oversold and overbought signals during price movements.
The middle line is known as the mean band, with the lower and upper bands serving as the negative and positive deviations from the mean band. The default standard deviation used in the indicator is plus or minus 2, with a period of 20. By convention, the upper band indicates high prices while the lower band indicates low prices
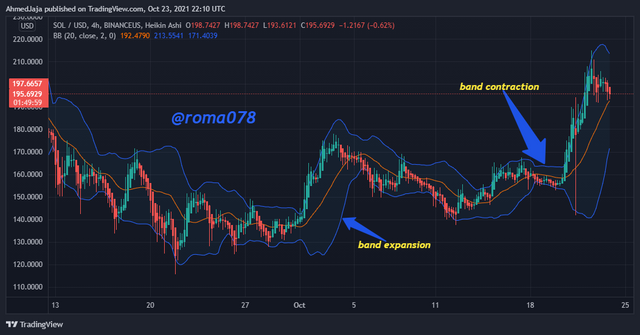
The bands also show the volatility of the market at any given time by contracting and expanding periodically. When the bands expand and are seen to be more distant from each other, it indicates there's high volatility in the market. We refer to such markets as loud markets. Contrarily, when the bands contract and are seen to be more close to each other, it indicates very low volatility. We refer to such markets as quiet markets.
How To Apply Bollinger Bands To Crypto Technical Analysis is not quite cumbersome. For example, Bollinger bands somewhat indicates patterns of overbought and oversold signals. In this way, it's easy for traders to identify good buy and sell signals from oversold and overbought regions respectively.
Also, since the Bollinger bands help to identify loud and quiet markets, it is also a big signal for trade options. For example, when the bands identify loud markets, it gives a good signal for investors and traders to perform trade. However also, when the market is quiet, it indicates it's not good time for trading, hence traders and investors hold back their trade for now.
The ability of Bollinger bands to predict the volatility of a market allows technical analysts to easily identify fluctuating chart patterns in the movement of prices in the market. This serves as a good step for traders to predict the trend of prices of assets, hence, make well informed decisions for maximum trade profits.
With Which Other Tool Or Indicator Do You Combine Bollinger Bands To Analyze A Crypto?
To really get the best of using Bollinger bands, it is usually advisable to apply it together with other technical analysis indicators. And so it really depends on the trader as to his/her choice of indicator tool they'll use when working with BBs. For us, let's combine the RSI indicator with the Bollinger Bands to explain.
The RSI indicator is a very good indicator used in technical analysis as well. It is a form of oscillator, that fluctuates during price movements to indicate past trends and possible future trends.
It ranges between the values of 0 and 100. It is used to also show specifically areas of overbought and oversold margins. When the Indicator line moves above the 70 point mark (ie between 70-100), it implies an overbought position. Thus, one can input a sell order.
Likewise, when the indicator line moves below the 30 point mark ( ie between 30 and 0), it depicts an oversold region. Thus, one can input a buy order.
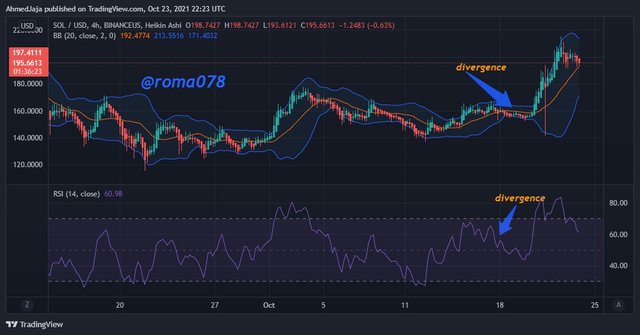
RSI also shows divergence during price movements in a market. For example, the dictator line may be moving in an opposite direction compared to the actual price movement in the chart as shown in the image below. This typically is referred to as a divergence.(bullish or bearish divergence depending on the direction of trend).
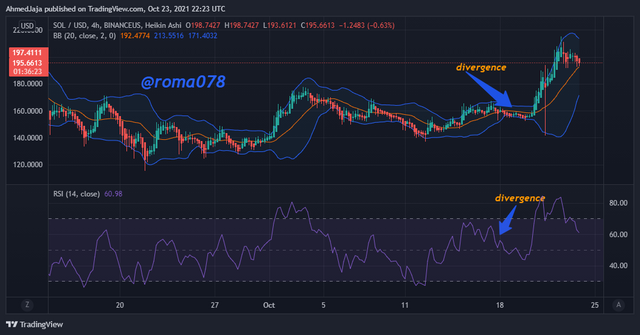
When we combine Bollinger bands with RSI indicator, we easily filter out certain market noises that may be misleading.
For example, when we apply the BB to a chart and the prices correspond to the lower band line, traders are tempted to input a buy order and take profit when the prices touch at the middle band line. The same manner, when the prices co-inside with the upper band line, traders are tempted to input a sell order and and take profit when the prices touch with the middle band line.
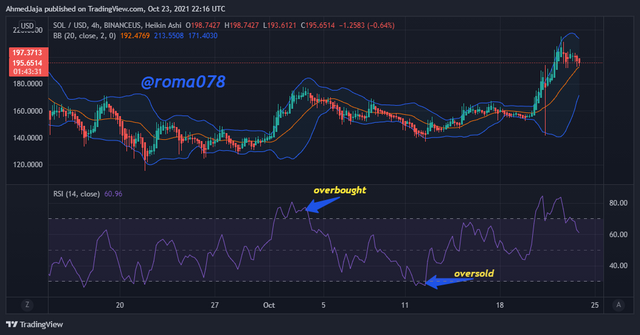
This is confirmed when we apply the rsi indicator to the same chart. We can see as the indicator line moves below the 30 point mark at the portion where the prices touch the lower band, indicating an oversold signal. In like manner, we can the rsi indicator line move above the 70 point mark at the portion where the prices touch with the upper band, indicating an overbought signal.
Understanding the basics of Crypto Analysis is very key to becoming a successful analyst and crypto trader. The two main principles of crypto analysis are the Fundamental and Technical Analysis. These are two different concepts when it comes to analysis of crypto. However, they both aim to provide one common thing to everybody in the crypto world. ie, to bring easy and successful trade ideas for maximizing profits and returns. Being able to understand the intrinsic stock value, as well as the trend pattern of an asset in any market is a pretty great advantage for traders and investors at large. These analysis strategies and indicator tools are what we use in our everyday crypto life.
This was a very interesting topic especially for me. I've been able to really understand some of the basic differences between fundamental analysis and technical analysis and how they apply to every stock market. I enjoyed writing on this assigment and I do hope to come your way next time. Until then, have a very wonderful time my Cryptogeeks.
Gracias por participar en la Cuarta Temporada de la Steemit Crypto Academy.
Continua esforzandote, espero seguir corrigiendo tus asignaciones.
Downvoting a post can decrease pending rewards and make it less visible. Common reasons:
Submit