Greetings everyone and welcome to my homework post for professor @reminiscence01.
Crypto Trading with Price Action


Price action is made up of two words namely price and action. So in the simplest of terms, price action can be seen as the action or movement of the price of an asset plotted on a chart over a period of time.
Price action is known as the basis of technical analysis because technical analysis is all about using the past prices and how they moved to be able to predict the future prices.
In order to fully understand price action and use it to plan a trading strategy, traders often use chart settings such as the candlestick chart, bar chart, line chart etc and other tools used in charts.
When chart analysis is performed on price action, we identify trends and patterns, which if followed and interpreted we'll could help us to be able to predict the future movements of the price of an asset.
Price action strategy can be used on it's own when trading or it can be combined with other strategies in order to find the best entry and exit points to trade. So it depends on the preference of the trader.


Importance of Price Action
- It is simple to comprehend and use. Price action does not require some complex analysis or complex technical indicators and others. This makes it easy for a beginner to grasp and focus solely on the price movements.
- It is easy to detect the signals generated by price action.
- It is important because it proves timeframes of trading charts to be very useful. Longer timeframes have more data which will generate more reliable signals.
- There is no lagging or leading when it comes to price action. All the prices are current and as such, the signals are also current. This allows you to trade more effectively and make consistent profits.
- It allows for flexibility in trading.
As good as price action is, I will personally like to use other technical analysis tools such as chart patterns and indicators to help confirm the signals.
This is because, I might interpret what the price is telling me wrongly and thus, it wouldn't hurt to be extra certain.
So I will not completely choose a different technical analysis tool over price action. Rather, I will use it and other preferred tools to work simultaneously in my favour.


The Japanese candlestick chart refers to a type of trading chart where the price is given by candles against time. The candlesticks which make up the candlestick chart is made up of a body and two wicks hence the name.
The candle shows four prices; the high, the low, the open and the close price. There are two candles.
- You have the bearish candle which on most charts is red which has the open price at the top of the body and the close price at the bottom of the body.
- Then there's the bullish candle which has the open price at the bottom of the body and the close price at the top of the body.
Importance of Japanese Candlestick Chart
- They allow traders to observe and understand the current market state just by looking at the colour and length of the candles.
- One can easily know the markets direction with this chart.
- It allows us to identify patterns formed by the prices more easily.
- It provides more information and details which allow traders to make certain trading decisions.
- They can be adjusted based on timeframes to provide short term traders and long term traders the appropriate amount of information they need.
It should be noted that the Japanese candlestick chart is not the only chart that can be used to analyse price action. There are others such as the bar chart, line chart, hollow chart etc. My personal preference however is the Japanese candlestick chart. I will not prefer any other chart to it.
This is because it gives the most information about the price movements. Also, one can easily identify patterns with this type if chart which is the reason why candlestick patterns are the most popular patterns used in trading.


When we hear the term multi-timeframe analysis, what comes to mind is that we are analysing something in more than one timeframe.
We know that price charts show us information about the price movement within a period of time. This period of time is what we refer to as the timeframe. Timeframes can be in seconds, minutes, hours, days, weeks, months and even years. So the smaller the timeframe, the more microscopic we get to see the changes in price.
So multi-timeframe analysis is simply going to be the process of analysing the price movements of an asset using more than one time frame. But why bother use more than one timeframe? We will see why below.
Importance of Multi-timeframe Analysis
- It helps traders know and filter out false signals. For example, a short timeframe chart might tell the trader to buy but looking at it in a wider timeframe chart, you might see that that was just a fluke and the market is still bearish.
- More precise and accurate entry and a bit points can be made on shorter timeframe charts than on longer timeframe charts.
- Trends can be easily identified on longer timeframe charts than on shorter ones. This helps you know the market's direction.
- Greater profits can be made on longer timeframes than shorter timeframes because you'll be able to allow the trend play out.
- You may miss important levels of support and resistance that might not be t be on your timeframe but are near your trade.


I am going to show this using the ADA/USDT trading pair chart. And the different timeframes I will use will be for 1 day, 4 hours and 30 minutes.
1 day timeframe
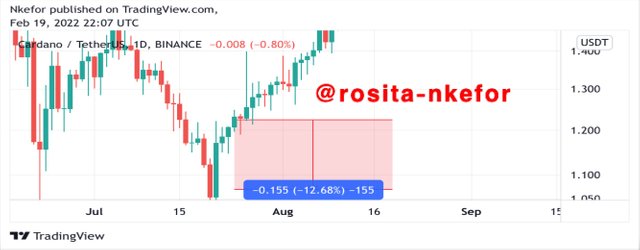
On this timeframe, a good entry point will be at the fourth bullish candle. The stop loss here was placed just a little bit above our support level. This gave us a stop loss of 12.68%.
4 hours timeframe
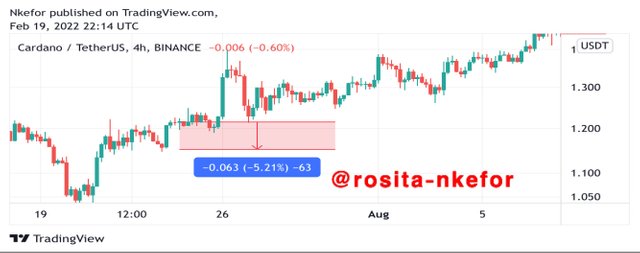
On the 4 hour timeframe, we see that the bullish trend on the daily chart is made up of small bearish moves within.
We now bring our entry point to the third candle after the long bullish candle. Our area has reduced which reduces our support level. Putting the stop loss around the support level gives us a stop loss of 5.21%. This stop loss is narrower than that for the 1 day timeframe.
30 minutes timeframe
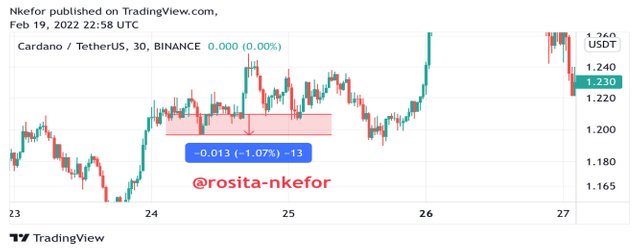
Reducing the timeframe to 30 minutes brings out many more candles as can be seen above. The entry point can be made more precisely at the bearish candle shortly after the previous candles which came at the end of the trend.
The stop loss here is made based on the support level we have. We see that it is at 1.07% which is way smaller compared to the other timeframes.
So when trying to get a tighter stop loss, use a shorter timeframe so as to get it and to also find a more precise entry point.


I am going to perform this multi-timeframe analysis on the ADA/USDT crypto pair. First, I load the chart in the daily timeframe.
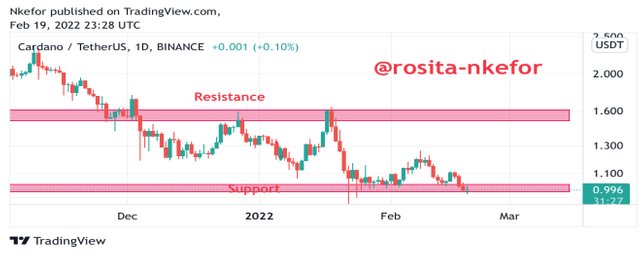
From the timeframe, I understand that the market is a downtrend. Now in order to find a good entry point, I go down to the 4 hour timeframe.
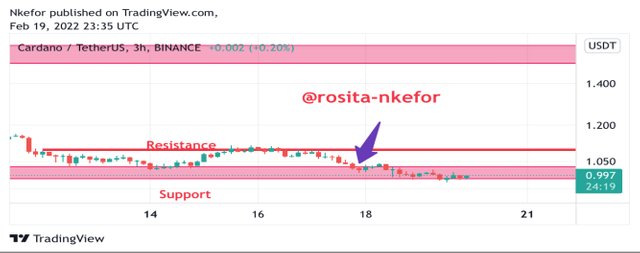
From this shorter timeframe, the best entry will be made after the hammer candle appeared. The support level remains the same but the resistance level has gone down a bit.
If we make our entry level here, the stop loss will be smaller than that in the 1 day timeframe. Now let us go further down to a 30 minute timeframe.
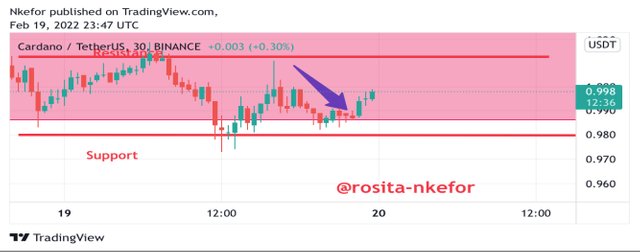
We see here that we have moved towards the initial support of the 1 day timeframe. The stop loss is way tighter here and we have a better entry after the hammer candle.
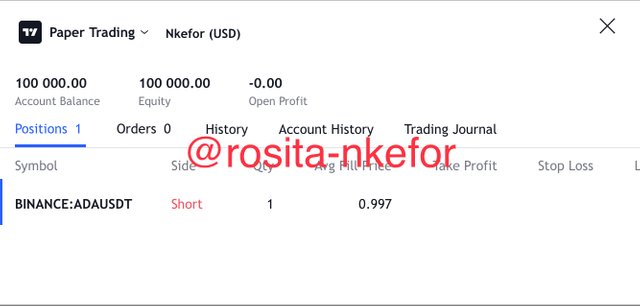
So now, I can go ahead to place my sell order.
Conclusion
When trading, it is good to use multi-timeframe analysis so as to get a more precise entry /exit point and get a tighter stop loss. This allows us to see things long term, but to be precise in our actions.
From this home work task, I was able to understand and use multi-timeframe analysis to place trades.
Thank you for reading.