Greetings dear students and professors. I am happy to present my homework post on the topic lectured by professor @imagen.

Introduction to the Principles of Crypto Analysis by @rosita-nkefor

1. What are the differences between fundamental analysis and technical analysis? Which one is most used?

Beginning with a brief definition of the technical and the fundamental analysis, we see that the fundamental analysis is the analysis of cryptocurrencies based on factors which impact the asset prices which include; industry, management processes, financial statements among others.
The technical then is the usage of tools such as indicators, trendlines, support and resistance lines, price action to gauge the future trend or movement of the prices of a particular asset based on the past patterns and movements of that asset. It takes into consideration the history to predict the future.
Now explaining the differences; I will list them as shown below;
The fundamental analysis takes into consideration the concept of return on an asset and also the return on equity while in the technical analysis, the analysis uses the concept of price data and dow theory.
Talking now about the previous and present data, the fundamental analysis focuses more previous data and also present data while we see the technical analysis to focus more on and solely on the previous data.
Going now to investment related and trading related function, the fundamental analysis uses the investment related function while the technical analysis uses the solely the trading related function.
We can use the fundamental analysis to invest in an asset for the long term basis, while the technical analysis can be used for the shorter and quick profit making.
The technical analysis is the most analysis I can say is in use, as many traders engage in making quick profits off from trading rather than simply investing. And the proper analysis for such is the technical analysis which uses the previous price movements to predict the future price movements.

2. Choose one of the following crypto assets and perform a fundamental analysis indicating the objective of the project, financial metric and on-chain metrics. Cardano, Solana, terra, chilliz, polkadot

Chilliz
The chilliz is known to be a token for the sport and entertainment club being the Malta-based fintech provider. The chilliz token operates on the socios Blockchain, and we know how the socios.com allows and enable users in the participation of the governance of the various tokens on the Blockchain.
The chilliz token was founded by Alexandre Dreyfus who still remains its current CEO. The main objective of the chilliz cryptocurrency is seeing that the token is offered at an initial fan token offering. With the chilliz token then, the fans can vote on the socios platform which is made possible thanks to smart contracts.
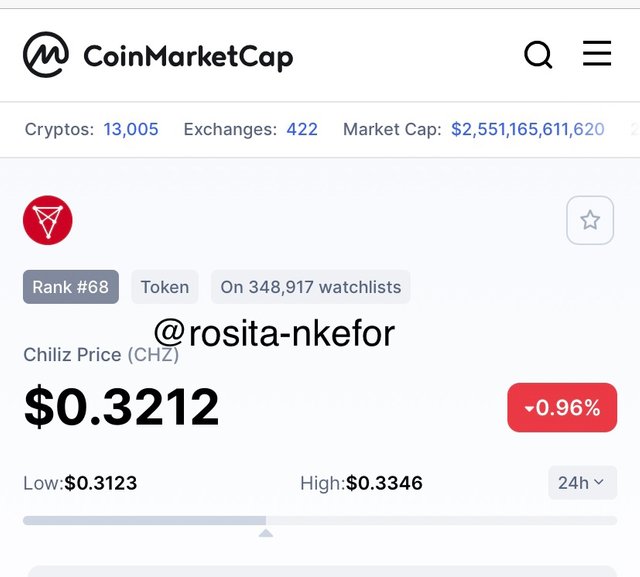
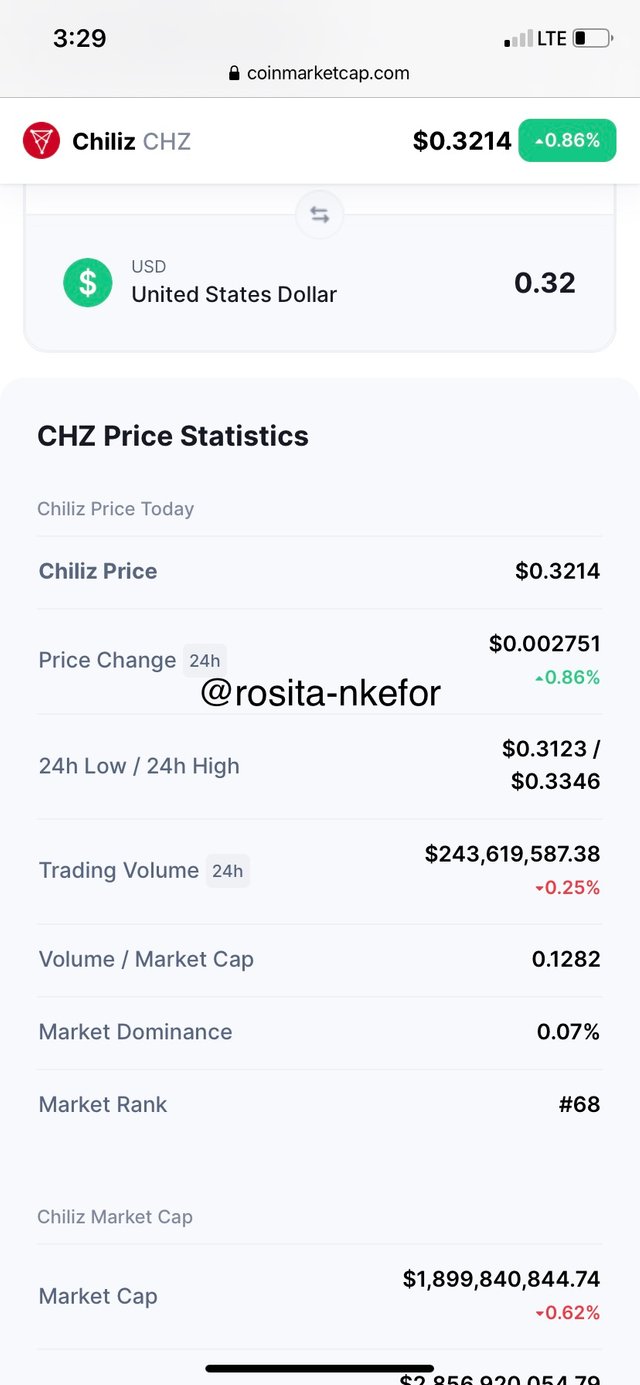
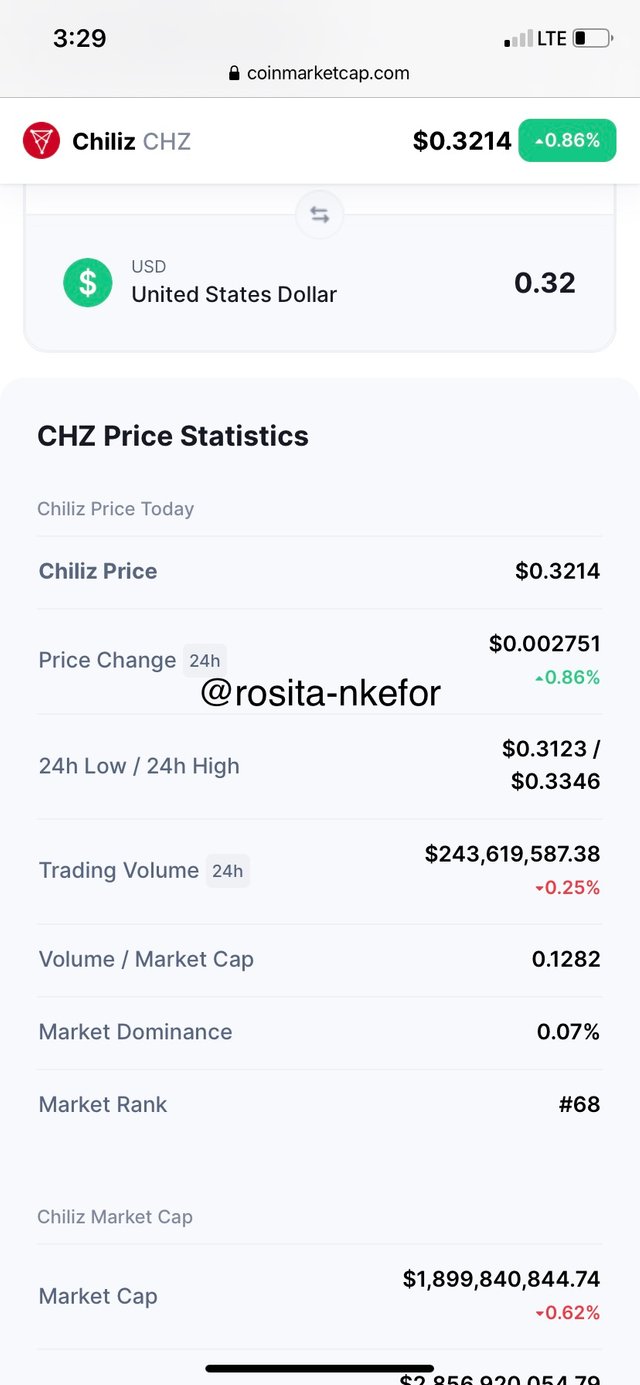
The price of chilliz at the writing of the article is $0.32 with a 24 hour price change of $0.0027. It has the following data as listed below;
- 24 hour trading volume; $243619587.38
- Market dominance; 0.07%
- Ranked on the coinmarketcap; #68
- Market capitalization; $1899840844.74
- And a fully diluted market cap of; $2856920054.79
This is as shown in the screenshot below.
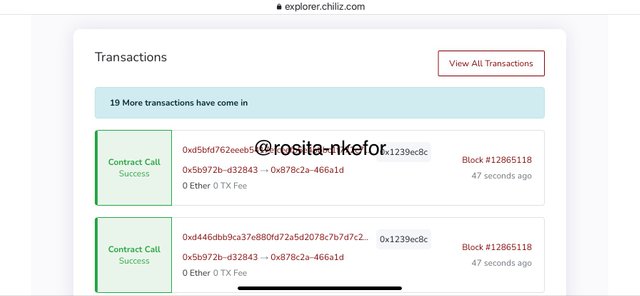
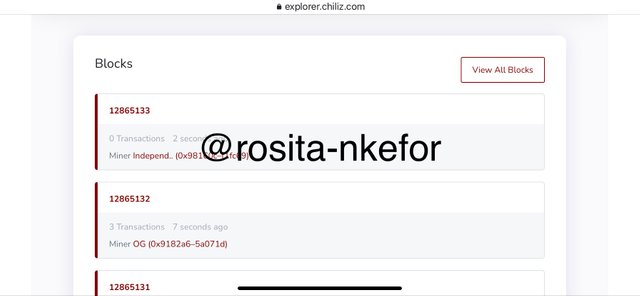
For the on-chain metrics of the chilliz cryptocurrency, using the chilliz block explorer we are going to see the average block time, the total transaction and the total block. This is as shown below;
- The average block time is 5seconds.
- The total transactions is 12865114.
- The number of active addresses are 1178569.
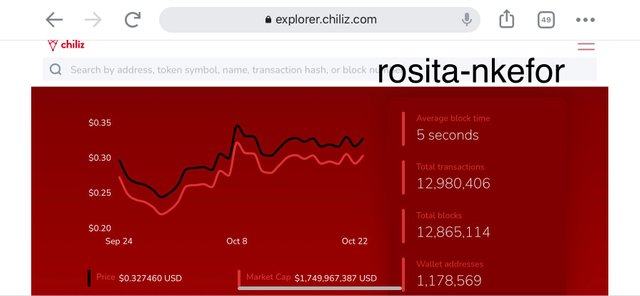
We have seen the average block, the total transaction and the number of active addresses which shows a good number of investors are involved with the chilliz cryptocurrency, which shows it is worth investing in.
As seen below, we also have the transaction showing the 19 new transactions with their smart contract call. And we can see the various blocks as shown below.

3. Make a purchase from your verified account of at least 10 USD of the currency selected in the previous point. Describe the process.

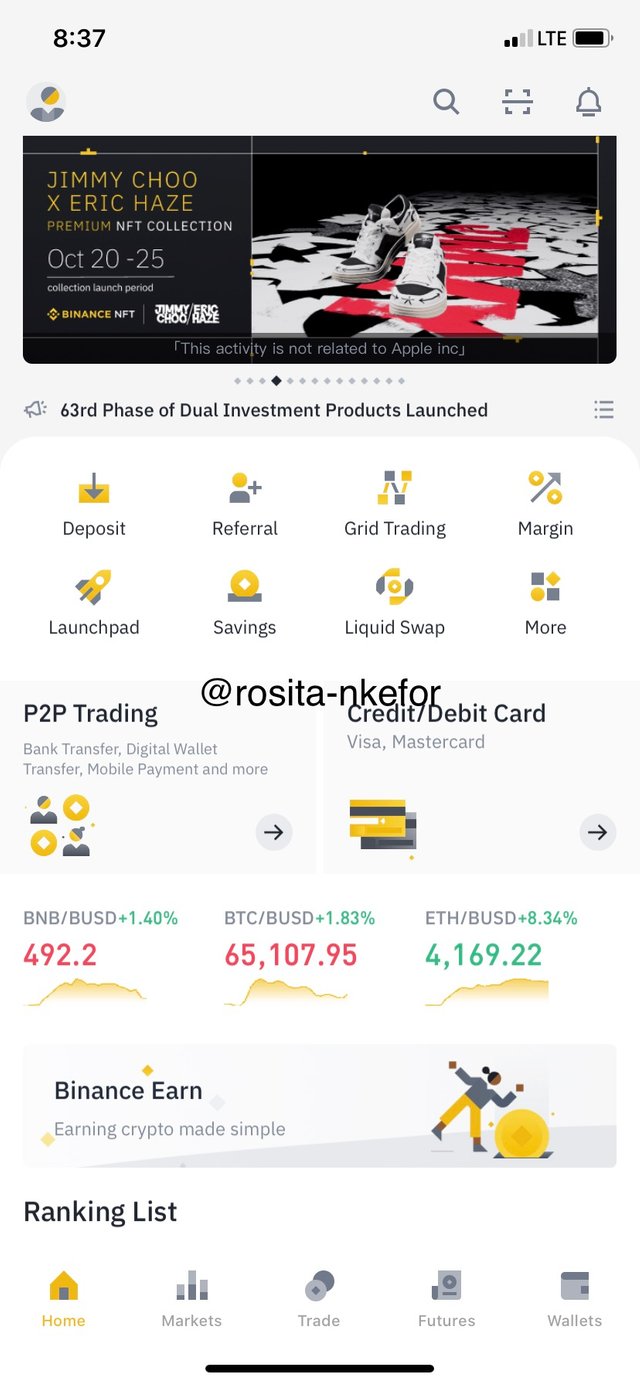
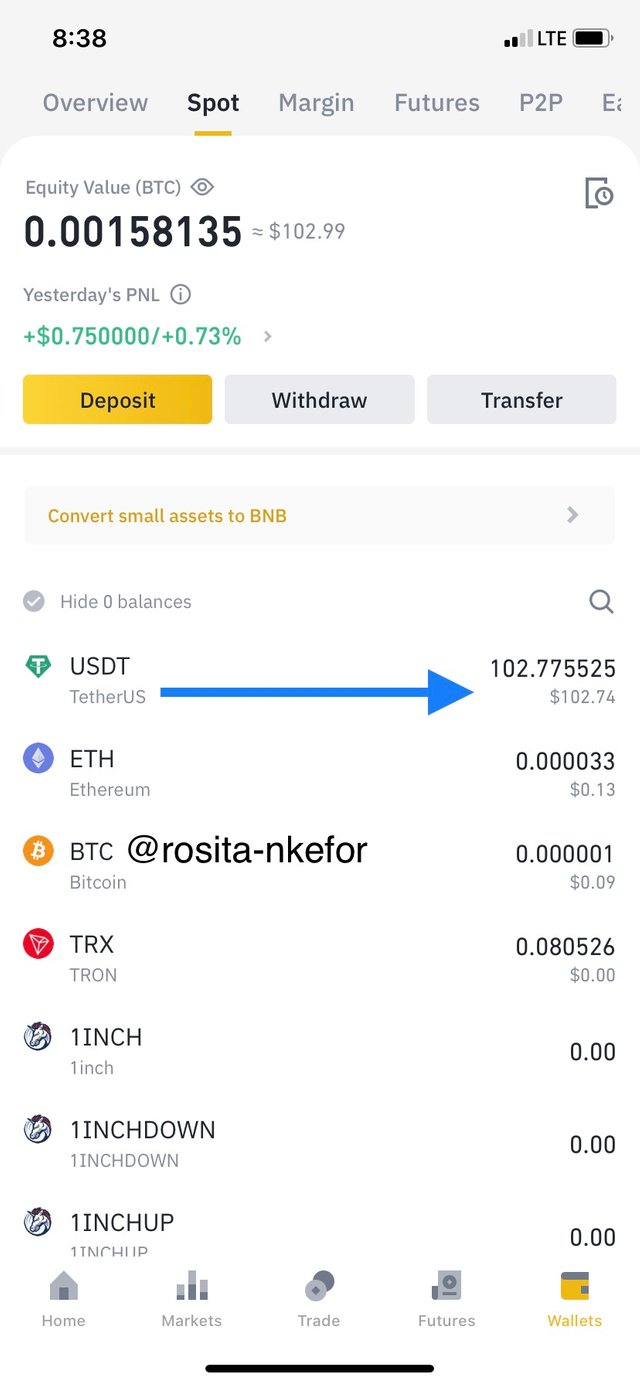
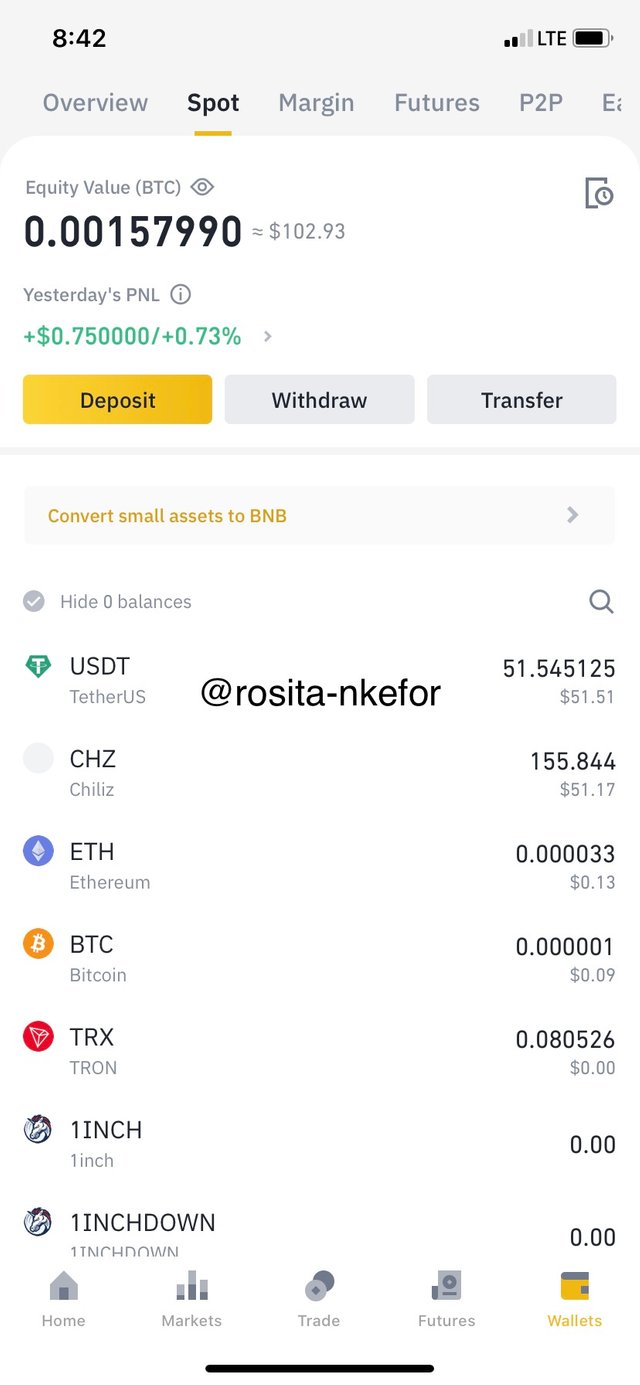
We begin by logging into the binance exchange where I click on the wallet to show my balance in USDT. As shown below.
I then continue by click on trade which I search the CHZ and chose the CHZ/USDT pair since I will be purchasing the chilliz using the USDT. I then click on the sell tab.
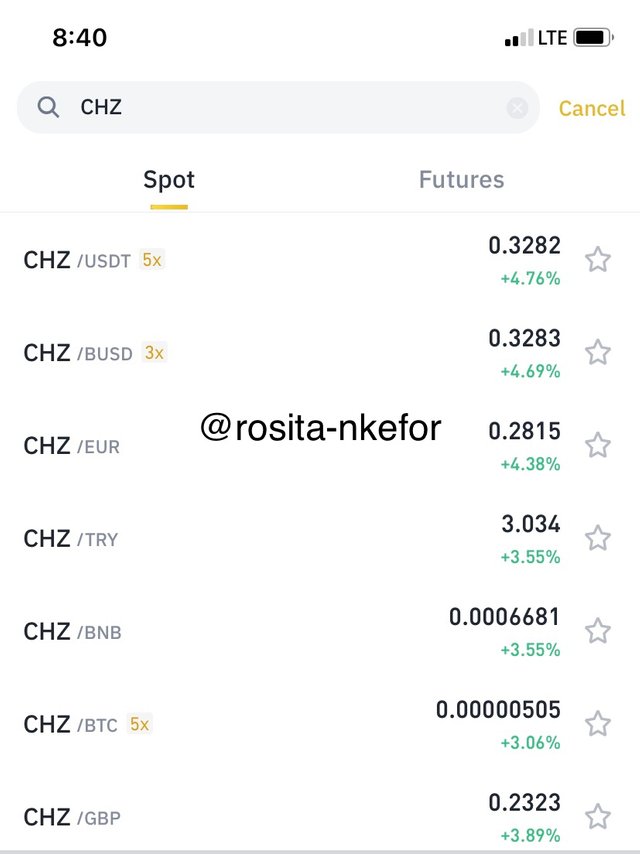
On the trading area now, I will be using the limit order and I will be purchasing 156 CHZ using 51.23 USDT as shown in the screenshots below.
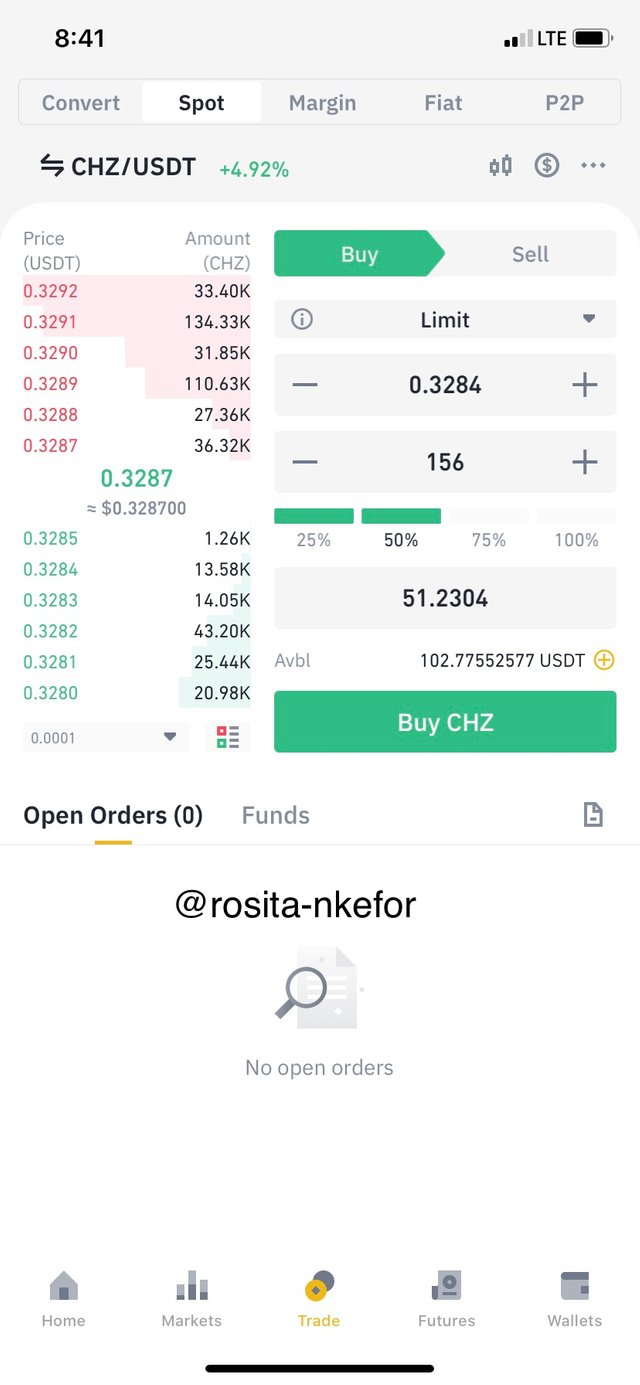

4. Apply Fibonacci retracements to the previously selected asset with a 4 hour time frame on the platform of your choice. Observe the evolution of the price at 24 and 48 hours, did it go up or down in value? Look to identify resistance and support levels

We begin by logging into the tradingview.com platform, in which I will then be selecting the CHZ/USDT cryptocurrency so that I can add my fibonacci retracement tool.
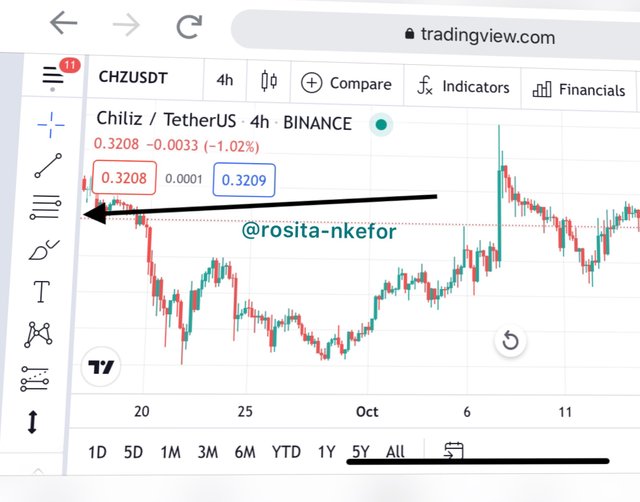
To add the Fibonacci tool, I click on the fibo tab as shown on the screenshot below.
I now identify the trend of the CHZ which is an uptrend, so I click on the last swing point down and drag to the last swing point up. And my fibonacci is added successfully.
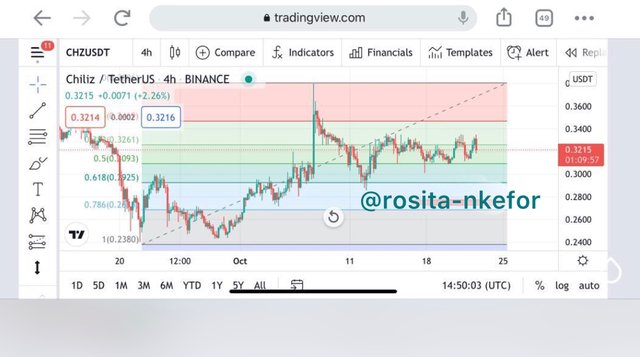
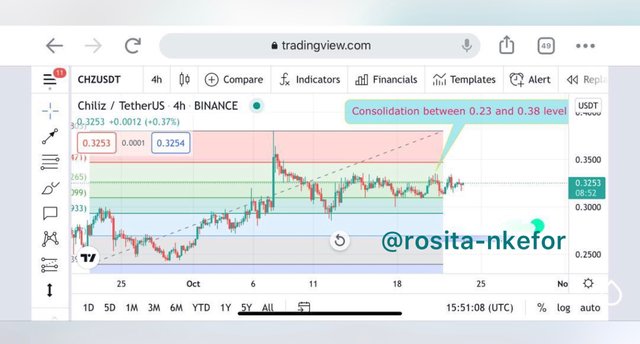
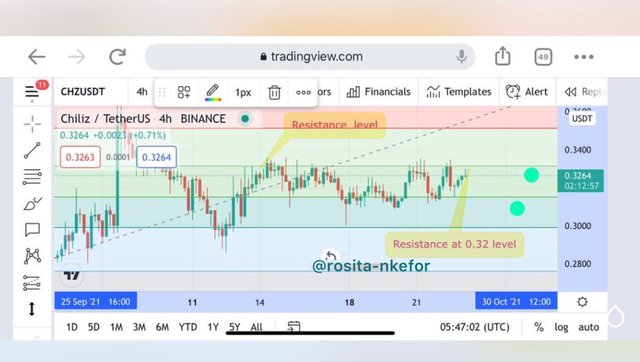
We can now see the various support and resistance levels in the screenshot below, for the various price evolution then we can say the prices spent most of its time in consolidation between the 0.23 level and the 0.36 level.

5. What are Bollinger bands? How do they apply to crypto technical analysis? With which other tool or indicator do you combine Bollinger bands to analyze a crypto.

Bollinger bands is a technical indicator founded by the famous John Bollinger naming his indicator after his name.
The aspect for which the Bollinger band was developed was to identify potential overbought and oversold regions in an asset. The Bollinger band indicator is made up of 3 lines which are the;
- Simple moving average line which is the middle band
- The upper band
- And the lower band.
As a default, the upper and the lower bands are set to 2 standard deviations, which is a plus or minus from 20 day simple moving average. The simple moving average line which is the middle band is interpreted in relative to the normal simple average indicator.
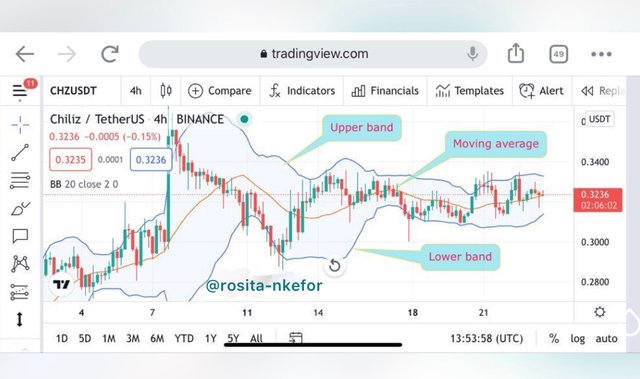
So the interpretation of the upper and lower bands are as follows, when the prices move closer to the upper band it indicates a potential overbought position while when the prices approaches the lower band It indicates a potential oversold region.
The squeeze of the Bollinger band shows a low volatility in that particular asset as well, and we also have breakouts which is significant for confirmation with price action.
Confluence with Bollinger Bands
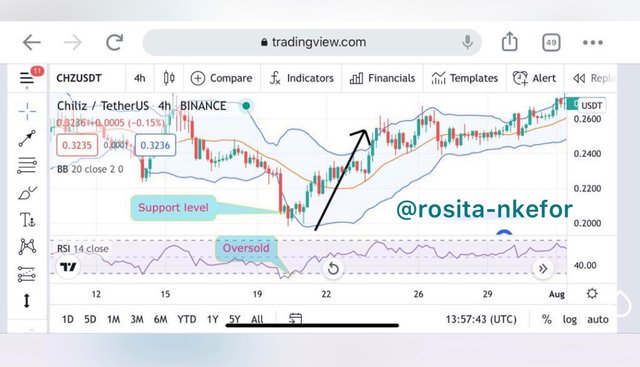
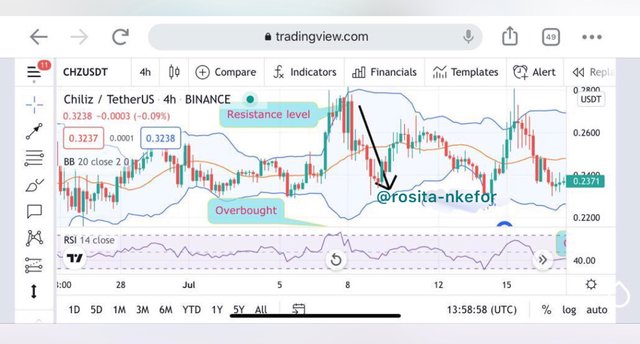
We can use the bollinger band indicators with oscillator indicators such as the relative strength index indicator and the stochastic indicator. I will be explaining it using the relative strength index indicator.
The relative strength index indicator locates overbought and oversold regions which happen when we have the indicator line crossing the upper of the lower band. We can see that in the analysis below.

Conclusion

We have seen the usage of the Bollinger band indicator which identifies overbought and oversold regions. The Bollinger band indicator with its upper and lower bands is then used as support and resistance levels. Also, we have seen the usage of the bollinger band indicator with other indicators which include the relative strength index and the stochastic indicator.
We also have the technical and the fundamental analysis which we have seen the various differences in the two types of the analysis and I have performed a fundamental and technical analysis on the chilliz cryptocurrency.
Thank you for reading.
Gracias por participar en la Cuarta Temporada de la Steemit Crypto Academy.
Continua esforzandote, espero seguir corrigiendo tus asignaciones.
Downvoting a post can decrease pending rewards and make it less visible. Common reasons:
Submit
Thank you professor. But please why have you given me a zero for club5050?
Downvoting a post can decrease pending rewards and make it less visible. Common reasons:
Submit
#club5050 😀
Downvoting a post can decrease pending rewards and make it less visible. Common reasons:
Submit