Hello dear students and professor. I hope we are all doing well. I am very happy to present to you all my homework post for the topic lectured by @lenonmc21.


Price Action + Price Strategies by @rosita-nkefor

1. Define in your own words what Price Action is?

Price action is made up two words; price and action. Price is the amount of money expected in exchange for a good or service. Action on the other hand refers to the process of doing something with the aim of achieving something.
So now what is price action? Price action can thus be seen as the process by which the amount of money expected for an asset moves with time. This is best seen on the market chart of the asset.
A price action trader will therefore be one whose trading strategy and analysis depends on the price movements. Such traders are not affected by external forces. They consider solely the behaviour of the assets price to determine if the price will fall, rise or stand still.

2. Define and explain in detail what the "Balance Point" is with at least one example of it (Use only your own graphics?

The balance point also called equilibrium point or break even point is that point at which the total sales is equal to the total cost of the asset. That is, in a trade, you don’t make any losses or profits in this point.
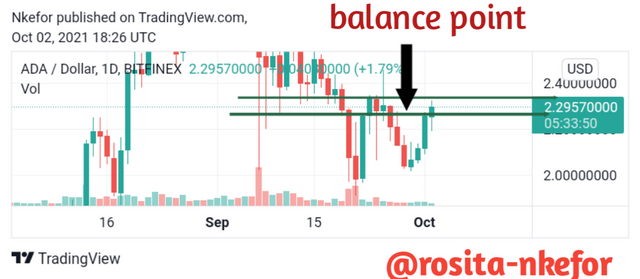
On a chart, the balance point can be seen as the last candle of continuity in an impulse of a trend. This point is very important because once it is identified, a trader now knows that for him to make a profit, the price has to go above the balance point.
You can identify it by drawing two horizontal lines at the bottom and top of the last candle of continuity.

Source

3. Clearly describe the step by step to run a Price Action analysis with "Break-even"?

In order to run a Price action analysis with break-even, one should follow these steps.
Step 1: We will first have to choose the timeframes that we feel works best for us. For example, one trader can choose a timeframe of 1 hour, another trader can choose 30 minutes while another can choose 12 hours.
Step 2: Next, we will go to the chart and mark a horizontal line along each important point of the price reaction. This is going to be for resistance and support in the trade.
Step 3: Finally, we will check in the cycle that we are in, identify our equilibrium point and determine the trend that is currently in the market. All these is important so that we can determine the best entry point to trade.

4. What are the Entry and Exit criteria using the breakeven Price Action technique?

When using the break even Price Action technique, there are certain criteria to follow in order to know when to enter or exit a trade. These criteria include the following;
After you have marked the balance point, observed the chart. As soon as you see a candle that breaks the balance point either up or down, only then can you enter a trade.
We will watch the orientation in which the price will break and if it breaks up, we will put our stop loss below, while if it breaks down we will put our stop loss above.
When putting our take profit, it should be the same distance from the balance point as the stop loss, and it should be in the opposite direction as well.

What type of analysis is more effective price action or the use of technical indicators?

Effective and successful trading can only be done by applying proper analysis on the market. There are are two main type of technical analysis considered when trading. You have the price action analysis and the analysis using technical indicators. We have already seen what the price action analysis is. For the sake of this question, I shall shed some light on technical analysis using technical indicators.
Technical indicators can be seen as graphical representations of all previous data on that crypto currency. The graph is gotten by plotting points and can be used to aid future prediction of the value of a crypto asset. So in this type of analysis, we use the graphs to determine when to enter or exit a trade.
In my opinion, the price action analysis is more effective than that using technical indicators. Why do I say so? The reason is simple. With indicators, we get signals either before they happen to n or after they already happened. But with price action, you determine everything in real-time and can minimize the appearance of false signals. So as long as you know how to properly use the price action technique, trading will be more successful with effective analysis.

Conclusion

I have learned and understood the price action strategy, which is an alternative to the strategy using technical indicators.