Starting Crypto Trading by @rosita-nkefor


What is Fundamental Analysis?
When we want to invest in a digital asset, be it long term or simply trading, we need to know everything about the asset. That is all important information about the asset should be know in order to be analysed. There are two types of analysis namely fundamental analysis and technical analysis.
Fundamental analysis is the type that lays more emphasis on the external factors affecting the price of that asset. It takes more into account the financial and economic aspect of it.
Financial analysis tools include things such as the financial statements, analysis of the environment, valuation techniques of assets etc, amount that is available and amount being asked etc.
It is so focused on getting real value of the asset in the world. Thus any big events that might have an impact are considered. Even exchange sites, news and any other valuable piece of information is used.
Importance of Fundamental Analysis to a Trader
Fundamental analysis is very important to a trader. This is because it provides a lot if information about the assets and its value in the market. This information helps traders to know which assets to trade profitably.
But in as much as it is important, it is not everything. Other analysis are also as important as all information is necessary to make good decisions.


Technical Analysis
Technical analysis rather focuses on the previous price movements and volumes in the market, and uses it to predict future price movements.
This type of analysis is more popular with traders because it helps them understand the markets direction way better. Also, it is perfect for generating signals in a short term.
Some technical analysis tools include technical indicators, trends, patterns, entry signals etc.
Differences between Technical Analysis and Fundamental Analysis
| Technical Analysis | Fundamental Analysis |
|---|---|
| It is good for short term trading | It is good for long term investing |
| It analyses internal factors like volume | It analyses external factors like events and financial statements |
| It is used to predict future price movements | It is used to determine the value of the asset in the market |
| It considers only previous data | It considers both previous and present data |


1 hour time frame

I have placed my sell order with a proper stop loss and take profit in timeframe of 1 hour.
30 minutes time frame

I have placed my sell order with a proper stop loss and take profit in timeframe of 30 minutes.


1 day time frame

I have placed my buy order with a proper stop loss and take profit in a timeframe of 1 day.
4 hour time frame

I have placed my buy order with a proper stop loss and take profit in a timeframe of 4 hours.


Candlestick charts are simply charts that shows the closing, opening, high and low prices of an asset over a period of time. Now these candlesticks form different patterns on the charts, patterns which have great importance when it comes to technical analysis of that asset. Two of such patterns can be seen below.
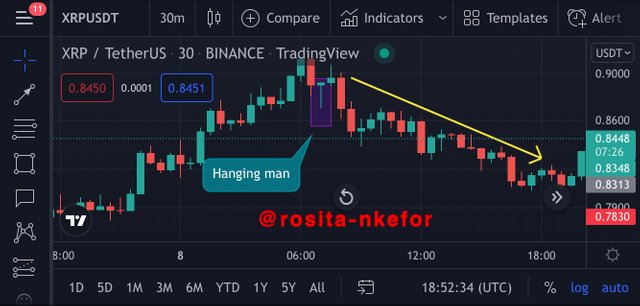
The Hanging Man Candlestick Pattern
This pattern is marked by a short candle body and a long wick going below it. It is a trend reversal pattern and in particular a bearish reversal pattern.
This means that when this pattern occurs, the market is predicted to move in a downtrend it bearish manner. As such, this pattern occurs when the market is an uptrend.
What happens is at that point, the buyers start to lose control over the market because of the selling pressure in the market. It causes this pattern to form allowing the sellers to takeover the market causing it go to a downtrend. An example can be seen below.

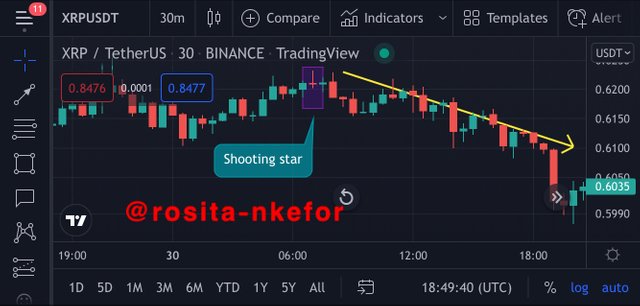
Shooting Star Candlestick Pattern
Now this is also another type of trend reversal pattern and the bearish type in particular. It is made up of a short body that is very close the low, and a long upper shadow or wick.
It occurs in a uptrend and it signifies that the sellers have taken over and that the market will now be in a downtrend. We have an example below.


In trading, both fundamental analysis and technical analysis are important. Though technical analysis is used more often to trade short term.
Also, when trading, we need to be able to identify resistance levels and support levels. As well as good entry points, our timeframe also matters. Thank you professor for such a wonderful lecture.