
Support and Resistance Breakouts


In the technical analysis of the price movements of an asset, two aspects are very important. They are the major price levels known as the resistance level and the support level. Now what exactly are they?
A resistance level is a top price level regarded as the roof of the price, where the price of the asset finds it difficult to go above and most likely reverses it's direction.
While a support level is the lower price level regarded as the floor of the price, where the price of the asset find it difficult to go below it.
These levels can be seen as price boundaries that help regulate the price movements. But why is it important to locate these levels on a chart?
Advantages of locating resistance and support
- One benefit of locating these important price levels is that they help traders understand how the price is moving. Horizontal levels indicate a ranging market while sloping levels indicate a trending market.
- Another benefit is that they help a trader to find the best entry and exit points on the chart. This is through the use of breakouts and rebounds.
- One other benefit is they can be used in any trading strategy. That is, no matter what your style of trading is, finding the resistance and support levels in your chart is very useful and beneficial.
- Fortunately, they also work very well with trading tools such as indicators.
- They help provide many signals of the price no matter the timeframe being used. This helps in making good trading decisions.
- Their positions may indicate a pattern which can help the trader predict the future price movements of that asset.


When price goes above the resistance level or the support level, it is termed a breakout. Breakouts are usually an indication of a trend continuation.
When the price breaks through a resistance level, it goes up for a while then falls back to retest the resistance level. If the momentum is strong enough, it will ensure a bullish continuation till the price hits a new resistance. The previous resistance becomes the new support.
On the other hand, when the price breaks through a support level, it falls for a while then goes back up to retest the support level. If successfully gaining momentum, the price will continue falling ensuring a bearish continuation.
Example of a Resistance Breakout
I am using the XRP/USDT crypto pair on the 5 minute timeframe for this example. My chosen indicators are the trading volume and the Relative Strength Indicator.
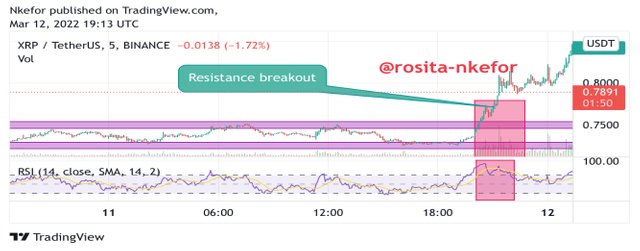
I was quick to identify my resistance and support levels as the first thing. It could be observed that the price of the asset ranges for a while. Then afterwards, aggression from the buyers caused the price to break above the resistance level.
The price then takes a short ranging break before launching itself into a bullish run to find a new resistance. The older resistance now becomes a support level.
All these can be confirmed by the large spike in the trading volume at breakout and after taking the break. The breakout is also confirmed by the RSI which moved above 70 about the time of breakout.


My example is based on the ETH/USDT chart in the 5 minute timeframe.
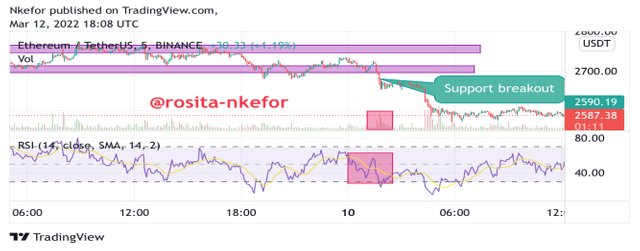
I first of all identify my resistance and support levels. The price is observed to be in a ranging movement. Then the sellers get aggressive which causes a breakout in the support level.
Price moves downwards for some time then takes a ranging break. After the break, it continues moving in a downward movement showing a successful breakout. The support level now becomes the new resistance level.
And this movement can be confirmed by the high spike in the volume being traded about the time of breakout and after the ranging break. Showing that the sellers still have the dominance.
The RSI also confirms this by going below 30 before it starts moving back towards 50.


Breakouts occur when price crosses the resistance or support levels. But what if those breakouts are actually false and don't end up being successful? What exactly is a false breakout?
If the price breaks above a resistance level or below a support level, and then the price goes back to retest that level but fails to gain that same momentum again, the trend will reverse instead of continuing. This is what we call a false breakout. Below is an example on an ETH/USDT chart in a 5 minute timeframe.
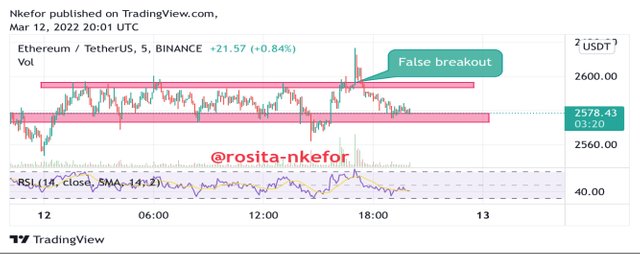
The price started by ranging between the identified resistance and support levels. Then suddenly, an aggressive move by the buyers forced the price to break the resistance level. This is justified by the spike in volume traded and the movement of the RSI indicator very close to 70.
When the price came back to retest the resistance level, the sellers lacked that same aggression which caused the trend to reverse and the price to fall. This is confirmed by the low to normal volume traded along with the continuous fall of the RSI toward the 50 line.
How to avoid trading during a false breakout
In order to help you filter out a false breakout from one which will be successful, you can follow these tips.
- After a breakout occurs, do not hurriedly place your trade.
- Wait for more candles to form and allow the price to retest the price level.
- Always keep a eye on the volume at all times and whatever indicator you are using alongside.
- If during retest you find very large volume being traded in comparison to before, then the breakout is most likely to be successful and you can place your trade a few candles from that.


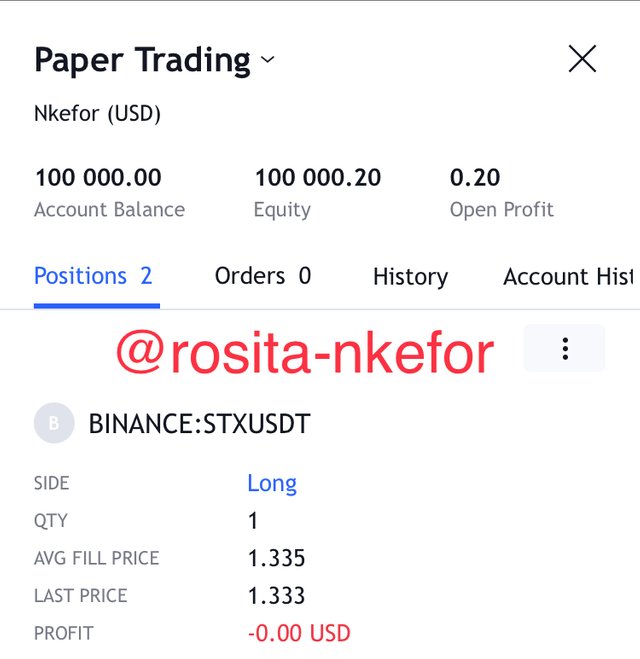
This trade was done on the STX/USDT crypto pair in a one minute timeframe. I am also using volume and the RSI indicator for analysis.
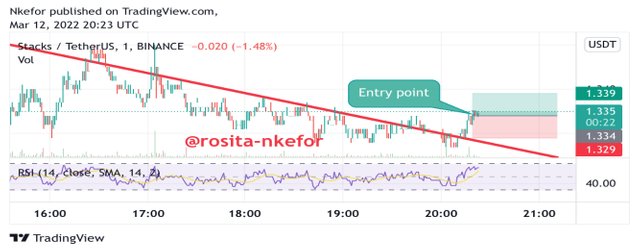
My resistance level ended up being a sloping level because of the nature of the chart in that timeframe and at that moment.
So I patiently waited for the price to go above the resistance which it had previously followed. When it went above, I noticed a spike in the volume traded and a rise in the RSI above 50.
The price retested the resistance level before finally continuing upwards. The RSI was moving towards the 70 line but I kept my eye on volume. As soon as the volume increased rapidly, I quickly made my entry and placed a long trade.
Below is a screenshot of the transaction.


This trade will be performed on a BTC/USD crypto pair in a 1 minute timeframe. The RSI indicator and volume are applied in the chart to help filter out signals.
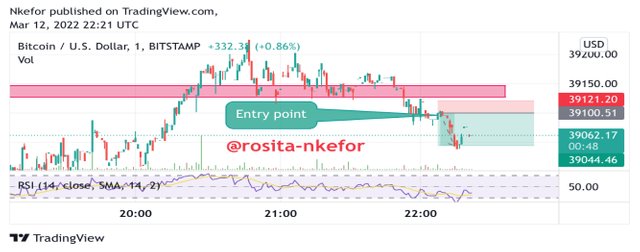
After identifying my support level, I waited patiently until the price broke out from the support level. After the price broke out, it was confirmed by a large volume and a move of the RSI towards 30.
The price took a break before it started falling again. The RSI went below 30 to confirm a successful breakout. This was accompanied by a volume increase.
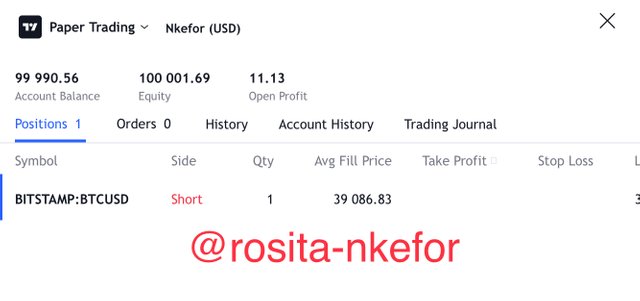
I waited for a few candles to form first before placing a short position demo trade. Below is a screenshot of the transaction.
Conclusion
Support and Resistance levels are very important trading tools especially at the level of breakouts. Thus, we have to be able to differentiate between a false breakout and a successful breakout to mar sure we trade correctly.
We can also apply the use of indicators like the RSI indictator to help us filter signals.
Thanks for reading.