Greetings guys,


Introduction

This week we have been presented with another great lecture by our able professor @abu.navi03. This week he has gone out of his way to lecture us on one of the indicators traders employ before making entry or exiting the market. After going through his lecture I will now submit my homework task.

1-Explain your understanding with the median indicator.

Before we go into what the median indicator is, I think we need to take a look at what an indicator is. A technical indicator in simple English terms is a tool used by used by advanced or simple traders to make readings on a cryptocurrency chart before they make their trades in the market. The trade can be a buy trade or a sell trade, the indicator plays both roles. but some indicators are good in certain situations.
A median indicator in simple terms is an indicator that follows trends to make its readings. This is mainly based on the theory of indicating where the market is heading towards( whether upwards or downwards) using the volatility. This means that the median indicator considers up to 3 things to produce a reading to a trader, this are the volatility, trend and direction of the market. This indicator can be likened to moving averages just that the median employs the extra use of the volatility in the market, making it slightly better than the other indicators.
The median indicator uses the ATR value and the median line which is seen to be thick on the chart. The ATR and the median line of the indicator helps in determining the volatility.
The median indicator works by employing the use of two colors which stand for the bullish and bearish signals. The 2 colors are the purple for a bearish signal and the green color which stand for a bullish signal. The colors also show when the market is going on a reversal. On the chart, when you notice the color change from purple to green it indicates the market is reversing from a bearish signal to a bullish signal hence making an entry at that point is ok. When we notice that the color of the indicator is changing from green to purple the market is reversing to a bearish market hence at that point exiting from the market is advised.
The chart also employs the use of the EMA lines. So combining the colors with the EMA line, the reading of the indicator is done like this.
When the median line of the indicator crosses the EMA line above and the color of the indicator is green it shows a bullish signal but when the median line of the indicator crosses the EMA line below and the color of the indicator is purple it shows a bearish signal.

2-Parameters and Calculations of Median indicator. (Screenshot required)

For this part of the question I will be using the trading view site on google where I can access the charts and the indicator required. Now let us access the parameters of the median indicator below.
I visit the trading view site and I click on chart and add any crypto asset chart. After adding my crypto pair, I will now click on the indicator menu above and then search for the median indicator. Then I will add the indicator as seen in the screenshots below.
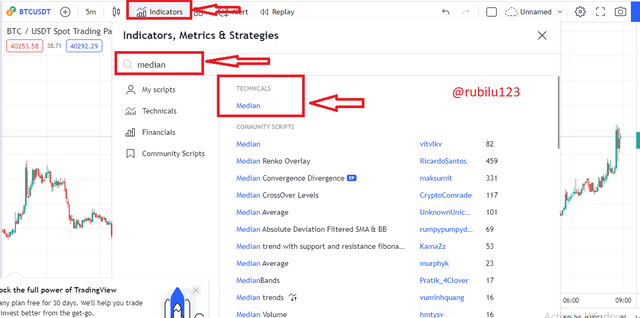
Trading view
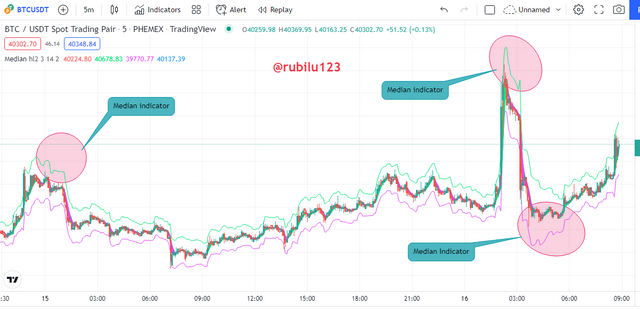
Trading view
After adding the indicator to the chart successfully, I will now try and access the parameters of the chart. You can do this by clicking anywhere on the indicator which has been added to the chart to access the settings. Now click on the settings icon that displays along side other functions when you click on the indicator.
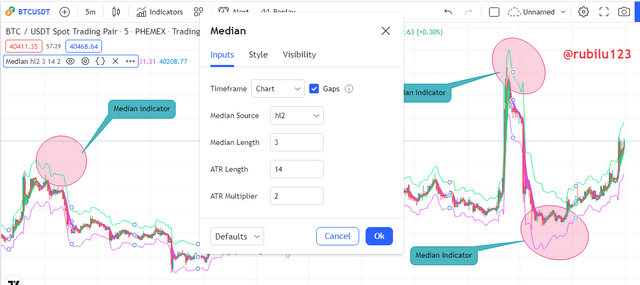
Trading view
Now on the settings tab, the chart can be configured how the trader wants it. The trader can configure the parameters to suite his trading style.
On the inputs tab, the user can reconfigure the ATR length, the ATR multiplier, the Median source, the time frame.
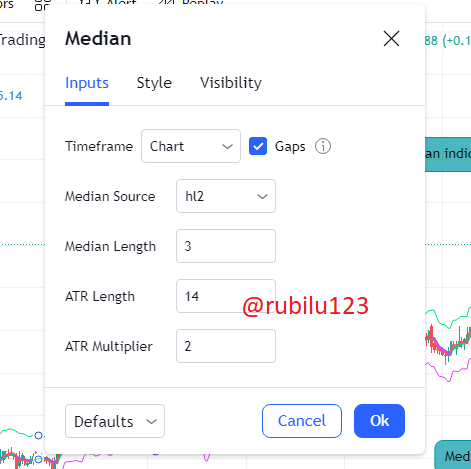
Trading view
On the style settings, the user can reconfigure the the median, upper band, lower band, median EMA, plots background.
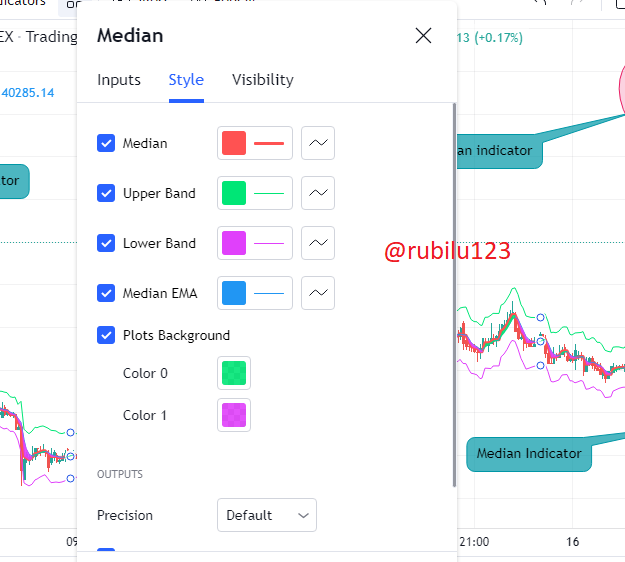
Trading view
On the visibility side, the user can reconfigure the periods of the indicator. The user can reconfigure the seconds, minutes, hours, days, weeks, months.
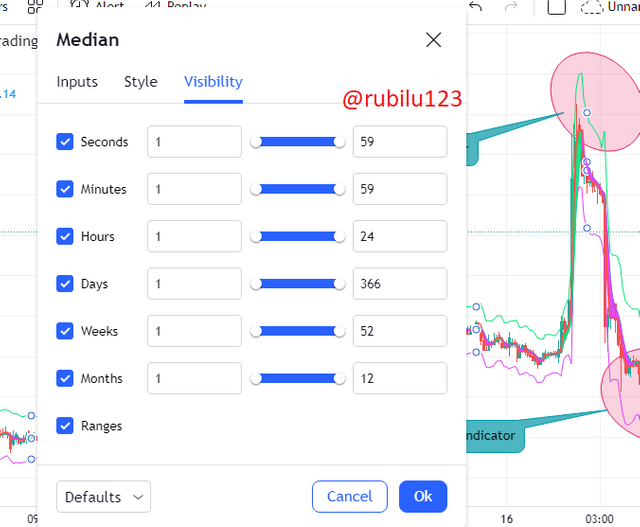
Trading view
After accessing the parameters of the indicator, I will now show the calculation of the indicator.
The median indicator is calculated based on percentage difference. The percentage difference between the median value and the EMA value. The formula of the median indicator is below,
Median value= highest price of the asset + lowest price of the asset/ 2.
EMA value= closing price of the asset x multiplier + EMA( of the previous day ) x ( 1 -multiplier)

3-Uptrend from Median indicator (screenshot required)

The median indicator is used for identifying trends thus using the help of the moving averages. In an uptrend market, the color of the indicator is ideally green. This occurs as the median value of the indicator is higher than EMA value. This means that the market is in a bullish phase.
The indicator has the potential of also showing the direction the market is heading towards. The indicator has the potential of showing that the market is reversing from the bearish phase to the bullish from by changing color to green.
This shows the general feeling of the market. Where the traders are putting their bets on. It shows that the buyers in the market are getting stronger in the market for a situation of reversal and a strong presence of buyers for a situation of bullish phase.
The screenshot below is the illustrates the uptrend on a median indicator.
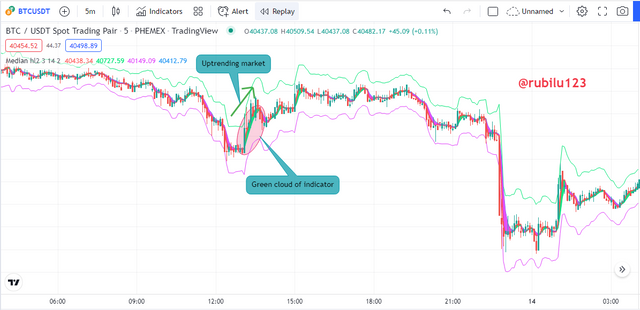
Trading view
In the BTC/USDT chart above, you can see that the indicator showed the the reversal in trend from a bearish point when the indicator was purple in color and the when the momentum was now changing towards the bullish phase we can see the color of the indicator turning green. This give traders an opportunity to enter the market.

4-Downtrend from Median Indicator (screenshot required)

As with the up trending market, the down trending market on the median indicator is slightly different with a bit of changes.
In a down trend market, the color of the indicator is ideally purple. This occurs as the EMA value is higher than median value. This means that the market is in a bearish phase.
The indicator shows the direction the market is heading towards. The indicator has the potential of showing that the market is reversing from the bullish phase to the bearish by changing color to purple.
This shows the general feeling of the market. Where the traders are putting their bets on. It shows that the sellers in the market are getting stronger in the market for a situation of reversal and a strong presence of sellers for a situation of bearish phase.
The screenshot below is the illustrates the downtrend on a median indicator.
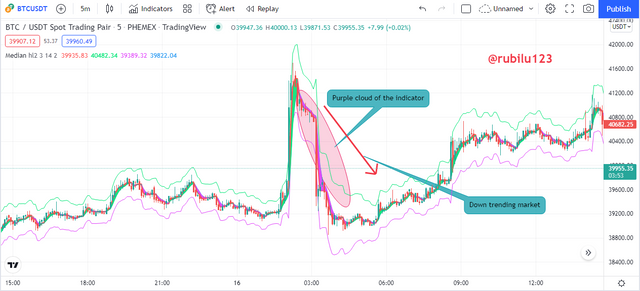
Trading view
In the BTC/USDT chart above, the purple cloud of the indicator is seen to be forming just above the price. This indicates that the market is down trending. We also notice that whilst the price is up trending initially we could see the green cloud of the indicator but immediately we notice the purple cloud forming the market is reversing.

5-Identifying fake Signals with Median indicator(screenshot required)

We have dealt with indicators thus far and we know that no matter how good we deem an indicator to be, there will always be a situation where the indicator will give us a wrong reading. It is this wrong reading we refer to them as fake signals and when we are not careful we will be taking a wrong position in the market.
That is why we say that indicators are not 100% thus is it advisable to add another indicator whilst using it to help in the reading. Indicators that predict the direction of the market are indicators which use historical price date thus thus indicators are prone to lagging behind thus giving out fake signals.
So to filter out this fake signals I will be using the RSI indicator in addition with the median indicator.
The RSI indicator is technical indicator that shows the overbought or oversold signals. When the line of the RSI is above the 70 mark it shows that the market is going on a bearish trend reversal which means the asset is overbought. When the RSI is below the 30 mark the market is an oversold going on a bullish reversal.
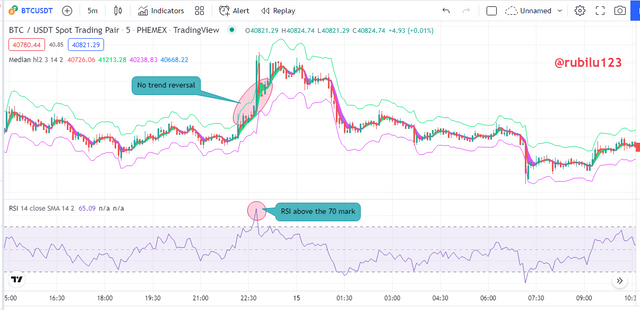
I will depict fake signals of the median indicator by adding the RSI indicator to the chart below.
Trading view
In the chart above, we notice that the RSI is above the 70 level which indicates a bearish reversal trend. But the median indicator refused to change its color from the green side to the purple side indicating a bearish trend. The best for a trader whilst using the median indicator and the RSI indicator is to wait whilst both indicators confirm his or her position before he takes a decision.

6-Open two demo trades, long and short, with the help of a median indicator or combination that includes a median indicator (screenshot required)

For this part of the assignment, I will be using the trading view site on google to make my chart analysis and also use the trading panel site provided by trading view to make my demo trade.
Buy demo trade
Trading view
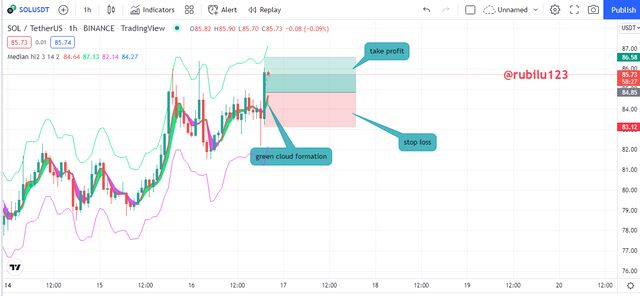
In the SOL/USDT chart above , the asset was seen to be in downtrend as seen by the purple color of the median indicator. But after a while we noticed that the green cloud was beginning to form along side the green candle stick which showed the presence of a bullish trend hence a reversal in trend from bearish to bullish was anticipated so I made my entry.

Trading view
Sell Demo trade
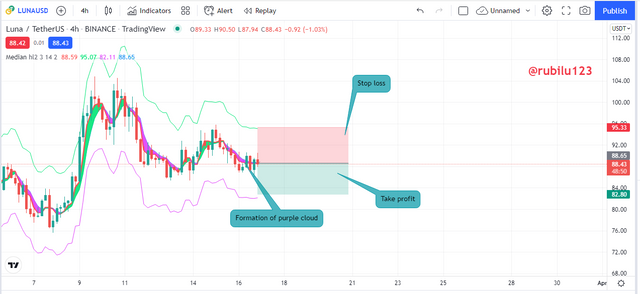
In the LUNA/USDT chart above , the asset was seen to be in uptrend as seen by the green color of the median indicator. But after a while we noticed that the purple cloud was beginning to form along side the red candle stick which showed the presence of a bearish trend hence a reversal in trend from bullish to bearish was anticipated so I made my exit.
Trading view
 Trading view
Conclusion

We have been able to look at the median indicator in this weeks homework task by the professor. The median indicator can be considered as a trend following indicator which dictates the direction of the market. It is also good for dictating when an asset is going on a reversal and when a trader can make an entry and exit when using the chart. But we should also realize that it is not 100% thus we are advised to use it in addition to other indicators to filter out the fake signals on the chart.
Indicators like the RSI, and also the moving averages can be used in addition of the median indicators. I enjoyed the lecture and I will like to say a big thank you to the professor.