Greetings guys,

Image designed by me on snappa

This week professor @reminiscence01 has introduced us to another special trading pattern; trading with price action. With this pattern crypto traders are able to maximize profits in the market. After going through the professors lecture I will now submit my homework task.

1.Explain your understanding of price action.

When we hear of word price action, the first thing that comes into our minds is what the price of an asset is doing. In our case we might refer to it as what the assets price is doing or in other terms how it is behaving on the chart.
When we talk of price action in the crypto currency market, it can be described as how the price or the asset is behaving over a period of time. The price action is what helps trader make technical analysis on charts. To be more specific, without this price action the traders and market analyzers cannot use this indicators to make technical analysis in the market. The price action can be referred to as the trends of the market. I say this because it is the price that shows that a market is either moving or is not making movements. This is how the market behaves and all this movement is due to the price action.
Before a trader makes an entry or leaves the market, he looks at how the price is behaving. Support and resistance levels are an important aspect of identifying where the market is making or is about to make movement thus knowledge in price action can help traders to identify these vital support and resistance levels in their trades. Knowledge of price action can help traders to be able to read and use technical indicators easily. Traders in the crypto space normally use the Japanese candle stick on charts and when using price actions but other charts can be used. Even though we regard the price action as a good way of spotting good entry and exit levels in the market, It should also be taken into account that it is not 100% and different traders can come out with totally different conclusions after using the same assets price action.
It is worth noting that the groups of people to employ the use of these type of trading strategy are the big institutions and also the retail traders in the market by making sure to place or open leverage positions on these assets. By doing this they tend to render the fundamental analysis and the use of the technical analysis tools useless as they will tend to report late signals to the traders.
The price actions apart from showing how the asset is behaving in the market also shows a lot of other things in the market. When the price action is showing a rise in price, it shows that the general feeling in the market is excitement and that the buyers in the market are active, it can also show that the whales in the market are at work accumulating. When the price action is showing a downtrend it shows that the market is in a state of sadness or the sellers are active in the market. So generally what this means is that the price action is affected by a whole range of factors and some of them might be the news surrounding the asset but one thing we know for sure is that the price action shows the emotions of the traders in the market.

2.What is the importance of price action? Will, you chose any other form of technical analysis apart from price action? Give reasons for your answer.

- With the use of price action a trader can make entries and exit in the market.
The price action describes how the market is moving so when the trader is able to spot the support and resistance levels the trader can then use this levels to spot his entry and to also spot his exit levels and to also decide where to set his stop loss and when to take profit. When the market is in an uptrend phase and then suddenly provides a resistance line then it means is time for the trade to follow the signal the price action is giving and leave the market but when the price action is trending downwards and then it is able to provide a support level the trader is able to spot his entry level there.
- Price action reveals the general feeling in the market.
The crypto market is characterized by emotions and what better way to see the emotions that are surrounded or felt by the traders that analyzing the price. If the price of the asset displays a ranging market the feeling is that most traders do not know if they should exit their positions or should they enter into positions. This is a general feeling of uncertainty in the market. A downtrend may display that traders are either feeling like the market is go back on them so they are taking their profits.
- Price action helps traders in determining the direction in which the market is heading.
The price of the asset is either moving or it is not. When this happens the reaction from the price is able to inform the traders on the next move they should take. If an up trending market suddenly stops moving the trader knows that the next direction for the market is downwards thus with this information the trader knows the direction of the market.
- Price action help technical analysts to use technical indicators.
Most of the technical indicators are either trend following indicators or they try to show the direction of the market. Now without the price action these technical indicators will either be displaying false signals or they will be displaying no readings at all.
- Price action traders are able to benefit from short term trading.
The market is volatile thus the market can be up trending now and be in a downwards movement 10 minutes later. That is why the best type of trading for traders who do not intend to keep their positions opened for a long time is the short term trading. In this type of way the trader is able to follow the price action and gain profit.
Will, you chose any other form of technical analysis apart from price action?
As we have established, there is no technical analysis pattern or tool which is 100%. So as a trader I will use the price action in addition to other technical analysis tools or patterns to combine my readings before taking a position in the market.
Because of how volatile the market the market is, a trader going into the market just by using the reading of the price action might be going in with a completely wrong reading. Remember we said all traders can use one assets price analysis and still come out with totally different readings. This can only mean that sometimes the price action give outs false signals and then by the addition of these other analysis tools they are able to filter out the noise from the chart.
There are indicators in the market which help the trader to realize the buy and sell opportunities at the support and resistance levels. So after the price action has been able to identify these support and resistance levels we can then use these technical analysis tools to spot these levels. A good example of such indicator is the parabolic SAR indicator.

3.Explain the Japanese candlestick chart and its importance in technical analysis. Would you prefer any other technical chart apart from the candlestick chart?

The japanese candle stick is a type of price chart which is used by traders to see the direction the market is moving. There are numerous types of charts but the most used is the Japanese candle stick chart. The candle stick chart displays a four points which trader use in determining the market direction or the next line of action of the price. These points are Open, low, high and close points. The candle stick chart is comprised of two types of colors for each candle stick and the type of color the candle stick has determines the trend the market is in.
A green candle stick shows that the price is bullish and a red candle stick shows that the price is bearish.
The candle stick pattern displays the emotions or the feeling round the market. The other types of charts are able to display the prices of the assets but unlike the other charts like the line chart; the line charts show the closing price of the asset but the candle stick shows the open, close, high and low price of the asset which is very important to the trader and is used in determining the market trend.
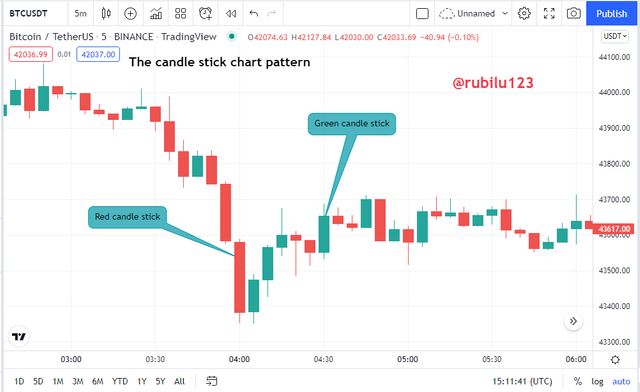
Trading view
In the screenshot above is the japanese candle stick chart. As we can see it is characterized by red and green candle stick. Each candle stick on the chart has the it information stands for. The information on the chat is what the traders use in identifying the entry and exit positions in the market. These candle sticks are created by the movement of the price. These patterns sometimes move up and down or even sideways.

source
The four points of the candle stick is seen in the image above. The part between the close and the open is known as the body. The parts on the candle stick that come out a the long attachments are known as the shadows.
The candle stick patterns also help traders to easily identify support and resistance levels.
Would you prefer any other technical chart apart from the candlestick chart?
Of course I would consider using a different pattern, am not discrediting the work that the candle stick chart has. The candle stick chart is easy to use but there are easier charts to use . Using some of the indicators and combining it with the candle stick is very difficult to locate the trends or the patterns as the candle stick cahrt tends not to work well with them. An example is when using the candle stick charts for leverage trading it is quite difficult to use some of the indicators as the trends are quite difficult but when using the heikin Ashi chart pattern is easily used with the leverage trading. The candle stick as we stated most at times has a lot of noise thus it is better to use other charts which are easy to use.

4.What do you understand by multi-timeframe analysis? State the importance of multi-timeframe analysis.

Multi-time frame analysis is another type of analysis pattern. When using the multi-timeframe analysis ,the trader uses the different time frames to analyze the same asset before taking a position in the market. The shorter time frame is as we have all established is the chart that shows more trading opportunities on a chart so the trader uses it for opportunities to enter the market. Whilst the larger time frame is used for identifying loner trends in the market.
The multi-timeframe analysis has helped trader to gain profits in the market because it helps traders to identify ideal support and resistance levels on a chart. This analysis is helpful for traders who are scalpers and those who also apply the swing style of trading. As I said already the shorter time frame is the frame that displays the buying and selling opportunities in the market.
The best a trader should do is to combine both of these methods by confirming from the shorter time frame his entry and exit positions and then from the longer time frames he will confirm the trend of the market and how long it can go for so that he can make his profits.
State the importance of multi-timeframe analysis
After explaining how the multi-time frame works, we will now look at the importance of these trading style.
The multi-timeframe analysis is used by traders to determine entry and exit positions in the market
The multi-timeframe analysis uses the short time frame to make analysis and the short time frame on a chart is the chart that displays the trading opportunities on a chart, most importantly the buy and sell levels.
The multi-time frame analysis helps filter out the noise from the chart
shorter time frames are ultimately known as the chart to carry a lot of noise with them and most at times they are known to give false signals in the market. When this happens, a trader can switch to the longer time frame which can help filter out the noise from the chart by showing to the trader the direction of the market.
The multi-timeframe analysis shows the direction of the market
As we stated already, these type of analysis type has two time frames where the trader can switch to a shorter or longer time frame before making his or her decision. The longer time frames is the time frame that is responsible for displaying to the trader the direction and trend of the market.

5.With the aid of a crypto chart, explain how we can get a better entry position and tight stop loss using multi-timeframe analysis. You can use any timeframe of your choice.

In this part of the assignment I am going to set up an entry position and also locating a stop loss using the multi-timeframe analysis.
For this illustration I will be using the trading view site in making my analysis and I will be using the ADA/USD chart. I will use different time frames choosing from a longer time frame to a shorter time frame to make my analysis.
The first time frame I will be using here is the 1D time frame on the ADA/USD time frame.
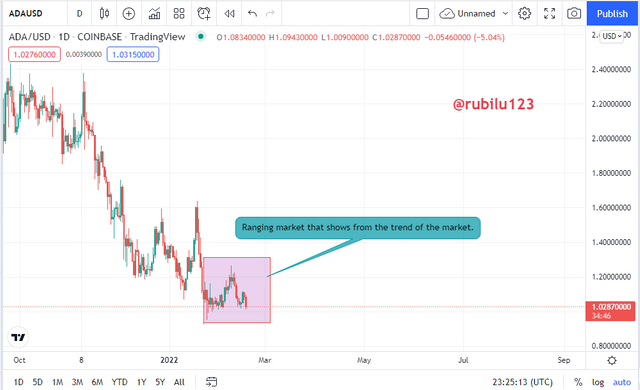
Trading view
Looking at the 1D ADA/USD chart above we were not able to spot our support and resistance lines as the time frame to the chart was a longer time frame so it shows the direction which the traders are trading right now and the chart shows a market which is trending in the ranging phase. So I will reduce my time frame for the next chart.
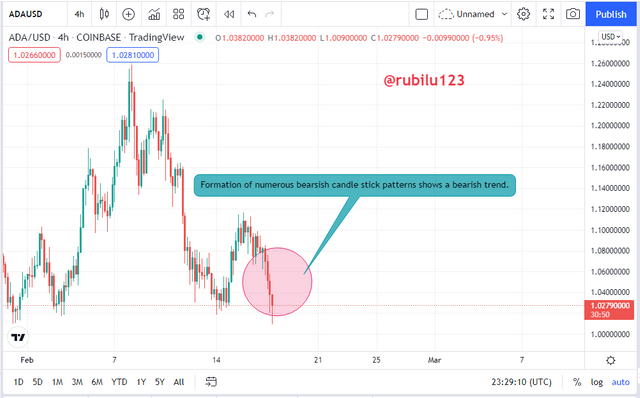
Trading view
After using a longer time frame, we were not able to spot our entry points so we will be decreasing this time frame to 4H to see if we can get an entry.
In the 4H chart we were able to locate the formation of up to 4 bearish candle sticks which show that the market is on a strong downtrend thus the market will not be reversing soon and placing our entry there will be a false signal.
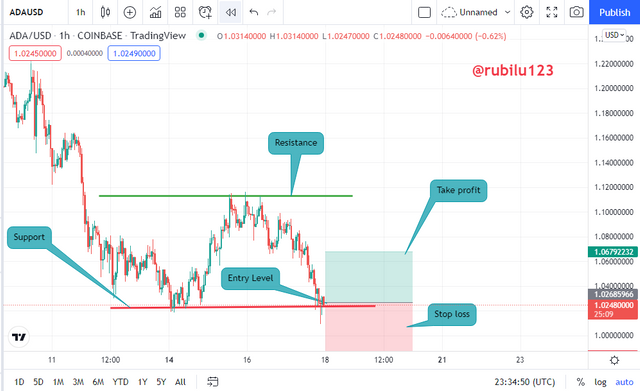
Trading view
After using the 4H chart without locating our entry level we will now decrease the time frame to a shorter one to see if we can locate our entry.
In the 1H chart I am able to spot a good support and also a good resistance. At the support I am anticipating a trend reversal upwards hence I have opened my entry position and also put up a suitable stop loss.
But to confirm my entry, I will reduce the chart to a shorter time frame.
Trading view
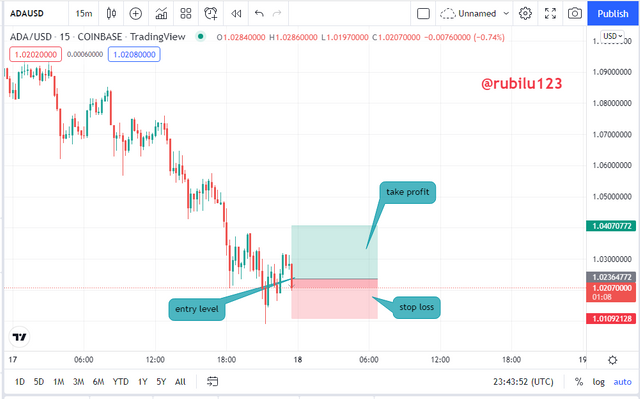
The shorter time frame which is the 15 minutes time frame is showing the market in downtrend but for this type of time frame it is good for scalpers hence a trading opportunity is spotted as a price reversal is anticipated at the support level of the last bearish candle

6.Carry out a multi-timeframe analysis on any crypto pair identifying support and resistance levels. Execute a buy or sell order using any demo account. (Explain your entry and exit strategies. Also, show proof of transaction).

For this part of the question I will be using the trading view site and then I will use the paper trading wallet to do my demo trade.
I will analyze two time frames selecting a longer time frames and a shorter time frames to place my entry for the buy/long position
Trading view
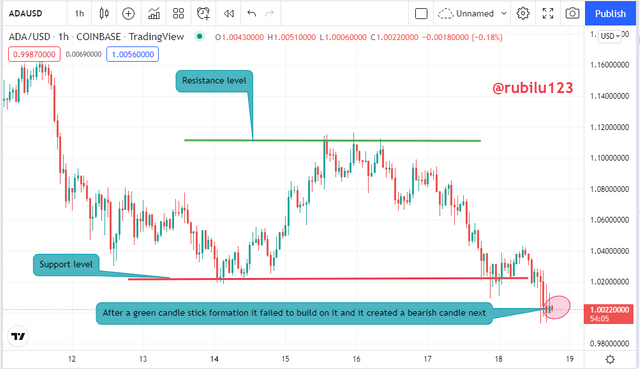
Well Cardano has been on the downtrend for a while now making small ups and downs within the day. The asset has refused to break its resistance but rather it keeps on breaking support and going downwards. At resistance the asset is seen to have a reversal in trend but at support the asset has failed to make a reversal thus we are going to analyze another time frame to see if we can take our entry there.
Trading view
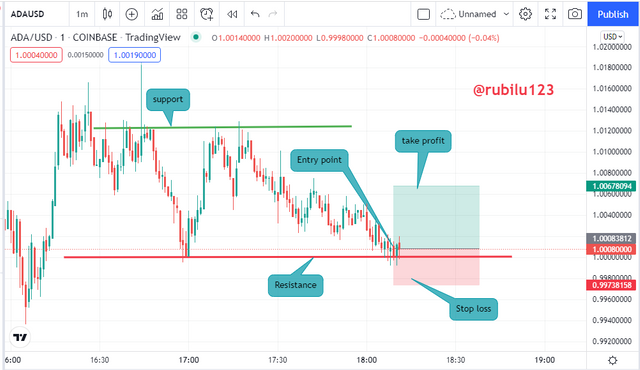
upon failing to find an entry level in the longer time frame I have changed to a shorter time frame, the 1M timeframe.
upon analyzing the 1M chart i saw a trading opportunity as this time I was acting as a scalper so I needed to enter trade as soon as possible when I realized i could make profits.
After finding support at the bottom of the chart a reversal of the market was anticipated so I placed my buy entry as the screenshot below reveals.

Trading view

Conclusion

Trading comes with a lot of analysis and when trying to enter the market and come out with profit these technical analysis patterns are always necessary to enter the market. These patterns employ the use of past prices of assets to make their analysis and from history we know that once a price has reached a certain point it will try its best to reach those levels again.
The Japanese candle sticks are common amongst traders because they are simple and easy to understand but in some instances some other form of charts provide better readings.
The multi-timeframe analysis is something I have come to realize after going through this lecture is a beneficial type of analysis where a trader can pick up the trend of the market with a longer time frame and then use this analysis to change to a smaller time frame to take his entry after finding out the direction of the market.
This has been a wonderful lecture and I have learnt a lot after completing my assignment.
Thank you.
Hello @rubilu123 , I’m glad you participated in the 2nd week Season 6 at the Steemit Crypto Academy. Your grades in this task are as follows:
Recommendation / Feedback:
Thank you for participating in this homework task.
Downvoting a post can decrease pending rewards and make it less visible. Common reasons:
Submit