
Introduction

Trading is a global trend as so many coubyri around the world leverage on trading the financial market in general, we have many trading facet's e.g, forex tradi, crypto Trading, etc all with the main target of making Profit in the end.
When we buy at a low and sell at a high price we have succeeded in making Profit but we must know when to buy and sell at this point we need so many Analysis which involves fundamental and technical Analysis all round.
Fundamental Analysis deals with news while technical analysis centralizes on reading of charts patterns, traders believe's that chart repeats themselves occasionally courtes that charts isn't going straight without retracements, this brings us to today topic of discussion, crypto Trading using zig-zag Indicator.
Show your understanding of the Zig Zag as a trading indicator and how it is calculated.?

Zig-zag as a trading Indicator can be defined as a tool used by technical analyst uses to detect reversals in the market overall at this point Support and resistance levels are basically detected, when Support and resistance area's are clearly detected you can thus see clear changes in various prices thereby knowing various short term fluctuations.
The zig-zag Indicator is basically good for trader's who makes use of a swing-high, and swing-low Indicator as zig-zag Indicator answers the question regarding that, one major thing about this Indicator is the default value which is seen at 5%.
if the settings is changed at 10% for example what it means is that Price will fluctuates at 10%, and it would be showned clearly on the chart, at this point little swings in price gives way for technical Analyst get a clearer view, as closing Price's of assets are considered in use.
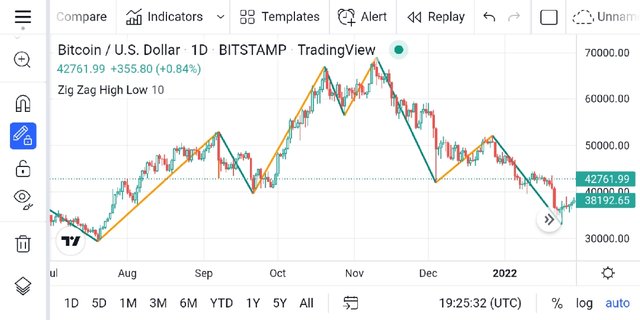
Ways on how zig-zag Indicator are been used.

The basics of their tool is total Analysis on historical data this Indicator focuses on hindsight and less predictive and focused on previous prices of securities at this point it's very difficult to know the next swing high, and swing low.
In general contest this Indicator isn't predictive but analyst still makes use of it, most trader's uses it with Elliot wave count, technical Analyst most cases makes use of historical highs and lows, making use of Fibonacci retracement tools, other trading patterns are also been considered e.g, double top, head and shoulder patterns, and double bottoms, will then be known/determined.
Zig-zag Indicator Calculations.

Before we proceed with zig-zag Indicator Calculations the formular has to be recognized which is.
ZIG-ZAG=(HL % change=X) (race= false)( Last extreme=True).
Further more if there is a change we start observing things like.
If percentage % change>=X zig-zag will be plotted.
Some basic practical's are
HL= high low.
% change= little price movement.
same extreme= equal same price as a result of multiple periods.
Calculating this Indicator you need choose price movement in %
Know the next swing high or low, totally different from the new ones that is = > %.
Line your trendline
Recap the swing high or low, the rescent one to be precise.
What are the main parameters of the Zig Zag indicator and How to configure them and is it advisable to change its default settings? (Screenshot required)

Zig-zag Indicator has two different paremeter's they are deviation and depth, they both has two various moderlities and differs significantly as a result of the way they operates.
Depth: this shows a clear represention of an indicator value as a result of the highest high showing the past value synanemous to the deviation in here its usually set at 10 without having % attached to it.
Deviation: this helps in identifying a new peak, it is constantly seen carrying % sign and expressed in 5%, it is seen courtesy price changes from the maximum zig-zag trading Indicator.
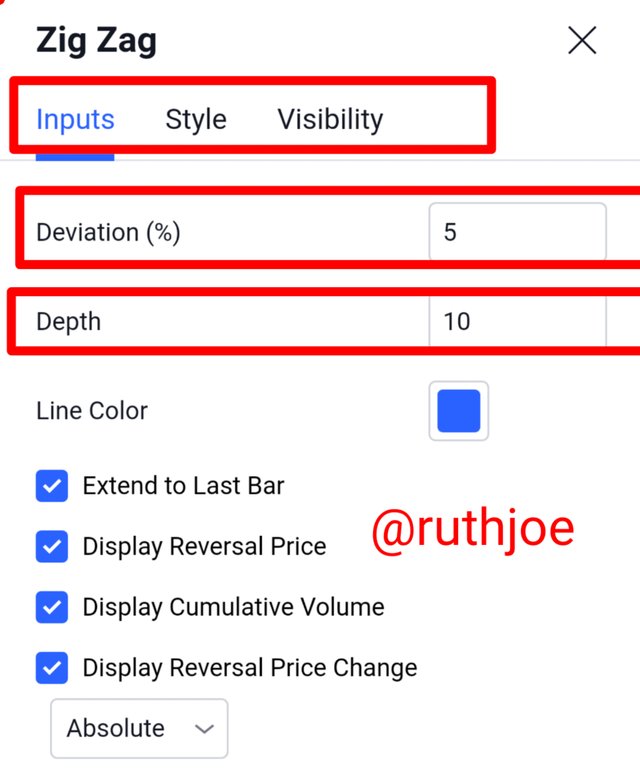
The default settings can be changed depending on what the trader needs, most trader's only considers the depth of the Indicator, we know the depth is centralized on 10, if you set it anything below that the trend will look more hysterical. as the trend it will generate will be seen enormously in continuous basics.
For me I will not change the default settings but I will place much emphasis on trend analysis considering market structures and formations we know using an indicator is pretty good but it fails most-times as fake signals are totally innevitable.
Based on the use of the Zig Zag indicator, how can one predict whether the trend will be bullish or bearish and determinate the buy/sell points (screenshot required)

Courtesy the use of zig-zag Indicator I can easily know thus predict market movements thereby knowing when to buy or sell in the market overall, first one needs to know price actions and formations in the market.
Knowing chart patterns and trend formations are key, I know my normal Support and resistance levels, let's say price is forming series of higher-highs from the Support regions to the resistance level and all of a sudden you see a reversal candle-stick like a shooting star, then reversal us bound to occur.
Predicting the market bull or bear price most-times I centralizes my idea on the peaks and trough's, these are the basics of labelling trend-lines in the market overall.
if the both peaks and trough's are ascending at that point market will go higher forming higher-highs, or higher-lows. Same thing is applicable whenever market goes in opposite direction, take a look at this below.
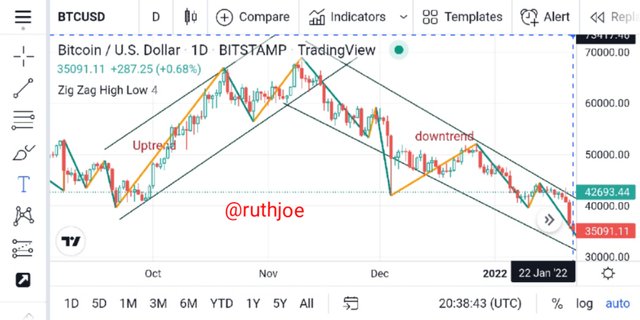
Analysis: looking at the both peaks and trough's you will understand the basicity which centralises on highs and lows, when the current peaks is higher than the previous one that is signalling Uptrend.
When the current peaks is less that is not higher than the previous one then downtrend takes center stage. With zig-zag Indicator one can easily know the near exact place where trend will head to even without too much Confluence trading strategy.
In here I will determine the buy or sell point using zig-zag Indicator first we must consider key Support and resistance levels let's look at the chart below and verify.
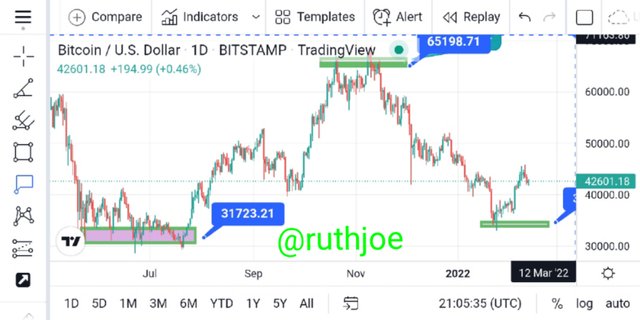
Analysis: looking at the chart above you will understand various levels of support and resistance, now determining various buy and sell points is very simple if you consider market structure.
Looking at the chart my first buy point stood at 31723.21, at this point market was a little bit ranging with my Analysis I know the next Breakout will surely go bullish so I should enter my first buy point here.
At the resistance level after highest high have retested at that point I will make my sell order from there basically at 65198.71, there was a little break and retest and later market started forming series of lower-highs, and lower-lows, at this downtrend is totally expected.
The third buy point came when market got to the Support Level to validate the previous Support level at this point which stood at 40000.00, at this point a trader can take his buy order and wait for the possible outcome, take Profit zones should be seen at the top, and stop loss seen below.
How can we determine different points using Zig Zag and CCI indicators in Intraday Trading Strategy? Explain this based on a clear examples. (Screenshot required).

Determining various entry and exit points in inter-day trading using zig-zag and CCI Indicator is key as it gives trader's the advantage to exploit the market in good phase.
Before we proceed to how to determine point's I will quickly define CCI as an indicator used to know various trends in the market, CCI which simply means commodity channel index is a very flexible Indicator used in a trending market with the sole motive of determining trends.
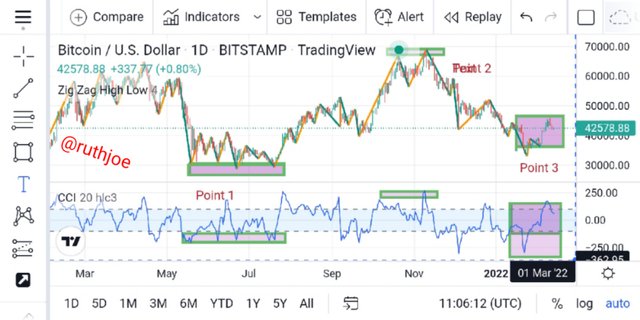
Looking at the Indicator we have three various levels which is stated as point 1, point 2, point 3, etc. The various points are strategic points which shows bullish or bearish trends in the trending market overall.
The CCI Indicator ensures that traders know the various Overbought and oversold region in the market, it basically works like the RSI Indicator but the configuration differs a little let's check out below.
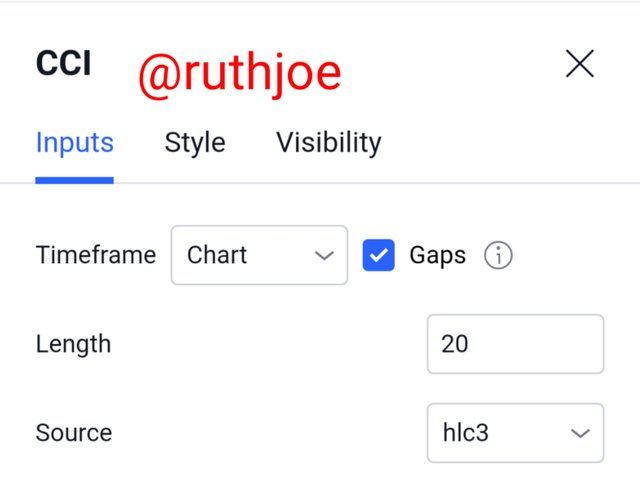
CCI Indicator configuration is quite different but one can easily determine it's parameters to be used, looking at the length it's basically centralized at 20, this is not fixed as it can be changed depending on what the trader wants.
CCI Indicator is very simple courtesy the way it should be used, intense of it's Calculations we have.
Calculations based on the price.
Consider the moving average of the price courtesy the number of periods.
The moving average can be subtracted as a result of price per day.
The mean diviation Calculation will be considered as we will divide the moving average considering the total number of days.
In inter-day Trading knowing various points are very simple if you follow price actions, you can easily spot good sniper entries and in the end maximize your Profit potential's that is simply the essence of trading.
Looking at the chart provided I used the CCI Indicator in-conjunction with the zig-zag Indicator to determine various entry and exit points in the market in general.