Introduction

Trading comes in various forms and the basic concept remain making of Profit, you Execute your buy at a low and sell at a high at this point massive Profit is made, when Executing your order be it buy or sell you need massive analysis to fulfil your enermous potential's that is making massive Profit.
Crypto trading in all ramification is very volatile so one needs to be very careful trading, also proper risk management should be employed in order to fit in, we have various types of reading overall, forex trading, crypto Trading, Volatility, etc.
The various trading facet's comes with various means at which they operates, like in forex trading you need a broker to depends on this brings us to today topic of discussion, leverage with derivative trading.
Introduce Leverage Trading in your own words.

When we talk about leverage what we mean actually is the ability to use borrowed assets to accelerate one's trading position above what will originally was available as a result of their balance. In general I will say leverage is an investment model of Making use of borrowed fund's to increase ones return of investment.
As we all know in trading you need good fund to increase your return of investment for example a trader whose account is trading at $700, will make more money trading than the individual whose trading fund falls below $700 that's practically a simple explanation, in this case the higher your fund, the higher your return of investment.
Key point to note
In general terms leverage is seen as a borrowed fund to accelerate your return of investment, as we all know everybody needs good return of investment.
When leverage is employed your trading power is pushed up in the entire market, by this I mean your ones buying strength will surely increase when leverage is employed.
So many films makes use of leverage to find their assets, thereby eliminating the ability to give out stock for capital's, is good to note that films can use Dept thereby investing in a business at this point what share holders gain will be surged up.
What are the benefits of Leverage Trading?

Before we highlight the benefits of leverage trading we should understand that leverage trading is a system that allows various trader's to pay an amount less than the actual amount of investment.
Leverage trading courtesy stock enables trader's to achieve greather position on trading without paying a complete buy price, here you will pay half the maximum amount of the Investment. Some benefits of leverage trading includes.
Maximum buying mechanism: Buying capability is one of the major benefit of leverage trading in here trader's use leverage to purchase securities that is bigger than his account, so the buying power is thus increased courtesy leverage system of trading.
Risk ratio En-coperated: one major thing trader's should bear in mind is the ratio of the account balance putting the leverage account side by side, courtesy the money that will thus be paid out.
Margin differences: let's say the risk ratio is below the up-timost requirement of maintaining the position officially been leveraged, at this point trader's will issue out margin cell this serves as a warning in the path of the investor per say.
What are the disadvantages of Leverage Trading?

Applying leverage trading helps you maximize your return of investment thereby boosting ones trading capability, just as our people keep saying anything that has advantage also have disadvantages too at this point I will highlight the various disadvantages.
High scale of looses: Whenever trading goes in the opposite direction the ability for the potential looses to be scaled gets tougher, this is one of the major disadvantage of leverage trading.
Let's say market moved against the positions officially opened be it any form of trading capability e.g margin CFD trading, forex trading, what this implies is an increase in the viscocity of liability in order to be completed with the looses from the whole trade placed.
Looses outclassing deposit: leverage isn't totally limited as a result of your total placed trades, instead it is limited to your whole trading account in general, there is always leverage catastrophe whenever you fail to maximize your risk management exposure.
High Leverage financial cost: untenability is a major problem in leverage trading expecially when trades or positions is out of term focus, long term various opened positions trends to become super expensive courtesy the profit lined up to be maximized.
What are the Basic Indicators that we can use for Leverage Trading? (Need brief details for any essential Indicators and their purposes)

Indicators are good as it assists us to know or detect the overall phase of the market, Indicator tells a trader when to buy or sell, in general Indicator gives trading signals although not all signals provided by an indicator are valid as some Indicator provides wrong signals most times.
Let me talk about one basic Indicator that can be used for leverage trading which is RSI Indicator this Indicator is a momentum oscillator that basically centralizes on determining when market is in Overbought or oversold phase, take a look at this screenshot below.
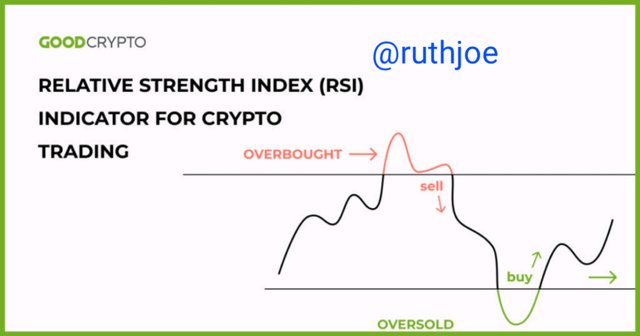
Relative strength index (RSI) is very important in technical analysis because of the role it place in determining the phase of the market overall, basically I will say this Indicator is one of the mostly used Indicator in technical analysis.
RSI scaling ranges from 0-100 as from 70 and above is regarded as Overbought, while 30 and below are seen as Oversold, in the year 1978 the oscillator came to fruition as it was created by J. Welles Wilder, today the Indicator is very popular.
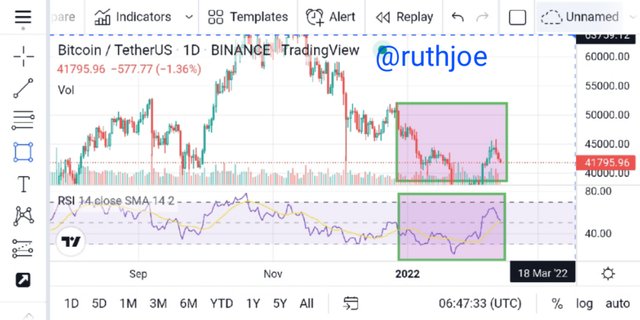
Just as I have earlier said the purpose of RSI Indicator remains measuring Overbought and oversold in the market entirely, now looking at the chart above you will surely understand the phase of the market.
Market got to the resistance level which is the Overbought region and started retracing backward, to validate the previous Support level, looking at the RSI Indicator you will understand that the Indicator moves as price moves too as well.
Market is going bearish retracing down at this point the RSI Indicator have successfully measured Overbought and oversold phase in the market entirely. Let's look at other Indicator's too all in the motive of leverage trading.
Moving Average Indicator (Confluence Trading).

Confluence trading, in here I will use multiple trading to confirm price movement, the essence remains to detect the true validity of trends in the market, just as we know one Indicator can't be relied upon as false signal is totally innevitable.
Let me say no Indicator is 100% sure no matter what so one Indicator can provide divergence while the second Indicator can prove an upcoming trend valid, let's look at the chart below to confirm true effect of confluence trading, in here I will combine moving average and RSI Indicator for trend confirmation watch and see how it works below.
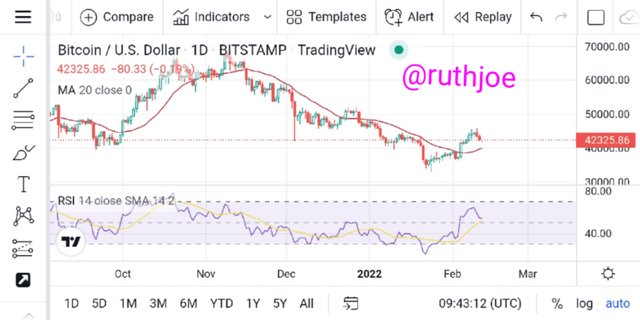
Moving Average is another popular Indicator that can be used to confirm trends in the market, this Indicator is very popular behind RSI, looking at the chart above the both Indicator played a good role in price confirmation.
How to perform Leverage Trading using special trading strategies (Trading Practice using relevant indicators and strategies, Screenshots required)

We have various trading strategies all around, each strategy one deploys is bounded on what works, some traders finds it difficult to employ an Indicator while trading they only consider the Support and resistance zones and thus exploit then.
For my special trading strategy I will use trend-line strategy with the use of relevant Indicator of my choice for the Indicator I will explore the William % rate, as we all know trend-line is a powerful tool an individual needs to excel in the market.
Trend line strategy enables you to indicate or show trend courtesy trading whenever trend-lines are been drawn on chart you can easily know when to buy or sell in the market, trend-line strategy can be used in any trading facet's e.g forex, crypto, and volatility, etc.
With this strategy you draw your lines in such a way that the lines drawn connect's various swing high and lows with various peaks, now let's say price revolves above the up lines without breaking that means Uptrend is still valid. Let's look at some examples below.
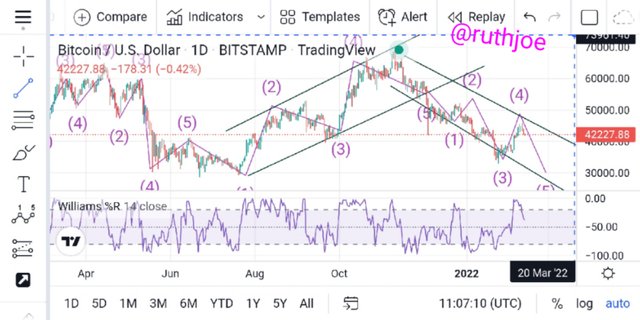
Analysis: looking at the chart above you will surely understand the various chart formations all round the first trend-line drawn cleael shows higher-highs formations that is clear Uptrend formations at some point buyers got exhausted and sellers took advantage and draged the market down.
With my trend-line strategy I was able to know that there has been a change in trend, becaus my trend-line has been broken, now looking at the Indicator been used for price conmfirmation's it looks very clear as no divergence is seen.
At the matter stages we saw a higher-low formation that is purely a downtrend (bearish) signal from the resistance level you can easily take a buy and hopefully market will surely retrace down, at this point is sell signal has been established.
Do a better Technical Analysis considering the above-explained trading strategy and make a real buy long or sell short position at a suitable entry point in any desired exchange platform. Then close that buy or sell position after appearing trend reversal signal from the Parabolic SAR indicator. Here you can also close your Buy or Sell position using any other desired Trading Method in addition to the signal coming from the Parabolic SAR indicator. However, here you must prove that trading method as a reason for closing your position. (Usually, You should demonstrate all the relevant details including entry point, exit point, resistance lines, support lines or any other trading pattern. Use at least 2X leverage and no more than 10X )

Just as the question demands carrying out technical analysis on the above mentioned trading strategy which I clearly mentioned trend-line strategy here I will make a real buy and sell with a suitable entry point as a result of my own analysis.
Before we think about going short (sell) or going long (buy), we should consider the price actions and formations when market is in the oversold region you place a buy hoping that price will retrace upward, and when market is in the resistance level you take a sell order hopefully market goes down (bearish).
One major Indicator that will be exploited is the parabolic SAR which helps to know where the market is moving, that is one major essence of this vital Indicator which most-times is seen as a stop and reverse system officially called SAR.
As we all know market moves in a zig-zag system with the help of this Indicator you can easily know a reversal point in the global market overall, with SAR you know when to buy or sell in the global market.
Whenever market is trending SAR takes effect and work's perfectly I will use this Indicator SAR to know the direction of my trends, and use other Indicator to measure the strength that comes with the current trend officially been established.
Note when a parabol SAR is seen below the current price that shows that market is going bullish, when the SAR dots are seen above the current price then bearish signal pops up.
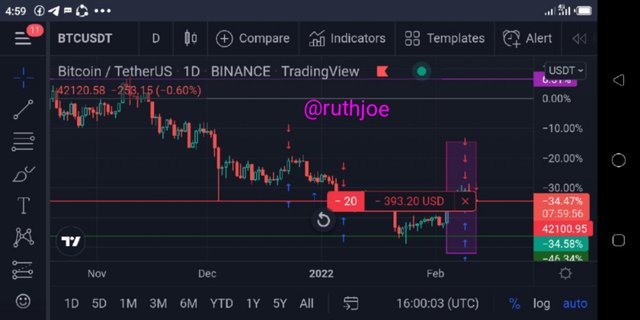
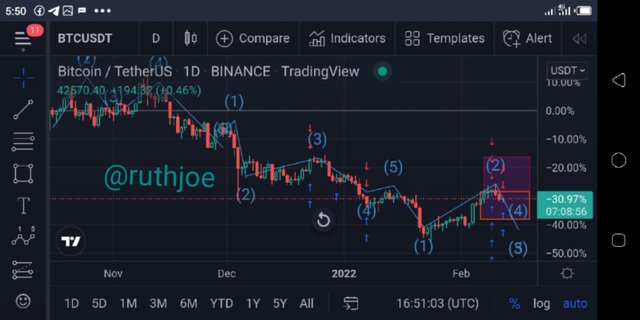
Looking at the phase of the market and market formations you will surely understand that market is pushing in the downtrend direction my analysis saw that market will retrace to point
42100.95 before retracing back/upward again.
So I quickly placed a sell order in the next chart I will practice confluence trading where I will add more than one Indicator for trend confirmation, the Indicator in question will surely be parabolic SAR,
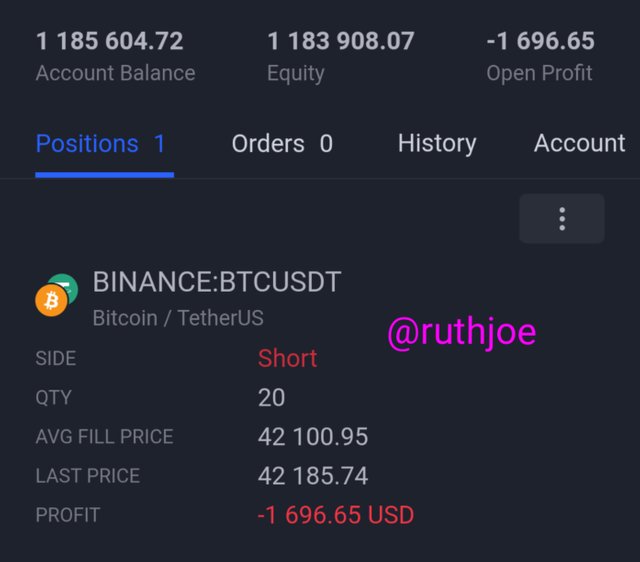
When I observed a trend reversal I closed my trade and made a buy order in-conjunction with the parabolic SAR Indicator
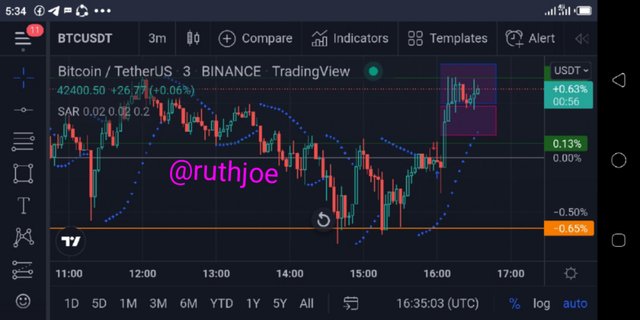
Looking at the chart above you will see an Uptrend formation, series of higher-highs when this occured I looked very deep and Saw the parabolic SAR Indicator below the trend I quickly knew that uptrend formation is in continuation.
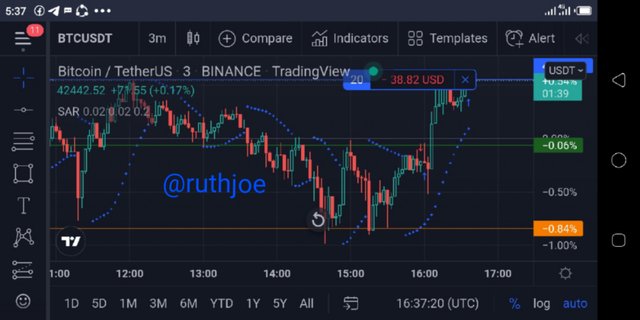
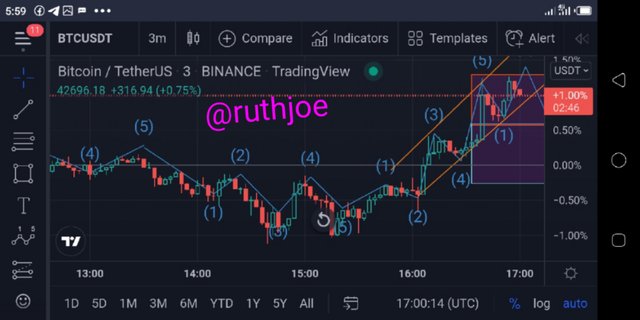
At the chart seen above you will see clearly a formation of lower-highs, with this I clearly marked out my various zones and placed a buy order.
Looking at the chart above you can observe the phase of the market with trend-lines marking the various peaks and toughs joining each levels together, when there will be a change in trend you will notice clearly.
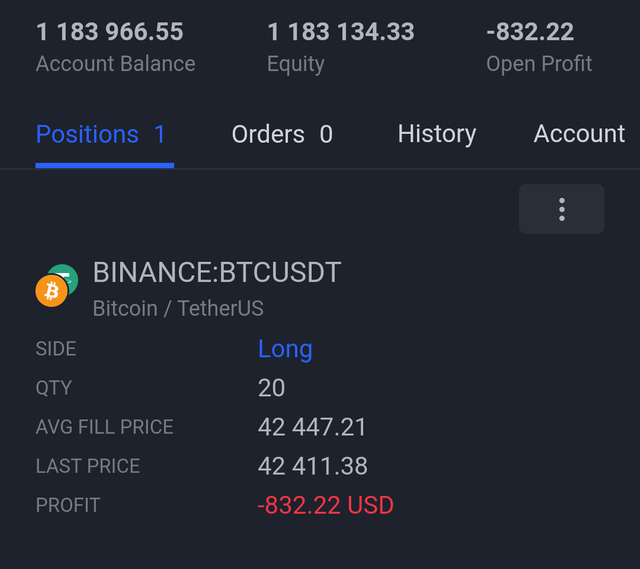
My buy order was executed and my entry point was seen centralized at 0.65, when it retraces upward it will surely comedown to retest a level of 0.13 before going with bullish or bearish again, at this point my take Profit zones will be seen at the up-zone below we have the SL stop loss.
Conclusion

From my explanations I understood that leverage is basically the ability to use borrowed assets to increase ones trading positions in order to maximize massive return of investment, in general leverage involves the use of borrowed fund to increase ones investment model's.
One of the major benefit of leverage trading is that one can easily purchase assets greather than your account here buying power is totally accelerated, and one major disadvantage of leverage system is that when trades goes either way scaling the looses will be tougher.
I highlighted various means of confirming trends which includes Confluence trading, at this point various Indicators are used for price confirmation and only one Indicator can't provide a reliable trend so I believe multiple Indicators does a great job in trend confirmation.
Thank you very much professor @reddileep for this wonderful lecture trust me I really appreciate, all screenshots sourced where collected from https://www.tradingview.com/ majorly, aside that others was the author's property.