Introduction

Crypto Trading has many moderlities simply because it is very volatile, you need explore so many things in general to confidently Explore and thus gain massive in the global trading market, knowing when to buy and sell is key as they both form the adventure of trading in general.
In trading we use various Indicators, just to confirm trends, Indicator tells you when to buy and sell, although most times some Indicator produces false signals, an Indicator and price trends might differ in that case we will say divergence has officially occured, courtesy of Genesis of this lecture here I present you with Trading with linear regression.
Discuss your understanding of the principle of linear regression

My understanding of Linear regression Indicator is centralized on the financial market, so many priciples has been introduced as to a way at which profits can be maximized from the market ever since trading market came to fruition.
One major thing here is to identify a trending market, and exploring it to the fullest without any form of bias mind-set, for you to be successful in trading feed you need the addition of multiple Indicator, at this point Linear regression Indicator is the answer.
Linear regression Indicator Analysis two various important variables which are chart Analysis, and market approach/structure, chart Analysis is elongated to price and time, if you trade your must surely recognize the fact that price moves in Zig-zag form, up and down that is.
When two different variables is analysed to define a single relationship thereby measuring a technical analysis, or quantitative analysis then we tag it a linear regression Indicator.
With the help of a linear regression Indicator, trader is bound to identify price trending point quickly, thereby knowing entry points, take Profit, etc.
In trading price and time, determines help determine various parameters of linear regression Indicator, thereby transgressing the Indicator to been applicable.
Discuss its use as a trading indicator and show how it is calculated
.jpeg)
Linear regression is surely a trading Indicator very similar to the Moving Average, although there is a slight difference that exists between then, linear regression Indicator tells you exaltly when to proceed with your buy or sell entry in the market as it moves in conjunction with price movement, one basic use of an indicator is that it gives you trading signals.
Later as the homework progress I will show how to configure and add the Indicator to chart, but for now let's talk more on how this Iinear regression Indicator is been Calculated.
Linear regressions Indicator posess an equation in the form of
Y=a+bX where
X=explanatory variable.
Y=independent variable.
b and a stands for the line slope.
Now let's proceed with the Calculation all round. Let's say we are given
a= Intersection point=9.
b= Slope=0.9.
X= Variable=80.
Applying linear regression formular
Y=a+bX
Y=9+(0.9)(80)
Y=9+72
Y=81.
Show how to add the indicator to the graph

Adding Indicator Toba graph is very simple if you follow the various steps, technical analyst usually makes use of trading view, here I already have created a free account with then.
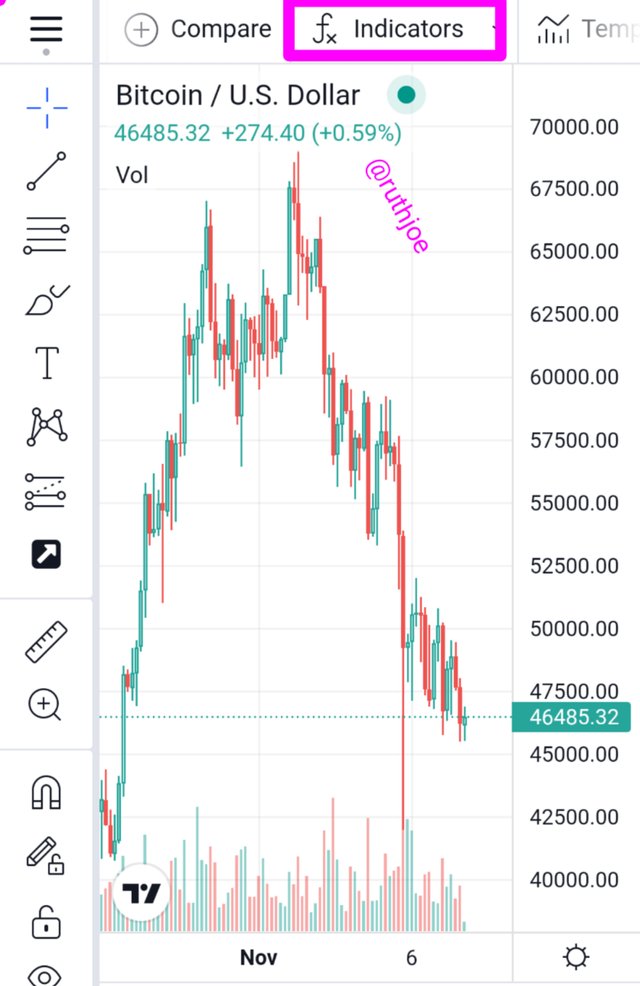
First access the App and choose a trading pair, and proceed.
After that at the landing home-page click on the fx bottom and search for linear regression.
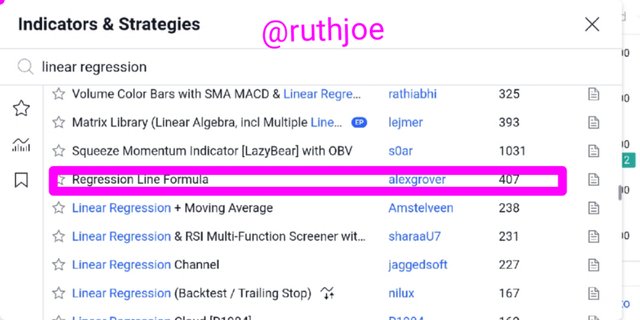
In the process of searching for linear regression so many Indicator type will appear but choose regression line formular.
Click on the regression line formular, and thus it will be added to your chart.
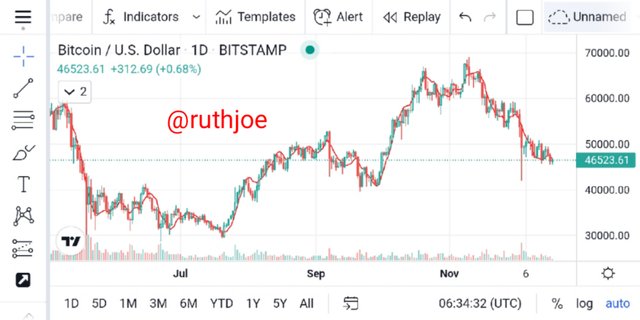
Looking at the chart inter-phase you will find out that the regression line formular added to the chart is showned vividly, I observed that the line moves as price moves too as well.
How to configure the linear regression indicator and is it advisable to change its default settings? (Screenshot required)

- Let's talk about configuring the Indicator first, later I will hint on the changing of default settings, to configure this Indicator first at the landing home-page click on the settings axis, and proceed with the parameters there.
After you are done clicking on the settings axis, another phase will pop up where you will access the inputs, the length can also be seen as the period.
Any Indicator value depends on the total number of corresponding bar, many Indicators makes use of a 14 days period as settings, here I will add the 14 days period watch and see how it works.
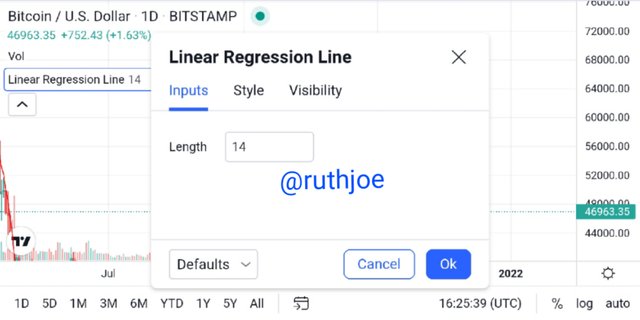
- Another parameters are listed after clicking on the settings axis, now let's access the style, here you explore on how you want the colour of your Indicator and the lines, look at this below.
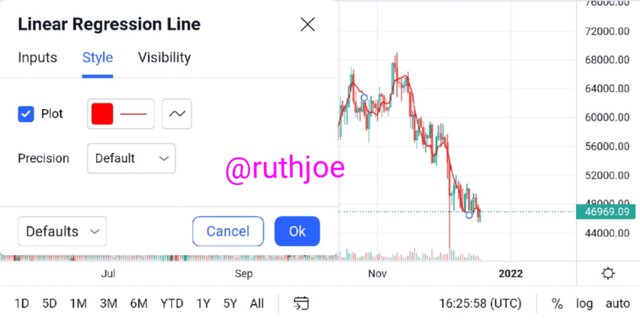
- Looking at the chart above you will see that I choosed a red colour and a red tick line, this is practically my style.
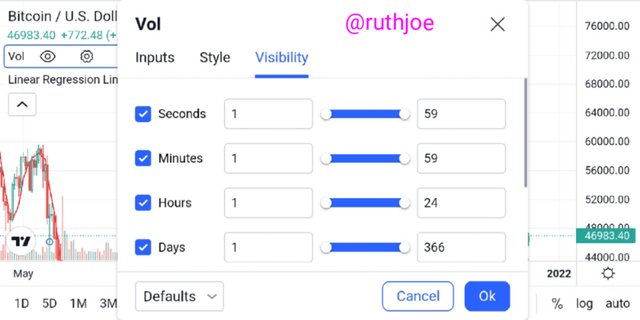
- The next on the list is visibility, this has to do with the vision aspect, how you are going to view the listed parameters matters, courtesy this I choosed a concise visibility.
Looking at the target of changing the default settings, I will say it's very much optional it depends on the trader and what he wants to achieve.
some might want to use period 66, according to Colby, and Meyers, they believe 66 period is the best. Everything is optional it all depends on the time period you are exploring.
How does this indicator allow us to highlight the direction of a trend and identify any signs of a change in the trend itself? (Screenshot required)

Nice question I will say looking at how the Indicator appears in a chart you can easily identify the next trend, the Linear regression line moves in-conjunction with price movement, although for me I will love to combine this Indicator with another to get good and clear entry and exit point.
Knowing the direct of a trend sometimes doesn't just depends on the Indicator in use as the occurance of divergence isn't or cannot be totally eradicated, you will agree with me that Indicator moves as trend/moves as well.

Now identifying change in trend first you need to be familiar with market structure and formations, knowing your support and resistance is also very important.
Now let's do little Analysis on the chart provided below in order to identify the authenticity of trend and identifying a change in trend.
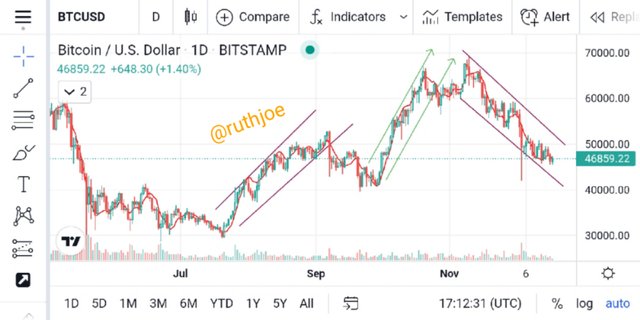
With the chart above you can easily identify the direction of a trend and identity sign of Change/trend reversal, I marked out various structures for easy understanding, looking at the chart each trend formation moves as the Indicator moves too thereby forming a new highs and lows.
Based on the use of price crossing strategy with the indicator, how can one predict whether the trend will be bullish or bearish (screenshot required)

With the crossing strategy one can easily predict the phase of the market depending on the crossing, as we have seen trend moves as the linear regression line moves, so as an experience trader all you need do is to wait a little for the trend and the Linear regression line to intersect, here we call it cut.
We all know that in trading candle-sticks let's us know what is happening in the market, now let's say a candle-stick cut pretty higher then a valid buy signal has established, a buy signal here depends on the nature of candle-stick formation.
Now let's say there is a retracement and a candle cuts lower, then market is in a downward spiral, then we explore a sell, practically saying a sell signal has been established.
- We all know that candlestick close and open, we also have open and closing price of each periods, here closing price must be higher or lower depending on the period in use, the length of a candle should always be out into consideration.
Now predicting as a result of cut, if two linear regression line touch, the candle-stick been formulated determines what will happen next, for example if cut occurs and we see a bullish candle-stick engulfing the previous candle-stick then we enter a long position, vice versa.
I have explained enough so far now let me give a chart to determine various cuts, practically where Linear regression lines touched, thereby identifying bullish or bearish trends.
As we know bull means buy, and bear means sell, in a market identifying when to buy and sell is key, I will provide two separate charts indicating the both bullish and bearish cuts, let's see the viscosity of the candle-stick formed and what happened next.
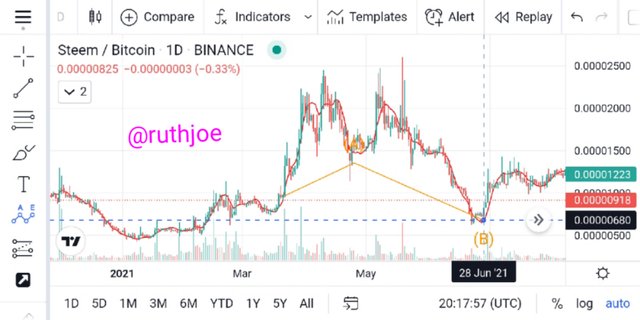
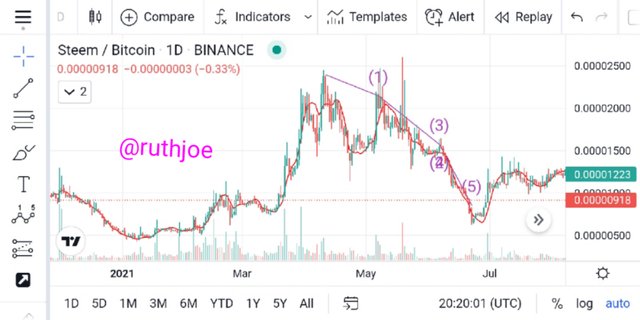
The both screenshots provided clearly shows various cuts, now knowing whether the trend will be bullish or bearish basically determines on the upcoming structure about to be retested. Looking at the bearish trend price has been forming a high-lows.
forming long candle-stick engulfing the previous ones, each time such happens there are always cuts, where price and the Indicator meets, same thing is applicable to the predicting on bearish trend too.
Explain how the moving average indicator helps strengthen the signals determined by the linear regression indicator. (screenshot required)

Before I proceed explaining how moving average helps to strengthen signals determine by linear regression Indicator, I will hint more on what moving average is all about.
There is no much difference that exists between Linear regression Indicator to moving average as they both are basically used to analyze data points thereby galvanizing series of concise averages, moving average (MA) is an indicator basically used by technical analyst.
One of the main motive of a particular stock is to make a price data genuine thereby creating a more standard average price set, moving average has two models which are the simple moving average and the exponential moving average please note, but I won't go deep into this.
As i have earlier explained when cut happens in Linear regression Indicator, there are always a strong signal, be it buy or sell, here I will add the moving average (MA) with the Linear regression Indicator and determine the strength of signals provided by both Indicator, let me see how the moving average helps strengthen the Linear regression Indicator.
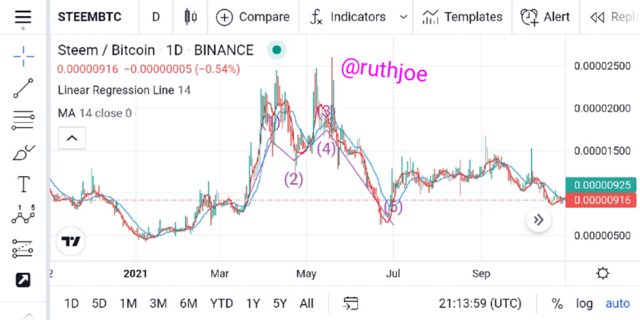
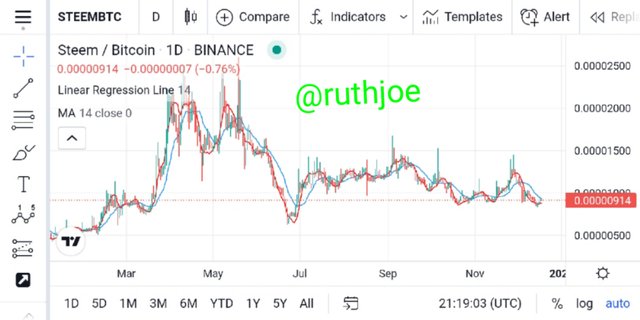
Looking at the screenshots above I successfully added MA which is the moving average Indicator, from the look of things the result was productive courtesy the fact that the moving average validated the Linear regression Indicator making the signal i provides more rigid.
Looking at the screenshots been provided I marked a possible buy zones, trust me using this Indicator together is of a great intent, you guys reading this post should learn how to combine this both Indicator for productive result.
Do you see the effectiveness of using the linear regression indicator in the style of CFD trading

Before we talk about the effectiveness of using Linear regression Indicator in the style of CFD, let's first know what CFD entails, CFD can be defined as a trading strategy exploited by technical traders to know price movement in the market. Take a look at the chart below.
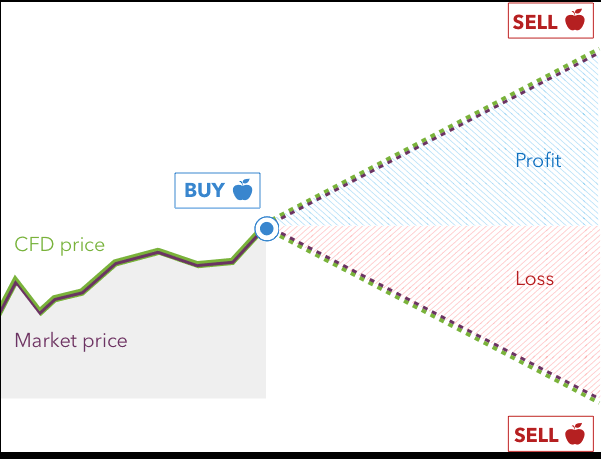
The full meaning of CFD is contract for difference, this strategy gives you an insight to buy when market moves down to support level, and sell when it gets to resistance level.
CFD pays a great difference in price consolidation and settlement in price and trends that exists between open and closing price of as assets.
CFDs gives various investors lime-light to trade assets in their corresponding facets, upwards and downwards spiral over a specific period of time.
Back to the question for me I see a great effectiveness using this type of strategy to trade Linear regression, as an experience trader I can easily buy and sell knowing the phase of the market at the appointed time, support and resistance is key here.
The strategy is commonly used by experienced traders at Large note this.
Show the main differences between this indicator and the TSF indicator (screenshot required)

Before I proceed it will be nice we know what TSF means, to my understanding I will define TSF as a linear regression Calculation that spot a regression value bar making use of a square fit method, sometimes I regard this TSF as a moving Linear regression, almost similar to themoving average.
Formular for Calculating the TSF is
- Y=mx+b.
| Different CFD Indicator | TSF Indicator |
|---|---|
| CFD is seen as a financial derivative trading strategy where you observe key difference courtesy opening and closing price of a particular assets | TSF makes use of a square fit method aimed at plotting each bar with current regression value making use of a least square fit method. |
| CFD is mostly used in trading ETFs, meaning Exchange Traded Funds thereby speculating price movement of various commodities. | it isn't used in trading ETFs instead it's basically used to reflect trends over a period of time, it can also provide trend continuation. |
| CFD trade on OCT, meaningover the counter, courtesy various brokers that is aimed at organizing supply and demand in the market. | TSF trade surges in a straight line direction, when price climax above the TSF line then we regard it as a bull trend, it doesn't trade on OCT. |
List the advantages and disadvantages of the linear regression indicator

Anything that has advantage will also have disadvantages too, here I will highlight the both facets of parandy, from my homework task I explained the principle of linear regression where I said it centralizes on the financial market, since all we are talking centralizes on trading.
| Advantages | Disadvantages |
|---|---|
| Linear regression output co-efficient is very much easy to interpret and very much easy to understand, using Linear regression Indicator to trade you as an experience trader doesn't have to employed a bias mind-set. | if features in the market are somehow seen correlated, it automatically affects performance of the market I general, as we all know corollation means two things acting opposite to each other. |
| This Indicator become lesser complex when the variable posess linear partnership | this Indicator sometimes provides false signals and are basically prime to overfitting. |
| This Indicator helps in identify price trending point very quick and explore then thereby maximize Profit's | Using this Indicator along might be catastrophic intense of divergence in price movement. |
Conclusion
Thank you very much professor @kouba01 for this wonderful lecture you presented Trust me I really learnt alot, you took Time explaining well, from my homework task I was able to highlight the basic of Linear regression Indicator where I defined that Linear regression Indicator basically centralizes on the trading financial markets, I said that because this Indicator is used to trade and maximize profits.
I also pointed out that this Indicator is very much similar to moving average, although there are differences shall, sometimes the way they are been Calculated differs and the formular to use totally differs too, but this Indicator tells you the exact spot or point where you can execute your out and sell orders which for me forms a Basic aspect in trading the financial market.
I also hinted on CFD where I hinted that it is basically used to to know the movement of price in the market, this strategy is one of a kind you need to try it. Once again thank you very much professor @kouba, as I await your honest review.
- Please note all screenshots used that isn't sourced are all the author's own, any screenshot collected from other sources are properly referenced, thanks for nothing this.