Introduction

Trading the crypto market is risky because the market itself is very volatile so for you to maximize Profit you need explore various means to explore the market in good phase, knowing the right time to make your buy and sell entry is key.
When price of as assets is low, people tend to acquire more of that particular assets, when it surges up they sell the assets and make Profit, that comes with great prospect that is all what trading entails in great facets.
For me till tomorrow I still believe that Confluence Trading is the best, by this I mean addition of multiple Indicators to maximize and Analyze the market phase structure overall, as we all know price moves in Zig-zag form, by this I will talk extensively on Ultimate oscillator.
What do you understand by ultimate oscillator indicator.

From my understanding I will say ultimate oscillator can be defined as an indicator used by technical Analyst to detect the phase of a trending market, this Indicator was officially invented by Larry Williams in the year 1976 this Indicator is very similar to stochastic oscillator, the major objective of this Indicator is that it measures the momentum price of an assets at a given timeframe.
With this Indicator you are capable to detect buy and sell signals basically generated courtesy/following divergence, when we talk about diverge what it means is that the ability of an indicator and price in the market doing different thing all together. So following
divergence this Indicator generates buy and sell signals.
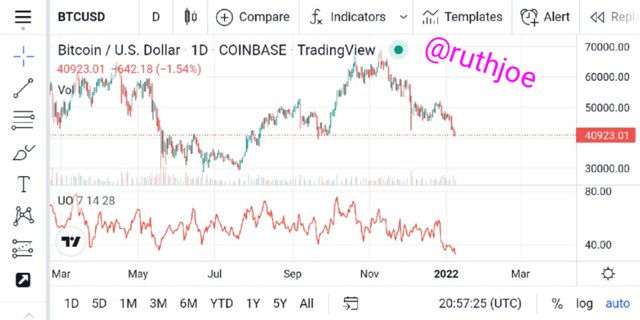
Ultimate oscillator makes use of three various time-frames courtesy Calculations and they are 7,14,and 28.
Looking at the three various time frames the most shortest one is the one with the least weight.
Using this Indicator you generate a buy signal when we get a Bullish divergence, when it Lower's at 30 using the Indicator, then later it surged up above divergence high.
Whenever we witness a bearish divergence then officially sell signal will come to fruition, for the divergence it Should be high up to 70, looking at the oscillator it should fall Courtesy divergence low.
How to calculate ultimate oscillator value for a particular candle or time frame. Give real example using chart pattern, show complete calculation with accurate result.

How to calculate ultimate oscillator is very simple if you follow the footprint and styles of moderlities watch and see how it unfolds, first you need to know the various formulars been used.
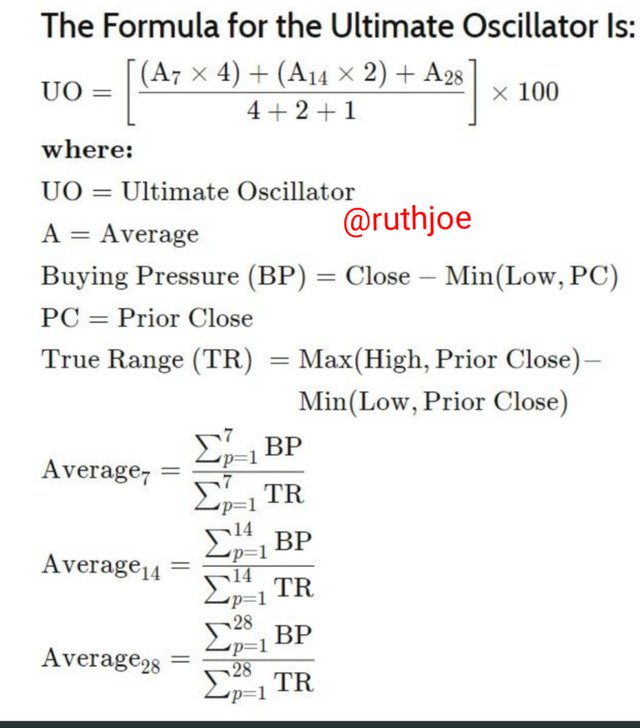
Breaking the various parameters down I will say
A=Average
BB=close-min
PC=prior close
TR=True Range
Paremeter has been listed next here I will show love practically how this Calculations are done in great phase, I will show it live using real examples watch and see.
Here I will Calculate buying pressure in conjunction with True Range using three various parameters which includes high, close, open, and low, looking at the chart below we have 7,14, and 28 period overall.
I have already stated the formular to be used here I will proceed to formulating a table for preference for the period it will run from 1-28.
| Period | buying-pressure | True-Range |
|---|---|---|
| 1 | 0.1 | 0.34 |
| 2 | 0.2 | 0.45 |
| 3 | 0.3 | 0.57 |
| 4 | 0.06 | 0.28 |
| 5 | 0.17 | 0.64 |
| 6 | 0.20 | 0.43 |
| 7 | 0.50 | 0.75 |
| 8 | 0.07 | 0.26 |
| 9 | 0.04 | 0.23 |
| 10 | 0.34 | 0.28 |
| 11 | 0.09 | 0.29 |
| 12 | 0.01 | 0.83 |
| 13 | 0.20 | 0.21 |
| 14 | 0.26 | 0.16 |
| 15 | 0.34 | 0.12 |
| 16 | 0.74 | 0.22 |
| 17 | 0.09 | 0.28 |
| 18 | 0.24 | 0.32 |
| 19 | 0.08 | 0.47 |
| 20 | 0.35 | 0.12 |
| 21 | 0.14 | 0.19 |
| 22 | 0.15 | 0.36 |
| 24 | 0.19 | 0.67 |
| 25 | 0.06 | 0.38 |
| 26 | 0.26 | 0.79 |
| 27 | 0.02 | 0.42 |
| 28 | 0.11 | 0.49. |
The data has been formulated let's proceed to calculating A7, A14, and A28,
A7= total sum of Bp in the last 7days/total addition/sum of ATR in last 7 days.
1.53/3.46.
0.15
A14= this includes total sum of buying pressure (Bp) in previous 14 days/sum of ATR in the last 14 days.
1.94/5.72
= 7.66.
A28= Total sum of Bp for the last 28 days/sum of TR for the last 28 days.
By this we have
- 4.71/10.55
0.446 approximately 0.45.
In summary putting the various figured gotton into the formular we have
UO=[(A7X4)] [(A14X2)]+A28/7100*.
0.15X4 + 7.7X2 + (0.45)/7*100.
0.6+15.5+0.45=16.55
16.55/7=2.4 approximately
2.4x100=240.
Concluding here we will get
- 240..
How to identify trends in the market using ultimate oscillator. What is the difference between ultimate oscillator and slow stochastic oscillator.

How to identify trend in a trending market is pretty simple if you know your market structure and formations, price actions here stands a great effect overall, just as the question demands I will show how trends can be identified easily.
Stochastic oscillator works more like the Ultimate oscillator, although there are slight difference, trends in the market are pretty much knowing entry and exit points in the market, knowing when to buy and sell are key here.
Here I will add Ultimate oscillator in a chart through this I will explore and identify various trend be it buy or sell trends watch and see how I will execute this almighty task.
Identifying Uptrend, ultimate oscillator.
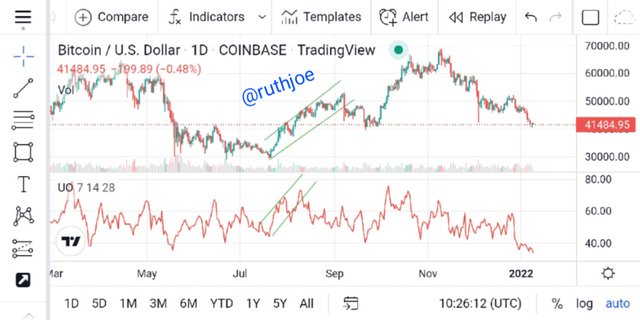
Looking at the chart BTC/USD you will see a formation of Uptrend which is higher-high it continues untill there was a change in trend when higher-high formation was formulating there was little retracements.
Identifying trends comes with great prospect now looking at the ultimate oscillator it went in conjunction with price movement in the market, at that point it was pretty simple to identify trending formation in the market overall.
Identifying Downtrend Ultimate oscillator
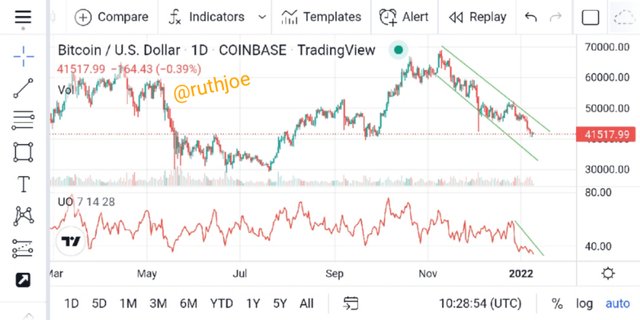
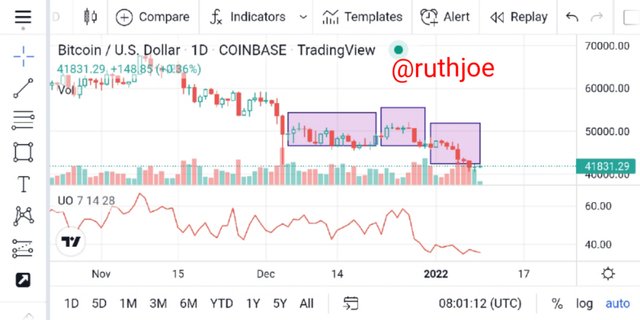
Looking at the chart above you will see that there was a formation of lower-lows which signifies a downtrend, meaning that market is going down big time, sellers are pretty much taken over the market.
During the Downtrend formations there was a minor retracements but market continued in downtrend phase, looking at the Indicator been used it showed clearly Downtrend, the Indicator moves in conjunction with price movement.
Difference between Ultimate oscillator and stochastic Explained.

This two Indicators are very powerful as they looks alike but in general there is a great difference that exists between the both, just as the question demands I will surely highlight the various diffrence among the both of them.
| Ultimate oscillator | Stochastic oscillator. |
|---|---|
| Ultimate oscillator posesses a look back period which consists of three. | Stochastic oscillator possess only one look back period/timeframe. |
| Ultimate Indicator doesn't possess a signal line | Stochastic oscillator possess a signal line. |
| Ultimate oscillator produces signal courtesy divergence | Stochastic oscillator signal looks difference due to differences in Calculations. |
| Ultimate oscillator has a three step means at which divergence can be traded | Stochastic oscillator has one model method of trading divergence. |
How to identify divergence in the market using ultimate oscillator, if we are unable to identify divergence easily than which indicator will help us to identify divergence in the market.

Before we talk about Identifying divergence we should understand that divergence simply means the ability of the market to move practically towards opposition to the technical Indicator been used overtime.
Whenever divergence occurs that means the current trend trying to be established is getting weak, we have bullish and bearish divergence, normally the technical Indicator used is supposed to move in-conjunction with price movement in the market over time.
Whenever divergence happens the current trend been established will thus Begin to change direction over a specific time, here I will add the ultimate oscillator and other technical Indicator to identify divergence.
For me I still believe that confluence Trading is the best, adding multiple Indicators gives you the ability to detect trends and divergence easily, let's proceed further.
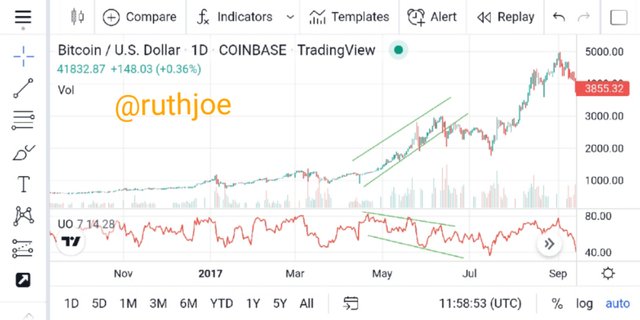
Using ultimate oscillator I was able to identify divergence easily without any form of stress at this particular time I won't add any other Indicator again for divergence identification.
what is the 3 step- approach method through which one can take entry and exit from the market. Show real example of entry and exit from the market.

The three step approach at which one will use to execute a buy or sell other are as follows.
For buy Approach we have.
The trader must know various formations occuring at that particular time of asking for bull you take a buy, the actual market price will digress down, at this point the ultimate oscillator will start going up.
As an experience trader you should watch your UO line if it crosses 30 band line that is oversold, at this point sellers are decreasing in number.
lastly before you enter the market please check the UO line if it's above the divergence line before migrating to executing your entry.
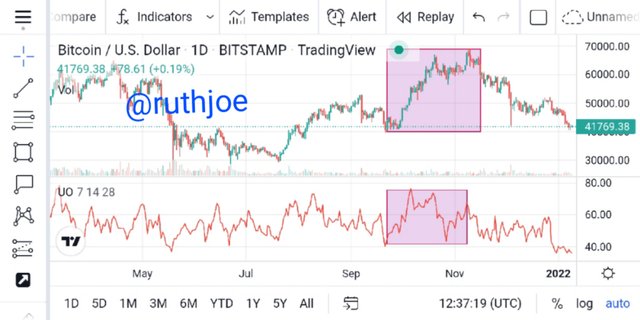
Looking at the chart above I took my entry at 41769, basically at Support zone, and might decide to put my T.p at 60000. The my stop loss at 30000.
For sell Approach.
Here market structure/formation must be at a Downtrend phase/Bearish divergence which means that price will soon start reallying up, at this point the UO will start falling.
Look at the Indicator line crossing, if it has surpassed 70 band line that is over-bought at this point buyers are decreasing downtrend will soon take place.
At the low of the divergence the UO must be seen revolving there for proper signal to be established.
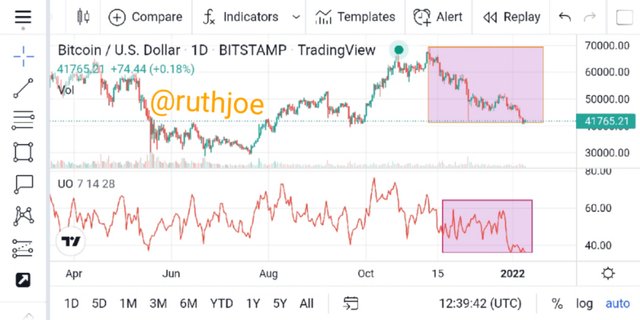
From the chart currently is a sell trend so price is at the resistance level, so my entry should be at 70000, my take Profit should be around 50000. And my stop loss should be above my Entry point.
What is your opinion about ultimate oscillator indicator. Which time frame will you prefer how to use ultimate oscillator and why.

This Indicator is a nice one for me I prefer to make use of it big time, just as we know this Indicator relies on various time-frames with this time frames you can easily Identify buy and sell orders courtesy divergence.
I hinted on what divergence is all about earlier in this home-work task this Indicator demonstrate little/fewer divergence as a result of multiple Indicators construction overall.
For the timeframe I prefer lower timeframe as signals been generated are good for trading capability, knowing how to use ultimate oscillator is pretty simple one thing here is that you should be familiar with her band lines.
This Indicator is based on range bound, which ranges between 0and 100, very similar to RSI Indicator although there are Great difference as a result of how they work, when the Indicator is at 30 we call it Oversold , above 70 we tag it overbought.
One thing to consider in this ultimate oscillator is that of when trading signals are generated, basically when price moves in opposite direction basically based on three step phase/methods.
Conclusion

Thank you very much professor @utsavsaxena11 for this wonderful lecture presented by you, from my homework task I explained that ultimate oscillator was developed by Larry Williams used to measure the viscosity of price momentum across various multiple timeframes.
I also hinted that Ultimate oscillator makes use of three various time-frames courtesy Calculations and they are as follows 7,14,and 28, I took time to explaining how they are been Calculated overall. Thank you very much professor I really appreciate.
Cc;@utsavsaxena11.