
The steemit crypto academy community has become very helpful considering acquiring knowledge about crypto currencies. Before I present my homework post, I would like to acknowledge professor @asaj and the crypto currency’s academy community as well as all the other professors for bringing us such a wonderful opportunity to educate us about the crypto world.
Today's topic is "Vortex Indicator Strategy".
- In your own words explain the vortex indicator and how it is calculated.
We learn from our lecture Vortex Indicator is one of the various indicator developed by Etienne Botes and Douglas Slepman in the year 2010 and initially meant to render technical analysis of stocks and commodities.
However it’s used to predict the trends in the stock market either the market showing a bullish trend (uptrends) or a bearish trend (downtrend).
It indicates the new trend or the continuation of an existing trend within the stock markets.

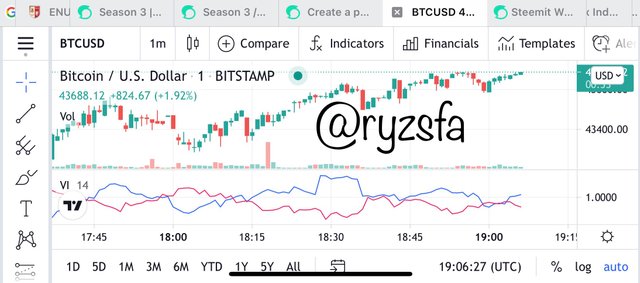
Considering the screenshot of vortex indicator above we can determine that Vortex Indicator have two oscillating lines of two different colors which are the blue and red lines. The blue line represents the positive vortex indicator or VI+ Which indicates a bullish trend thus a positive movement of the market. Also, the red line represents the negative vortex indicator or VI- which illustrates a bearish trend thus a negative slope of the market. Whenever the blue line crosses over the red line there is a bullish trend whiles a bearish trend is realized when the red line crosses over the blue line.
However, when VI+ is below VI- and then crosses above VI- to assume the top position of the trendlines indicates a buy signal. When VI- is below VI+ and crosses above VI+ assuming the top of the trendlines , a sell signal is occurred.
how vortex indicator is calculated
The Vortex Indicator establishes the trend of the market when the current and last period of the market is assessed. A positive market is illustrated when the current period is high and the last period of the market is low whereas a negative market is given when the current period is low and the last period is high.
Moreover, period aides in determining a trend. A 14 period-window is recommended for better and accurate results although other periods can be used to determine the trends.
To know the range, the current high minus the current low and then the previous close is subtracted from both the current high and the current low.
2 .Is the vortex indicator reliable? Explain
To be precise indicators are basically for prediction and predictions ain’t perfect. Indicators however might not give accuracy of 100% but will offer an accuracy quite reliable. As to it being reliable depends on how it is read and used.
the work of the indicator is to help the trading in technical analysis of the asset in other to offer a good buy and sell order. In order for an indicator to be reliable it should be trusted for its technical analysis and hence offers a good percentage of accuracy.
The most outstanding way to see if the Vortex indicator is very reliable is to make confirmation from other indicators. If only same or very similar results are shown proves wealthy of being reliable to use.
3 . How is the vortex indicator added to a chart and what are the recommended parameters? (Screenshot required)
Illustrated below is how we can add the Vortex indicator to a chart.
In order to add the Vortex indicator to a chart,
- visit tradingview.com
- launch a chart of BTC.
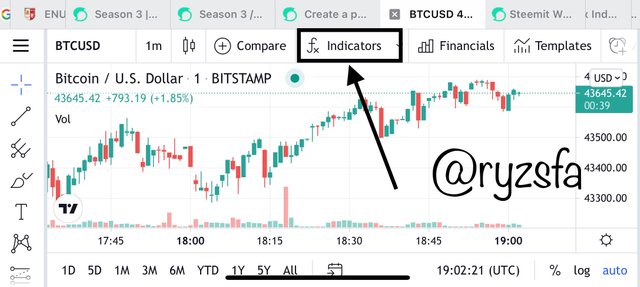
- tap on the Indicator option to put the Vortex indicator.
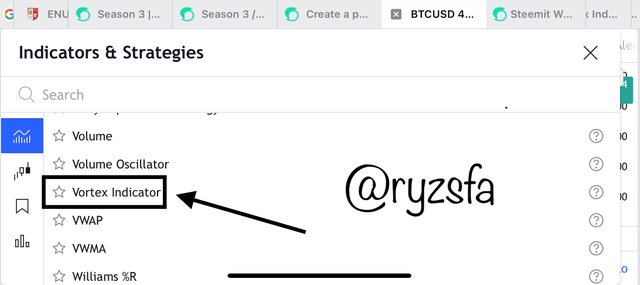
- scroll down to sellect vortex indicator
- Display of the Vortex indicator showing has been added to the chart.
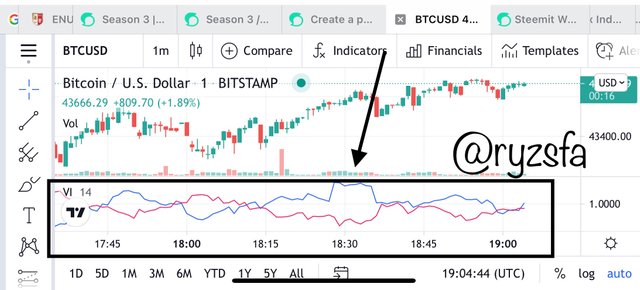
now we need to configure our indicator before we use.
- So here tap on the TV to see more options.
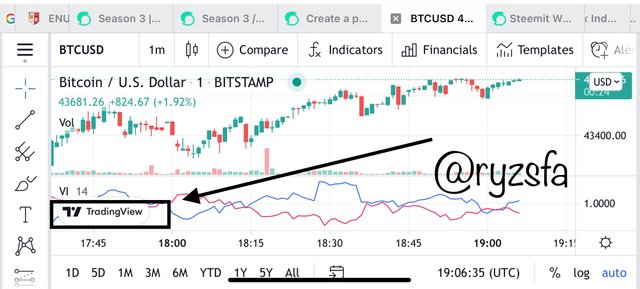
- tap on the settings from the menu.
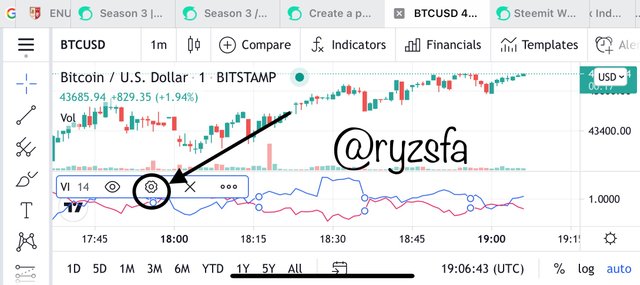
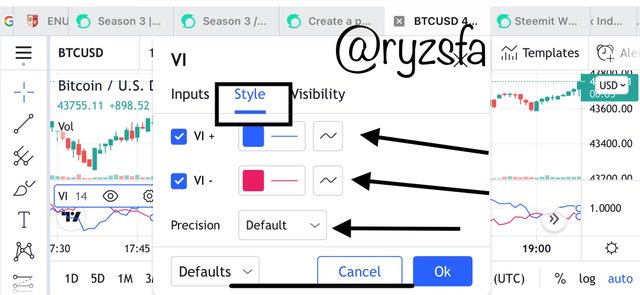
- now choose the style and how you want the indicator to look. Prefer default.
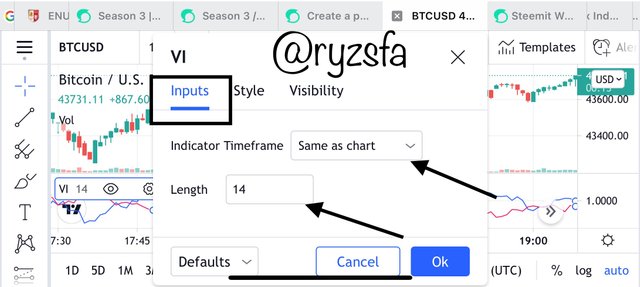
- Tap on the Input ,there we will put the Indicator Timeframe same as Chart and the length preferred.
- set the Visibility to Default. Most preferable.
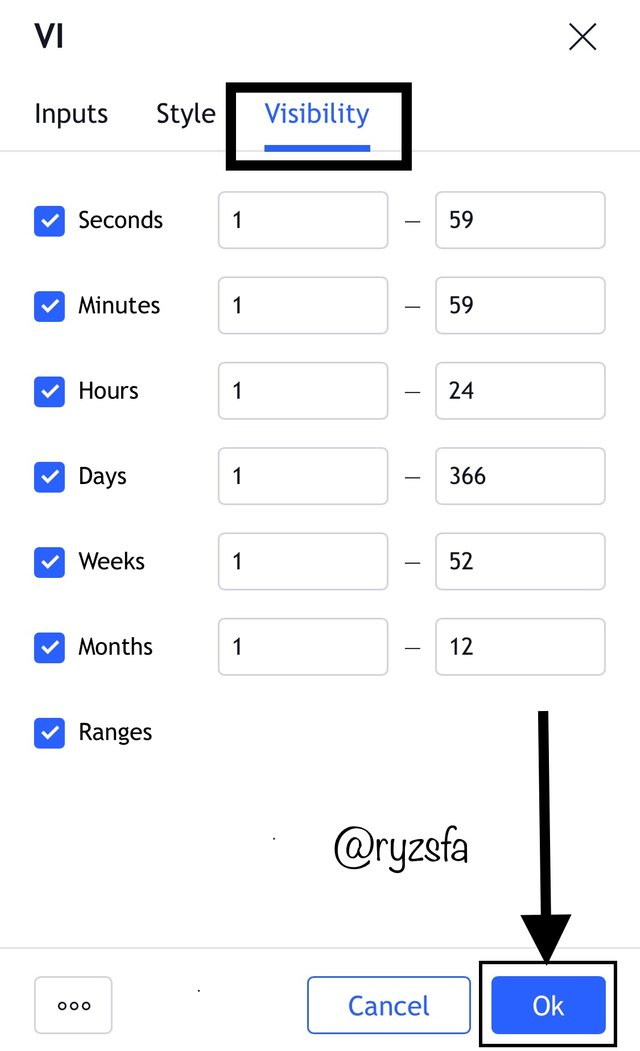
4 . Explain in your own words the concept of vortex indicator divergence with examples. (Screenshot required)
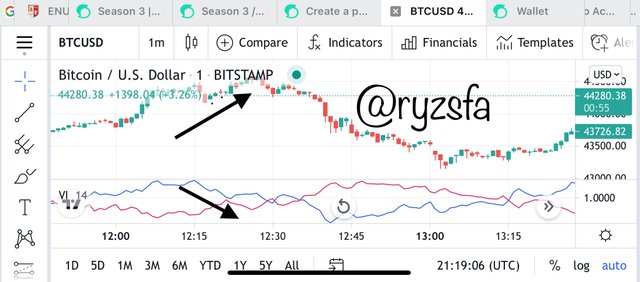
Divergence happens when the chart and the indicators moves in the opposite directions. Bullish and Bearish Divergence are the two types of divergence of vortex indicator.
The Bullish Divergence in the vortex indicator fundamentally refers to the positive movement of trend. A bullish divergence occurs when the blue line moves higher high while the chart price move in a lower high trend. During such trends it illustrates buy signals to traders.
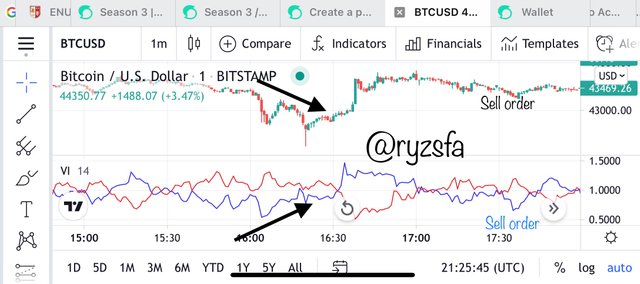
The Bearish Divergence occurs when thet blue line goes into the lower high while the chart price moves up for a while and falls . During such trends it illustrates sell signals to traders.
5 . Use the signals of VI to buy and sell any two cryptocurrencies. (Screenshot required)
BTCUSD
Purchase was made because the signal given by VI crossed the +VI and -VI lines, and it is a good signal for us to enter to buy the asset, so I get the assets at a lower price.
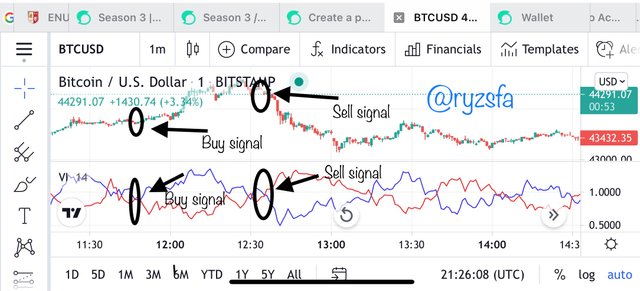
the signal appeared again given by VI, which signal this time was a signal indicating to sell the assets gaining profit.
In conclusion
I will say this was a very good topic which was very well explained by our professor @asaj. Thanks to your incredible explanation for I have understood the lecture very well.
Hi @ryzsfa, thanks for performing the above task in the sixth week of Steemit Crypto Academy Season 3. The time and effort put into this work is appreciated. Hence, you have scored 6 out of 10. Here are the details:
Remarks
You have demonstrated a decent understanding of the topic.
Downvoting a post can decrease pending rewards and make it less visible. Common reasons:
Submit
Thanks for the feedback prof.
Downvoting a post can decrease pending rewards and make it less visible. Common reasons:
Submit