
The topic presenting on is "Crypto Assets and the Random Index (KDJ)".
Before I commence, I’m very glad to be part of the crypto Academy community which offers a lot of help and assistance in acquiring knowledge about the crypto world.
I would like to accord professor @asaj and the crypto academy community as well as all the other professors my complete appreciation for their good works done and for giving us such an opportunity to educate us about the crypto world.
Moving on to my homework, I’ll like to do my presentation rationally base on the question
1 . In your own words define the random index and explain how it is calculated
2 . Is the random index reliable? Explain.
3 . How is the random index added to a chart and what are the recommended parameters? (Screenshot required).
4 . Differences between KDJ, ADX, and ATR.
5 . Use the signals of the random index to buy and sell any two cryptocurrencies. (Screenshot required)

1. In your own words define the random index and explain how it is calculated
KDJ indicator which is also called the random index. It’s a tool used by traders to enable them predict the price changes and also the trend turnovers of assets. It helps traders make technical analysis of the market in order to make predictions and also see the trend turnovers.
The KDJ indicator is a similar indicator compared to the stochastic indicator but has an extra oscillating line used to show overbought and oversold.

On the KDJ indicator we have the red and green background space where the red indicates sell and the green for buy. Also we have the blue and orange oscillating lines show on the diagram above just like the stochastic. See diagram below;
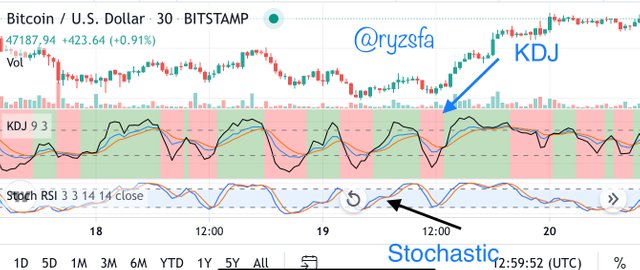
These two oscillating lines represents the K-line and the D-line. The K-line crosses the D-line to represent a buy or sell moment to traders. The k line is the blue line as seen in the image above, the D line represented by the red line hence the J line is the black line seen in the image above.
How random index is calculated.
The calculation of KDJ is quite difficult if not for an expert. To calculate for KDJ, you first have to know the RSV price of the day by calculating for it.
- RSV=(C-L) ÷(H-L) ×100
Where C is the closing price for the day, L is the lowest price of the day and H is the highest price of the day. The RSV price varies between 1 and 100.
Therefore after finding the RSV price for the day, you can then calculate for the K value, D value, J value of the random index.
Formula for calculating the K ,D and J values of a particular day X is illustrated below.
K value = 2 / 3 × the previous day K value + 1/3 × the X day RSV price.
D value = 2 / 3 × previous day D value + 1/3 × day K value
When there is no previous K and D value, normally 50 is used in place.
Hence the
- j value = 3 × X K value - 2 × X D value

2. Is the random index reliable? Explain.
Basically indicators are tools for making technical analysis in order to predict the market trends and price movements of assets. However we say predictions ain’t perfect and can’t be solely reliable since it’s only a forecast which is not backed by a proof of fact. Indicators ain’t completely reliable base on that fact, however an indicator like the KDJ is known to be a leading indicator and not a lagging indicator due to it’s performance. To choose between the KDJ indicator being reliable or not, I will say it quite reliable since it offers a win percentage though it’s not perfect of a 100% but a reliable percentage.
The KDJ indicator is to help traders make profit by using it to make technical analysis of the asset to be traded on.
In order for an indicator to be reliable it should be trusted for its technical analysis and hence offers a good percentage of accuracy.
The most advisable and perfect way to see if the KDJ indicator is very reliable is to make confirmation with other indicators as to If only same or very similar results are shown proves wealthy of being reliable to use.

3. How is the random index added to a chart and what are the recommended parameters? (Screenshot required).
Follow the follow steps below in order to add the random index to a chart.
step 1
- visit tradingview.com.
- From the home page, tap BTCUSD option just user the search bar to display your BTCUSD chart.

screenshot taken from tradingview.com
Step 2
- Atfer the BTCUSD chart is displayed, find indicator icon illustrated below in the screenshot an tap in it to proceed.
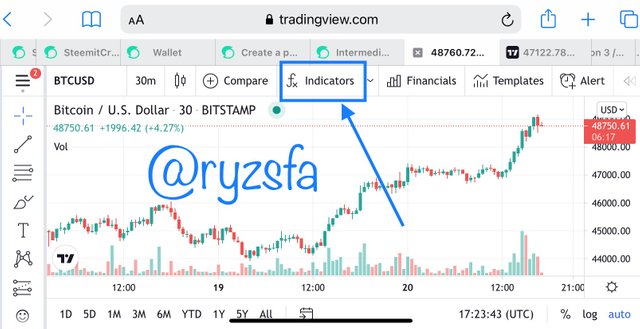
screenshot taken from tradingview.com
step 3
- make a search for KDJ in the search option provided indicated with a red arrow in the screenshot below.
- then tap on the first KDJ as shown below with my blue arrow.
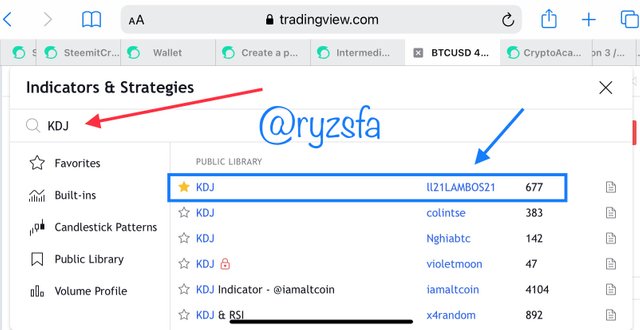
screenshot taken from tradingview.com
step 4
- The KDJ indicator will be displayed on the chart as shown below.
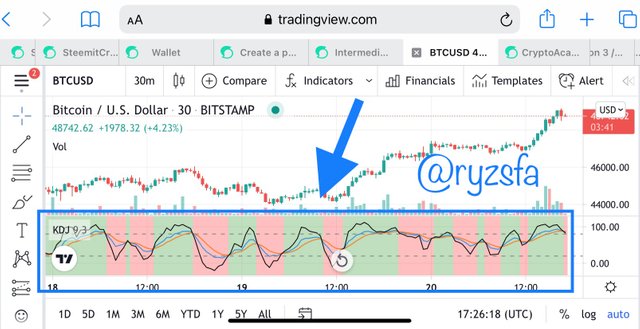
screenshot taken from tradingview.com
KDJ indicator.
what are the recommended parameters?
- we have the inputs, style, and visibility which can be located from the setting icon on the KDJ diagram.
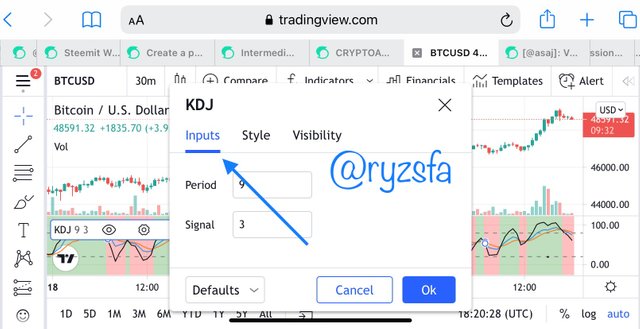
The inputs option which displays the number of periods and signals.
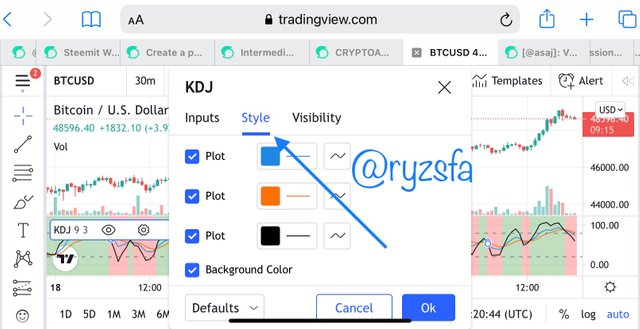
Screenshot of the style options which helps in changing the appearance of the diagram
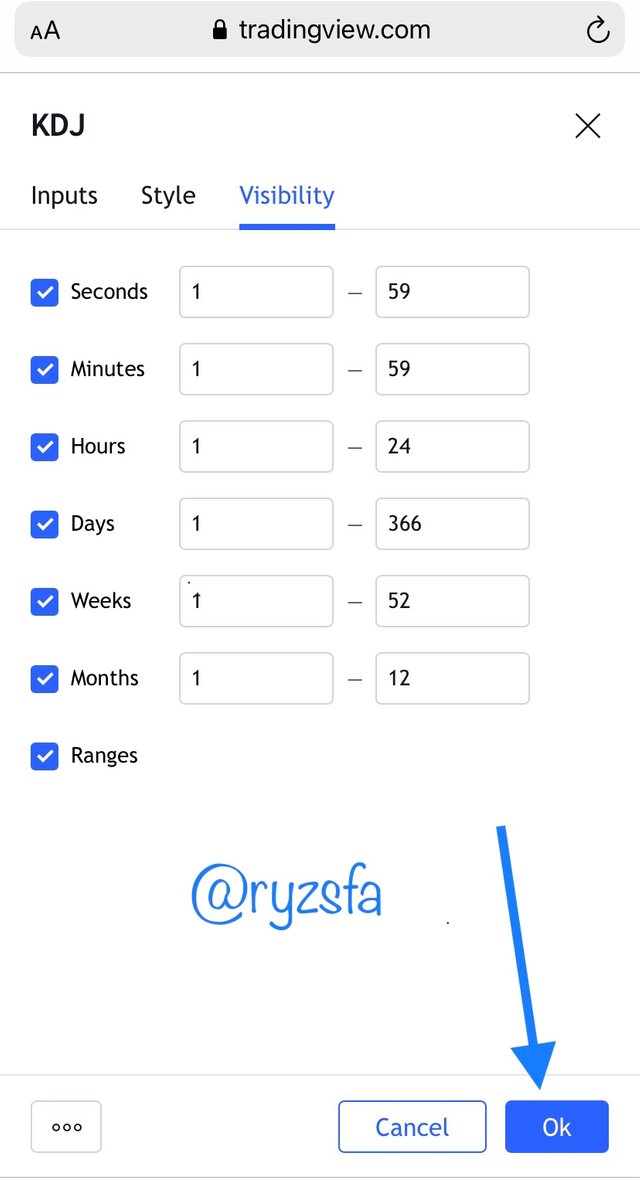
Here is the visibility option to determine the time frame to display.
Also we have the;
K line: The k line represents the blue oscillating line in any of the diagrams.
D line: The D line also represents the red oscillating line in any of the diagrams.
J line: This is the black oscillating line in the diagram below which is used to determine overbought and oversold.

Overbought and the oversold: as indicated in the screenshot below where the section circle blue indicates the overbought because it’s said to be above the line which is 80% and the section indicated with red circle indicates oversold since it’s also below the line which is 20%


4. Differences between KDJ, ADX, and ATR.
KDJ
This is a tool used to predict the market trends of assets. It helps traders realize an entry and exit point in the market where overbought and oversold is key. It’s consist of three different oscillating lines named K line ,D line and J line with a default colour of blue, red and black respectively.
ADX
It’s a tool used to calculate the strength of a trend. Moreover it’s gives a strong clarity of a trend whether an uptrend or a downtrend which helps traders to make decisions from the the profitable trends. ADX systematically shows the strength of trends with its values ranging from 0-100 in ascending order of strength ; weak to extremely strong trend. Moreover it’s used to confirm trends.
ATR
it’s a tool used by technicians or traders to measure the volatility of the market over a period of time. It allows traders to calculate accurately the daily unpredictability of an asset by using simple measures. It does not indicate the price direction but rather it’s volatility.
ATR can be used by traders to enter and exit trades in the market when it measures a reliable trend.
Considering the diagrammatic differences of the three types of indicators, Presented below is the indicators KDJ, ADX and ATR on TradingView.com
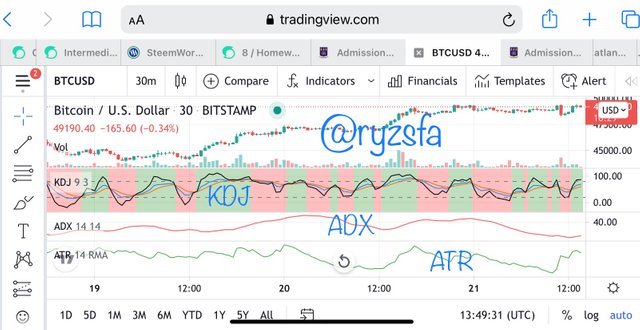
For the screenshot above it’s note that the KDJ consists of three different lines whiles the others have only one line. However you can use the ADX with DMI - and DMI + to make it 3 lines.
| KDJ | ADX | ATR |
|---|---|---|
| It’s used to predict market trends of assets | It’s fundamentally used for calculating strength of a market trend whether a weak, strong, very strong or extremely strong trend | it’s basically used for calculating the volatility of an asset |

5. Use the signals of the random index to buy and sell any two cryptocurrencies. (Screenshot required)
Using the random index signal to buy a cryptocurrency
Using a demo account to trade on paperview on TradingView.com.
Using the ETH/USDT pair in buying ETH
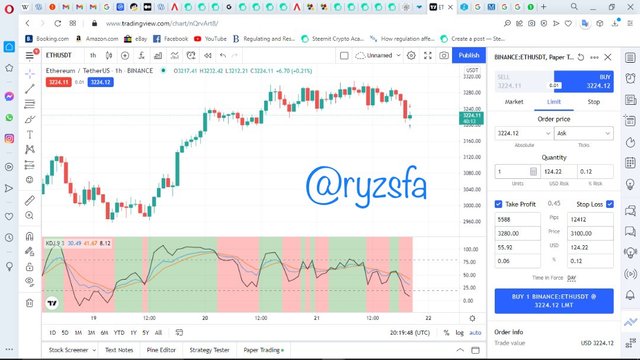
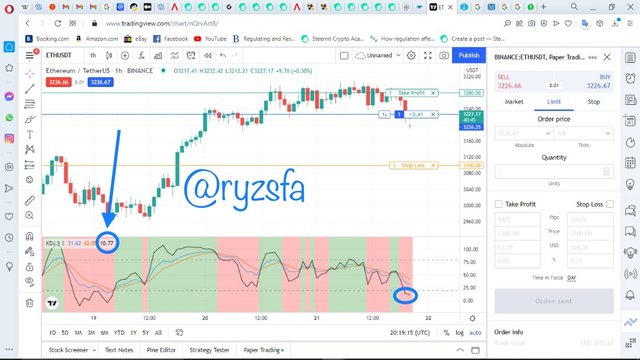
the chart above, indicates that the KDJ is 10.77 which signals a buy entry. So we place the order and set a stop loss below the support levels.
Using the BNB/USDT pair in buying BNB
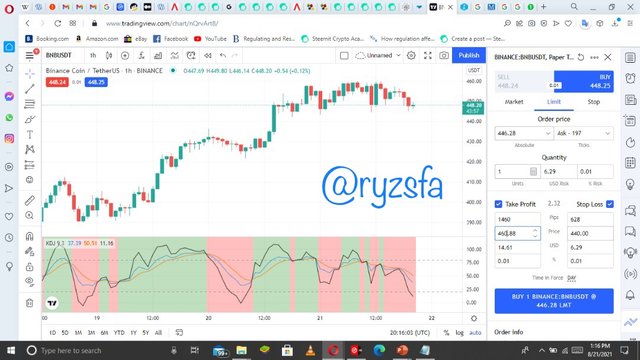
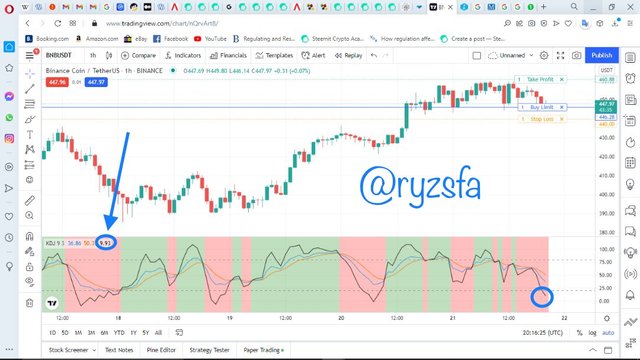
the chart above, indicates that the KDJ is 9.93 which signals a buy entry. So we place the order and set a stop loss below the support levels.
In Conclusion
I will say this was a very good topic which was very well explained by our professor @asaj. Thanks to your incredible explanation for I have understood the lecture very well.
You've got a free upvote from witness fuli.
Peace & Love!
Downvoting a post can decrease pending rewards and make it less visible. Common reasons:
Submit
Good job @ryzsfa!
Thanks for performing the above task in the eighth week of Steemit Crypto Academy Season 3. The time and effort put into this work is appreciated. Hence, you have scored 6.5 out of 10. Here are the details:
Remarks
Overall, you have displayed a good understanding of the topic. You have performed the assigned task excellently. However, your work could benefit from clearer explanation of terms. Thanks again for your contributing your time and effort to the academy.
Downvoting a post can decrease pending rewards and make it less visible. Common reasons:
Submit
Thanks for the feedback prof.
Downvoting a post can decrease pending rewards and make it less visible. Common reasons:
Submit