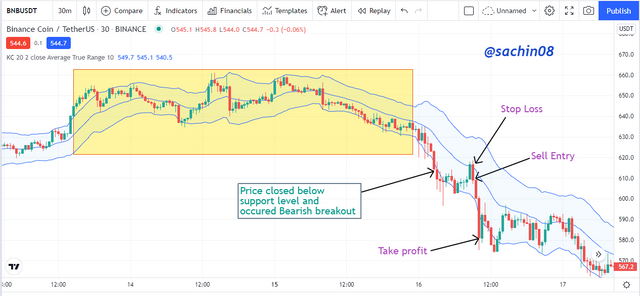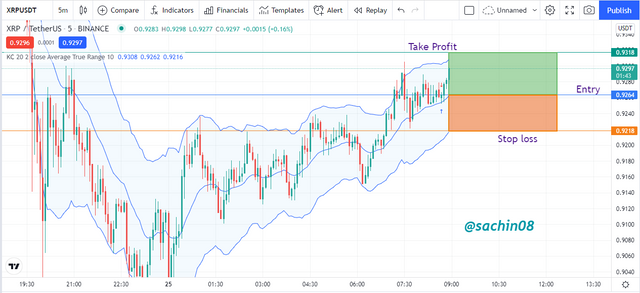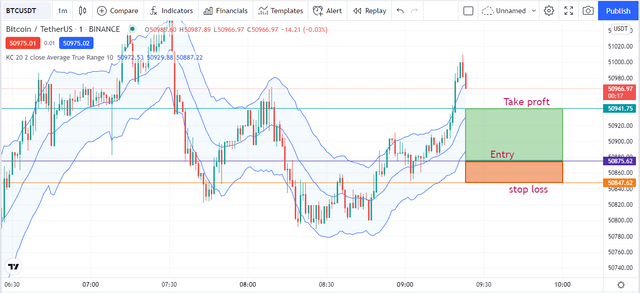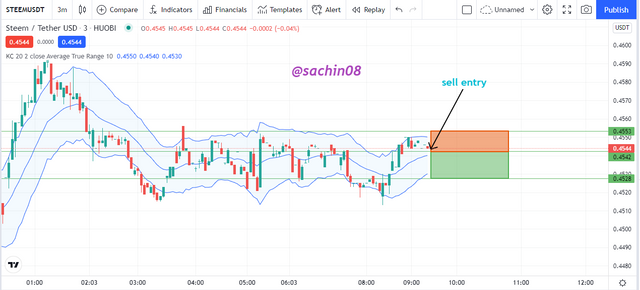
Q.1: Creatively discuss Keltner channels in your own words.

In the trading of a cryptocurrency asset, it is obvious for use to fo to find the volatile price variations and so the crypto market is considered as a dangerous and risky market for low experience people and for the people of good experience as well.
However, we have different types of indicators and tools which allows us to to analyze the volatility and the behavior of any crypto asset in a better way and by the use of these indicators we can have a knowledge before something happen in the market and we can get ready for that.
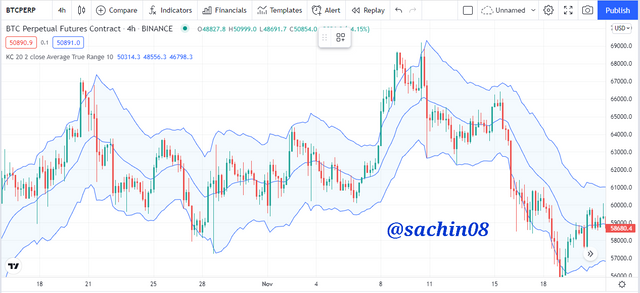
In this question i will discuss about the keltner channels. The Keltner channel indicator basically works in basis of the volatility of the price in a particular time period. This indicator was created by Chester Keltner in the year 1960. The indicator creates a channel which is established by three lines: an upper line, a lower line and a central one (i.e. EMA). It can confirm the price's directional move with the formation of upward and downward angles.
The working of Keltner channel indicator is somewhat similar to the bollinger bands indicator which I have dicussed in previous posts. However, Keltner channel is not as sensitive for the changing of price and it is made of EMA and ATR (Average True Range) and that is why, this indicator is better in calculation and also not give many false signals like the bollinger bands indicator.

Q.2: Setup Keltner Channels on a Crypto chart using any preferred charting platform. Explain its settings. (Screenshots required).

To add keltner channel indicator on chart, visit on any platform where charts can be shown. I have used tradingview platform to perform this task.
After reaching trading view, open chart of any asset and then click on the indicators option (represented as fx) on the top of chart.
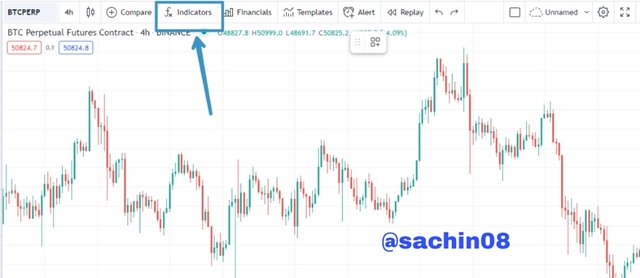
screenshot from tradingview
Now, in the search bar type keltner channel or simply keltner and among the results, click on the keltner channels and the indicator will be applied to the chart.
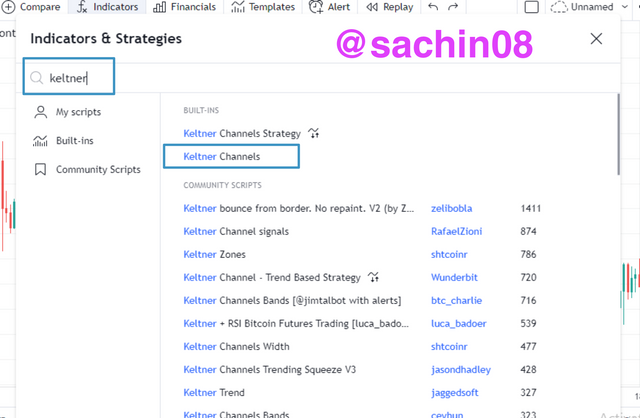
screenshot from tradingview
In the screenshot below, we can see that the keltner channels indicator has added to the chart.
screenshot from tradingview
• Settings of Keltner Channels:
To reach the settings of Keltner channels, click on the name of indicator on the top left corner and click on settings icon as shown below.
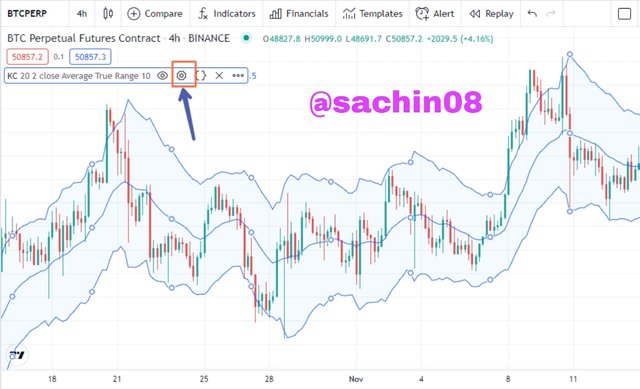
screenshot from tradingview
Inputs:
The tab in settings is inputs tab. The default lenght in the keltner indicator is of 20, the default Multiplier is 2 and the default ATR length is set at 10. These default settings can be changed according to the suitability of trader.
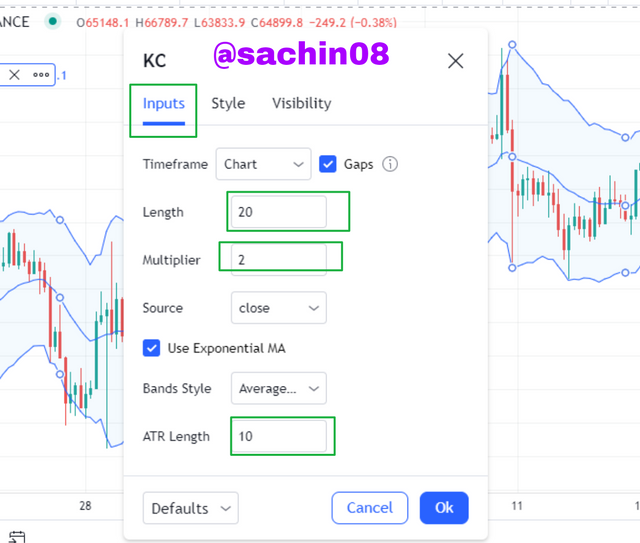
screenshot from tradingview
Style:
In the style tab of keltner indicator, we can change appearance of the indicator. The options included in this are color, thickness, upper bands, basis, lower bands and background, which can be changed according to the suitability of trader.
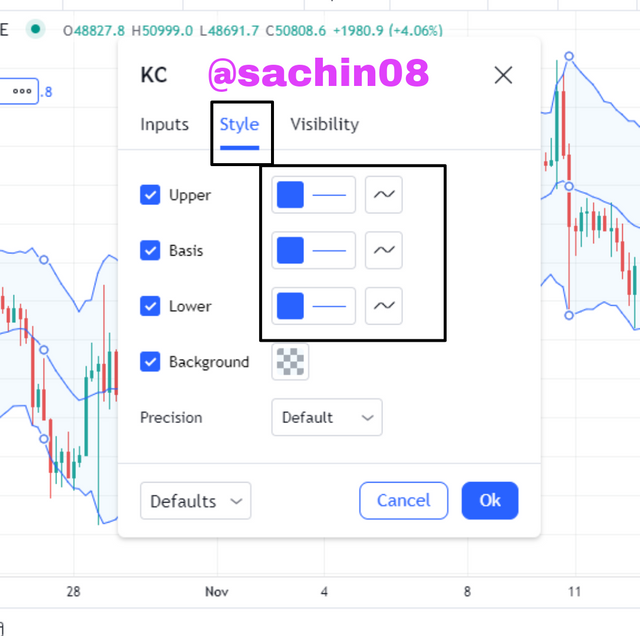
screenshot from tradingview

Q.3: How are Keltner Channels calculated? Give an illustrative example.

Calculation of Keltner Channel Indicator:
To represent the concept of calculation, there is a mathematical expression which the keltner channel indicator has and the expression (formula) is given below:
For upper band,
Upper band = EMA + (2 × ATR)
For lower band,
Lower band = EMA - (2 × ATR)
For middle line,
Middle line = EMA
Where:
EMA = Exponential moving average (depends on the selected observation period)
ATR = Average True Range
Multiplier used is 2.
Example to illustrate the concept:
Let,
EMA period = 20
Length of ATR = 10
Multiplier = 2
We will calculate the Keltner channel indicator. Hence
For Middle line;
Since, Middle line = EMA
So, Middle line = 20
For Upper Band;
Since, Upper Band = EMA + (2 × ATR)
Upper Band = 20 + (2×10)
Upper Band = 20 + 20
Upper Band = 40
For Lower Band;
Since, Upper Band = EMA - (2 × ATR)
Upper Band = 20 - (2×10)
Upper Band = 20 - 20
Upper Band = 0

Q.4: What's your understanding of Trend confirmation with Keltner Channels in either trend? What does sideways market movement looks like on the Keltner Channels? What should one look out for when combining 200MA with Keltner Channel? Combine a 200MA or any other indicator of choice to validate the trend. (Separate screenshots required)

TREND CONFIRMATION
Uptrend:
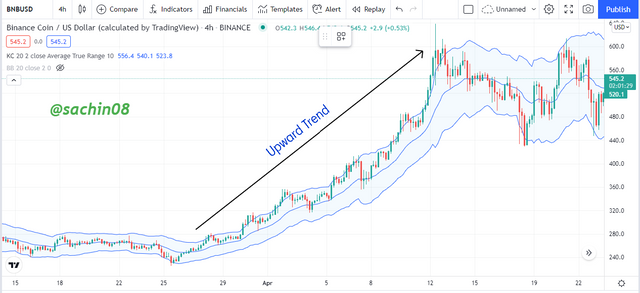
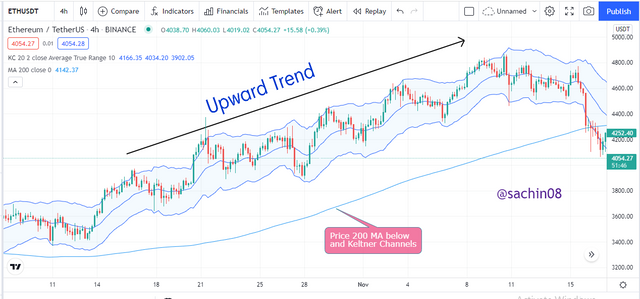
The keltner channels can be used to properly confirm direction of trend. If there is an uptrend, then the keltner channels would move with an upward angle. The price of asset would go up with most of the action of price is between upper line and middle line. The upper band act as resistance and central line act as support.
In the screenshot shown below, it is seen that an upward move has made by the price of BNBUSD which is characterized by higher lows and highs. The Keltner Channels move in an upward incline angle which confirms that the trend is an uptrend able to confirm that it is an uptrend by moving in an upward inclined angle and the price is between the upper line and middle line (i.e. resistance and support).
Downtrend:
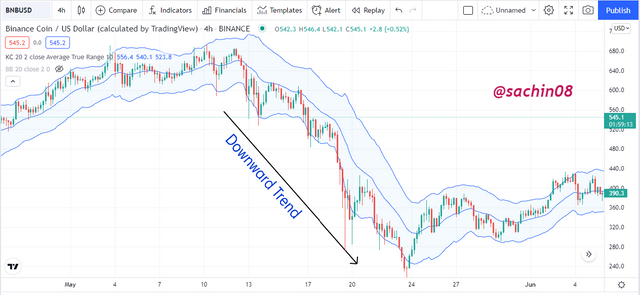
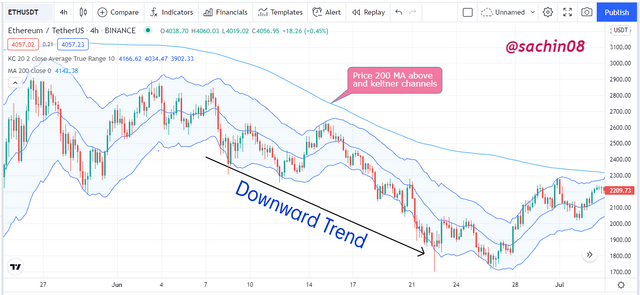
Now, in this case if there is downtrend, then the keltner channels would move with a downward angle. The price of asset would go down with most of the action of price is between lower line and middle line. The lower band act as support and central line act as resistance
In the screenshot shown below, it is seen that an upward move has made by the price of asset which is characterized by lower lows and highs. The Keltner Channels move in a downward incline angle which confirms that the trend is a downtrend and the price is between the support line and resistance line.
SIDEWAYS MARKET MOVEMENT:
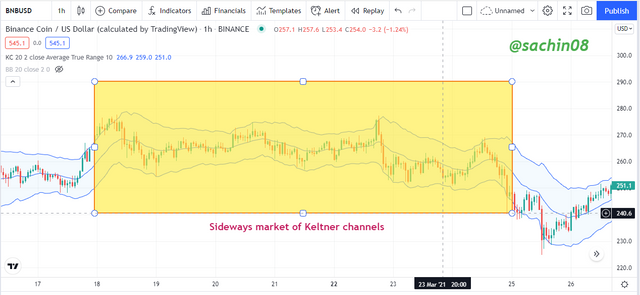
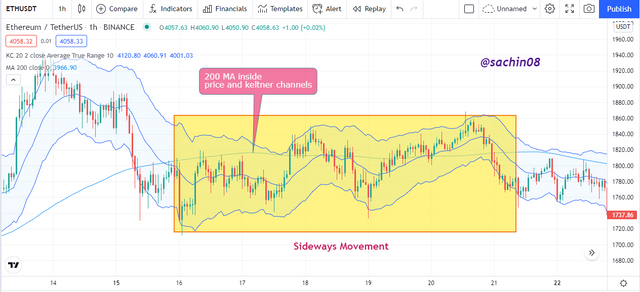
Basically, a sidways market is the market which is not trending i.e. the asset's price is not in uptrend or in downward and it is moving within price ranges which are less volatile. The sideways market can be seen on keltner indicator clearly and it is characterized by low volatility. The bands of the keltner channels indicator contracts and expands because of volatility. They contracts and moves horizontally when market is not in trend and the price of asset would occasionally touch the indicator and bounce off the lower and upper bands.
The upper band act as resistance to price and if price breaks above the band then an uptrend would occur and similarly, the lower band act as support to price and if price breaks below the band, then a downtrend would perform.
In the above shown screenshot, it is seen that the indicator is moving horizontally with the action of price. The price of asset touches the bands occasionally and it bounces off them which maintains a given price range.
Combining 200 MA with Keltner Channel Indicator
Like every Other indicator, the keltner channels indicator also has the tendency to generate false trade signals and so it can be combined with other indicators like Moving Average (MA) indicator to correct the false readings. I have combined MA with Keltner Channel and I used period as 200. Lets see the combination in uptrend, downtrend and sideways market.
In Uptrend:
The 200 MA should be below the priice and keltner indicator in an uptrend, and the keltner channels indicator is moving at an upward angle. This confirms that there is a bullish trend bias. This is shown in the image shown above. In the image we can see that the keltner channels and 200 MA respectively confirms that there is a bullish trend.
In Downtrend:
The 200 MA should be above the price level and keltner indicator in an uptrend, and the keltner channels indicator is moving at an downward angle. This confirms that there is a bearish trend bias. This is shown in the image shown above. In the image we can see that the keltner channels and 200 MA respectively confirms that there is a bearish trend.
In Sideways market:
In sideways market, the 200 Moving Average should be within the keltner channels and price. This confirms that there is an absence of trend as the price formation maintains a defined level of support and resistance. The is illustrated in the image given above. We can observe in the chart that the keltner channels and 200 MA respectively confirms absence of trend with there movement.

Q.5: What is Dynamic support and resistance? Show clear dynamic support and resistance with Keltner Channels on separate charts. (Screenshots required).

Dynamic support and Resistance:
The levels at which the price of an asset stops and reverses its direction arr called Support and Resistance levels. In chart, these signals are identified by straight lines. The resistance levels are those levels at which the price would hit at time of uptrend and take downward reversal and support levels are those levels at which the price would hit at time of downtrend and take upward reversal.
The dynamic support and resistance levels are not like the regular support and resistance level as they are not static on chart. The dynamic support and resistance levels changes constantly and evolve around asset'sprice. Indicators like moving average can be set as these levels.
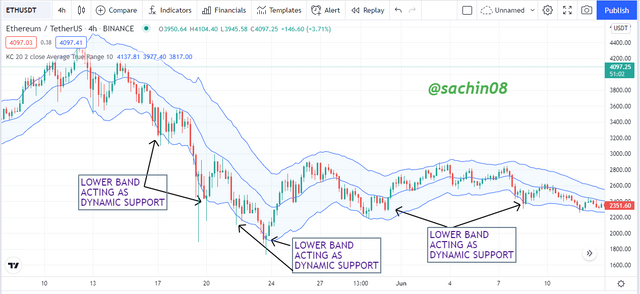
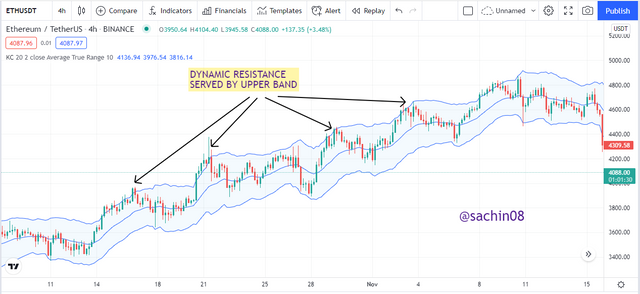
The keltner channels indicator can also work as dynamic resistance and support. The upper band would work as a dynamic resistance level and the lower band would work as a dynamic support level.
Dynamic support:
screenshot from tradingview
The above shown scenerio of ETHUSDT is that of a downward trend. We can see that the lower band is serving as a dynamic support level and when we scroll back to the data of previous price, it is seen that the current dynamic level has corresponded to swing point of previous price.
Dynamic resistance:
screenshot from tradingview
The above shown scenerio of ETHUSDT is that of an upward trend. We can see that the upper band is serving as a dynamic resistance level and when we scroll back to the data of previous price, it is seen that the current dynamic level has corresponded to swing point of previous price.

Q.6. What's your understanding of price breakouts in the Crypto ecosystem? Discuss breakouts with Keltner Channels towards different directions. (Screenshots required).

BREAKOUTS IN CRYPTO ECOSYSTEM
Breakouts in crypto trading happen after a period of movement of price in sideways, in which the price fluctuates under a determied level of support and resistance. The ketlner indicator can be used in order to confirm the breakout as whether it is a dynamic support level or a dynamic resistane level before the continuation of price in a specified direction. The price breaks below or above the line of keltner indicator.
BREAKOUTS WITH KELTNER CHANNEKS:
• Bullish Breakout
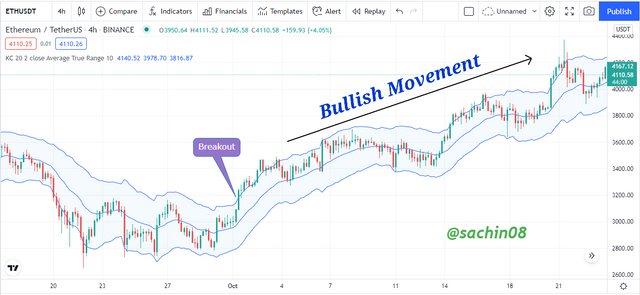
A breakout in an uptrend can occur at the level of resistane which is a signal of a bullish trend continuation.
The keltner indicator confirms the price breakout with the breaking and closing of price above the upper line which confirms the volatility of bullish movement of price. This enables the traders to prepare for the next coming bullish trend.
In the above screenshot, we can observe that the middle line of indicator serves as a dynamic support, and price broke and closed above the upper line. This shows that a possible bullish trend is coming. The bullish trend follows the breakout which confirms the breakout signal of keltner indicator.
• Bearish Breakout
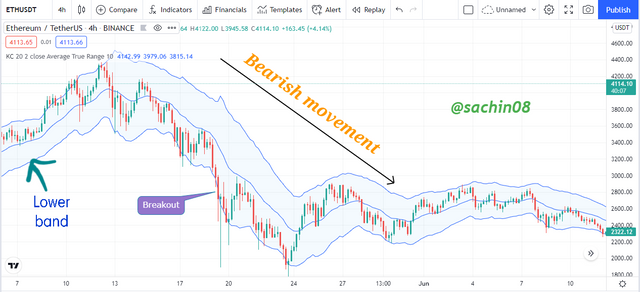
A breakout in an downtrend can occur at the level of support which is a signal of a bearish trend continuation.
The keltner indicator confirms the price breakout with the breaking and closing of price below the lower line (band) which confirms the volatility of bearish movement of price. This enables the traders to prepare for the next coming bearish trend.
In the above shown screenshot, we can observe that the middle line of indicator serves as a dynamic resistance, and price broke and closed below the lower line. This shows that a possible bearish trend is coming. The bearish trend follows the breakout which confirms the breakout signal of keltner indicator.

Q.7: What are the rules for trading breakouts with Keltner Channels? And show valid charts that work in line with the rules. (Screenshot required).

Bullish Breakout trade with Keltner Channels
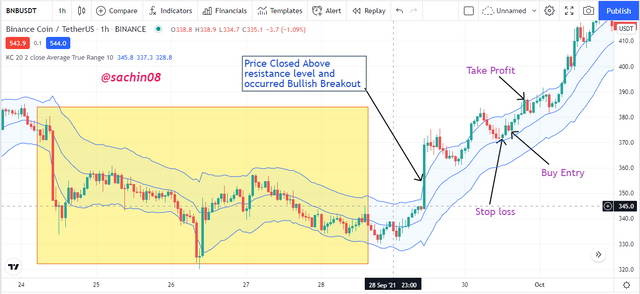
For the bullish breakout, the rules include are given below.
1). A breakout would occur above the upper line affer a sideways market and the line or band would close below the price of asset.
2). The price begins to come down after resisting at that point.
3). The price of the asset has to move between the center and upper band for confirming an upward trend. After support of price by center line, we place buy entry candles.
4). There should be stop loss placed just below the central line and support line.
image taken from Tradingview
Bearish Breakout trade with Keltner Channels
For the bearish breakout, the rules include are given below.
1). A breakout would occur below the lower line after a sideways market and the line or band would close above the price of asset.
2). The price begins to move up after resisting at that point.
3). The price of the asset has to move between the center and lower band for confirming a downward trend. After support of price by center line, we place buy entry candles.
4). There should be stop loss placed just above the central line and support line.
image taken from Tradingview

Q.8: Compare and Contrast Keltner Channels with Bollinger Bands. State distinctive differences.

The Keltner Channels indicator and Bollinger bands indicator are very similar to each other as they both are comprise of three different bands i.e. lower band, middle band and upper band. Also, the lookng of both is very much similar.
The Keltner indicator uses Average True Range (ATR) for calculation of upper and lower band, whereas the bollinger bands indicator uses standard deviation.
Keltner channels is more price responsive in comparison to bollinger bands because it uses two inputs - MA and ATR while bollinger bands uses one which is standard deviation.
The channels and bands (upper bands and lower bands) are used by both indicators to generate signals for their users and to determine direction of trend.
Both Keltner channels and Bollinger bands are used to calculate volatility of price of any asset.

Q.9: Place at least 4 trades (2 for sell position and 2 for buy position) using breakouts with Keltner Channels with proper trade management. Note: Use a Demo account for the purpose and it must be recent trade. (Screenshots required).

XRPUSDT Buy Setup Long:
I have taken the 5 minutes chart of XRP and applied keltner channels indicator on chart.
In observing the chart, we see that it is in uptrend and after sometime it starts going down due to the volatility of price but the middle band has acted as a dynamic support and it again started moving in original direction. I have waited for some retests before placing my long buy trade entry as shown in image above.
BTCUSDT Buy Setup:
Now, I have taken the 1 minute chart of BTC and applied keltner channels indicator on chart.
The market is going upward and the price is moving within the upper band and lower band. I will wait for the candle to break the level of resistane so that can place a buy order. The breakout occured in the screenshot shown as candle goes out resistance level. When price come to middle line after the breakout, i placed buy entry.
AVAXUSDT Sell Setup:
For the AVAX chart, i set the timeframe of 1 hour and I applied keltner channel on chart.
Now, i will place a sell entry for AVAX, but there should be downward movement in price for this. When the price of asset goes out of the lower band, the breakout occurs and I waited for the price to go to the middle band again and retest it. When the price touched the middle band, i placed a sell order.
STEEMUSDT Sell setup:
Now for selling STEEM I have set the time frame of 3 minutes and applied keltner channel on chart.
Now, to sell STEEM there should be downward movement in price. When the price of asset moves below the lower band, there occurs a breakout and i waited for the price to move backt k middle band and retest it. I placed the sell order when the price touched the middle band.

Q.10. What are the advantages and disadvantages of Keltner Channels?

ADVANTAGES OF KELTNER CHANNELS:
The Keltner Channels is very useful in identifying price breakouts thanks to its dynamic support and resistance levels.
- Because of the dynamic support and resistance of the Keltner channels, they are very much useful if we want to identify price breakouts.
- The Keltner channel indicator is used to identify the direction of a trend with the help of angle of movement of this indicator.
- This indicator is easy to read and understand. It can also be understood by the persons who do not know much about indicators.
- Confirmation of trend is easy while using Keltner channel indicator, as when the price moves in between middle and upper line, it is identified as bullish and when it moves between middle and lower line, it is identified as bearish.
DISADVANTAGES OF KELTNER CHANNELS:
- This indicator can also give some (but very less) false signals and it is not fully guaranteed. Hence, by using it with combination of other indicators is more effective.
There are chances of confirmation of late trend by which the traders will lead to loss opportunities for entering the trade in correct time.
In different time frames, the chart with keltner indicator applied shows different views i.e. for example, the chart view of a gap of 15 and 20 minutes chart is different.

CONCLUSION
The keltner channels indicator is an indicator which is based on volatility and it was developed by chester keltner in 1960. For trending market, this indicator works best and for price action, the reaction of the indicator is very low. To get better results, the indicator should be used in combination with other indicators.
The lecture gave much information about Keltner channels indicator to me and I have learnt to use this. I am thankful to professor @fredquantum for this informative lecture.
