 |
|---|
Greetings everyone, welcome to class as we discuss this time on another interesting topic; Mastering Breakouts with Volume Profile and VWAP. We keep mastering a lot these days, so I hope you get to learn something new too.
Explain the Concepts of Volume Profile and VWAP |
|---|
Volume Profile is a technical tool that shows how much trading activity has happened at different price levels over a specific time period. It is like a bar chart that displays the number of assets traded at each price level, helping traders see where most of the buying and selling occurred.
Volume Profile in an everyday example is like a busy café. you notice that most customers tend to sit at certain tables during peak hours, those tables represent price levels where a lot of trading activity occurs. If one day, a new customer tries to sit at a table that’s usually occupied, it might indicate a change in behavior. Similarly, in trading, if the price approaches a level where a lot of buying or selling has happened before, it can indicate that traders might react strongly, leading to potential breakouts.
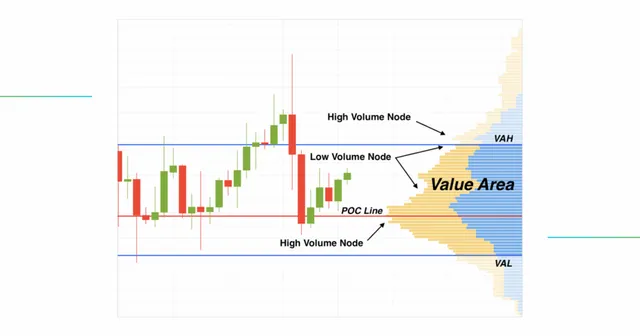
Volume Profile has several features that can help traders understand market behavior better and here are some of them;
 |
|---|
Horizontal Bars:
It has bars that show how much trading occurs at different price levels. The longer the bar, the more volume there is at that price.
Value Area:
This is the price range where most trading happens. It usually covers about 70% of the total volume and helps traders see where the market is focused.
Point of Control (POC):
This is the price level with the highest volume. It represents the price most traders agree on and can act as support or resistance.
High Volume Nodes:
These are areas with a lot of trading activity. They can indicate where the price might bounce back or find support.
Low Volume Nodes:
These are areas with little trading activity. If the price enters here, it can move quickly because there aren’t many traders to hold it back.
Time Frame Flexibility:
You can use Volume Profile across different time frames, whether it’s daily, weekly, or hourly charts. This helps you see how volume changes over time.
Market Context:
It helps traders understand if the market is bullish or bearish based on where the volume is concentrated.
All these features assist traders in making better decisions by showing where the action is happening and how prices might move based on past trading behavior.
VWAP (Volume Weighted Average Price) is the average price of an asset, weighted by the volume of trades at each price level. It gives traders an idea of the average price an asset has traded at throughout the day, considering how much was traded at each price. It is a useful tool for determining whether an asset is trading above or below its average price, which can indicate if it's a good time to buy or sell.
imagine you are tracking your daily spending, and lets say you find out that you usually spend around $50 on groceries each week, then that is like your average price, so if one week you spend $70, you might think, “Wow, that’s a lot more than usual.” So if you keep spending above that average, it could indicate that you’re buying more or that prices have gone up. Similarly in trading, if the price is consistently above the VWAP, it suggests that buyers are pushing the price higher, just like how your spending habits might change over time.
VWAP, has several key features that traders can use to analyze price movements. Here are the features explained in simple terms:
Average Price Calculation:
VWAP calculates the average price of a security over a specific period, considering the volume of trades at different prices. This helps traders see if the current price is high or low compared to this average.
Volume Weighting:
Unlike a simple average, VWAP gives more importance to prices where more trading occurs. This means that if a lot of shares are traded at a certain price, that price will have a bigger impact on the VWAP.
Time Frame Flexibility:
You can calculate VWAP for different time frames, like daily or intraday. This allows traders to see how the average price changes over various periods.
Support and Resistance Levels:
VWAP can act as support or resistance. If the price is below the VWAP, it may indicate bearish sentiment, while if it's above, it could suggest bullish sentiment. Traders watch these levels for potential entry or exit points.
Trend Confirmation:
When the price is above VWAP, it suggests a bullish trend, and when it's below, it indicates a bearish trend. This helps traders confirm the overall market direction.
Trading Strategy:
Many traders use VWAP to guide their trading decisions, helping them decide when to buy or sell based on how the price relates to the VWAP line.
These features make VWAP a valuable tool for traders to understand market behavior and make informed decisions based on price and volume.
Now that we know what these tools are all about, how does each of these tools provide unique insights into market dynamics? Well both the Volume Profile and VWAP each offer unique insights into market dynamics to help traders make informed decisions.
The Volume Profile of an asset tend to provide a visual representation of where most trading activity has occurred at different price levels. Therefore by looking at this profile, traders can identify key levels of support and resistance.
For instance, if a lot of trading happened at a certain price, it might indicate that many traders are interested in buying or selling at that level. Thus, it can help traders anticipate price movements around this level as they can see that the market has previously reacted strongly at this level. So if the price approaches these levels again, traders may expect similar reactions to occur.
On the other hand, the VWAP helps traders understand the average price at which an asset has been traded throughout the day, adjusted for the volume of trades. However it does not only consider daily averages as it calculates the average price of an asset throughout the trading day, taking into account both the price and the volume of trades, meaning that it can be calculated for different time frames, not just daily to providing a more accurate reflection of the true average price at which an asset has traded.
This means that if a lot of shares were traded at a certain price, that price will have a greater impact on the VWAP. Hence traders tend to use VWAP as a benchmark to assess whether the current price is favorable. Thus, if the asset is trading above the VWAP, it is often taken as a bullish market indication, suggesting a potential upward trend, while trading below it could indicate bearish sentiment.
If these tools do all these things for traders, then what is their role in identifying potential breakouts? Well, both Volume Profile and VWAP play important roles in identifying potential breakouts in the market.
Starting with Volume Profile, which we have already learnt that helps traders see where significant trading activity has occurred at various price levels, therefore when the price approaches a level where there has been a lot of buying or selling in the past, it can signal a potential breakout.
For example, if the price is nearing a resistance level (a price where sellers have previously stepped in), traders will watch closely to see if the price breaks through this level with strong volume (meaning that many shares are being traded), which tend to suggest that the sellers have been overpowered by buyers, hence indicating a breakout. And again, if the price approaches a support level (where buyers have previously stepped in) and breaks down with high volume, it indicates that the buyers are losing strength, which can also signal a breakout in the opposite direction.
Now, looking at VWAP which serves as a dynamic benchmark throughout the trading day as earlier explained. A tool explained as when the current price of an asset is consistently above the VWAP, that it suggests buyers are in control, so then if the price of an asset breaks above a previous resistance level while still remaining above the VWAP, it can indicate a strong bullish breakout.
Then traders look for confirmation, such as increased volume or momentum, to support the idea that the breakout is valid. Whereas, if the price is below the VWAP and breaks below a support level, it can indicate a bearish breakout, suggesting that sellers are gaining control.
In summary, Volume Profile helps identify key price levels based on historical trading activity, while VWAP provides a real-time average price to gauge market sentiment. Therefore, when combined together they give traders valuable insights into potential breakouts, allowing them to make more informed trading decisions.
Identifying Breakout Zones with Volume Profile |
|---|
From what we have gathered in the previous section, to identify breakout zones using Volume Profile, we need to keep our eyes on certain criteria and follow some steps, such as;
Look at the Volume Profile Chart:
First, you need a chart that shows the Volume Profile, which displays the amount of trading activity at different price levels over a certain period. It usually looks like a horizontal histogram on the side of the price chart.
Identify High Volume Areas:
Focus on the areas where there’s a lot of volume. These are the price levels where many trades have occurred, and they often act as support or resistance. High volume indicates that traders are interested in those price levels.
Find Key Levels:
Look for significant peaks in the Volume Profile. These peaks represent price levels where buyers and sellers have previously interacted a lot. If the price approaches one of these levels, it could be a breakout zone.
Watch for Price Action:
As the price gets close to these high volume areas, observe how it behaves. If the price starts to move sideways or consolidates near these levels, it might be building up energy for a breakout.
Look for a Breakout with Volume:
When the price finally breaks through one of these key levels, pay attention to the volume. A strong breakout is usually accompanied by high volume, indicating that many traders are participating and supporting the move.
Confirm the Breakout:
After the breakout, check if the price stays above the breakout level (if it’s a bullish breakout) or below it (if it’s a bearish breakout). This confirmation helps ensure that the breakout is valid and not just a false move.
But then, as useful as Volume Profiling is, it does have some limitations that traders should be aware of which includes;
Historical Data Dependence:
Volume profiles are based on past trading activities. This means they reflect what has happened, not necessarily what will happen in the future. If market conditions change suddenly, the volume profile may not provide accurate guidance for upcoming price movements.
To address the reliance on past data, users should combine volume profiling with other analysis methods, such as technical indicators or fundamental analysis. This way, they can gain insights into potential future price movements by considering current market conditions and trends.
Time Frame Sensitivity:
The volume profile can vary significantly depending on the time frame you choose. A profile based on a daily chart might show different levels of support and resistance compared to a profile based on an hourly chart. This can lead to confusion if you’re looking at multiple time frames, as the key levels may not align.
Users can analyze multiple time frames to get a more comprehensive view of the market. By comparing volume profiles from different time frames, they can identify consistent support and resistance levels, which may provide more reliable trading signals. It's important to be aware of how different time frames can affect the interpretation of the volume profile.
Market Context Ignored:
Volume profiles don’t account for broader market factors like news events, economic data releases, or changes in market sentiment. These factors can heavily influence price movements and may lead to breakouts that the volume profile doesn’t predict.
To account for broader market factors, users should stay informed about economic news, events, and market sentiment. Keeping an eye on news releases and understanding how they might impact the market can help traders make more informed decisions. Incorporating news analysis with volume profiling can provide a clearer picture of potential market movements.
Limited Insight on Price Action:
While volume profiles show where trading has occurred, they don’t provide information about the direction of price movements. A high volume at a certain level could indicate both strong support or resistance, making it challenging to interpret the implications without additional analysis.
Users can enhance their understanding of price movements by combining volume profiling with price action analysis. Observing how prices behave around key volume levels can provide insights into whether those levels act as support or resistance. This combination can help traders interpret the significance of volume profiles more accurately.
Requires Experience:
Interpreting volume profiles effectively can take time and practice. New traders may find it difficult to understand how to use this tool properly, potentially leading to misinterpretation and poor trading decisions.
To overcome the learning curve, users can educate themselves through online courses, webinars, or trading communities. Practicing with simulated trading can also help build confidence and understanding. The more familiar users become with volume profiling and its nuances, the better they will be at interpreting it effectively.
Therefore let us follow these steps, so we can effectively identify breakout zones using Volume Profile on the STEEM/USDT Chart. To this task, I will be using the TradingView app to identify areas of strong support/resistance and low-volume zones where breakouts are likely to occur:
Step 1:
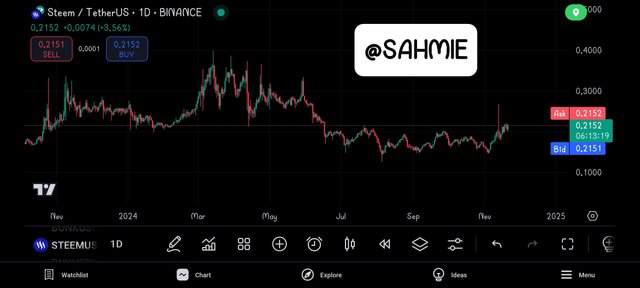
First thing first is to launch the TradingView app and search for the Steem/USDT trading pair and opened the chart in the daily timeframe.
Step 2:
Once the chart was opened, I clicked on the indicators button and searched for the Volume Profile indicator to add it to the chart.
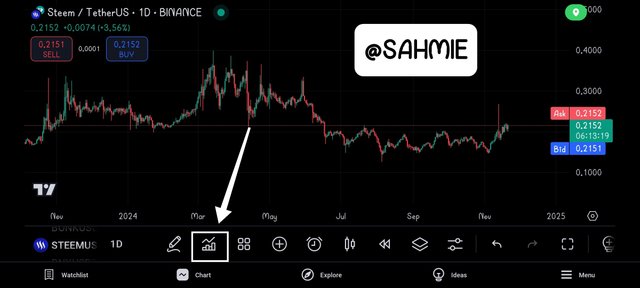
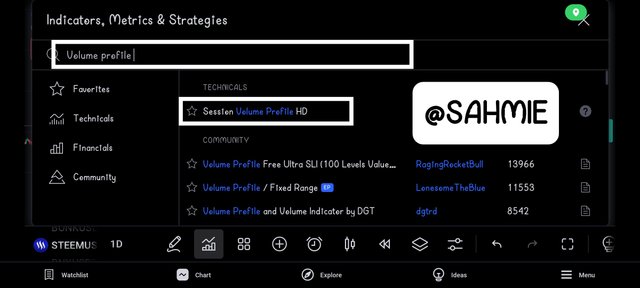
However, I encountered a slight difficulty as this indicator is only available for subscribed users as I was greeted with that message.
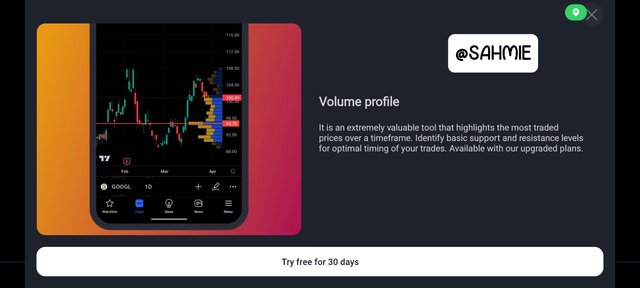
So I seek for an alternative means that carries similar (if not exactly) same function in another indicator with same name but free for everyone.
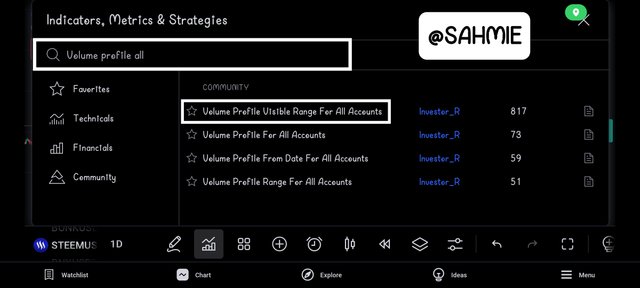
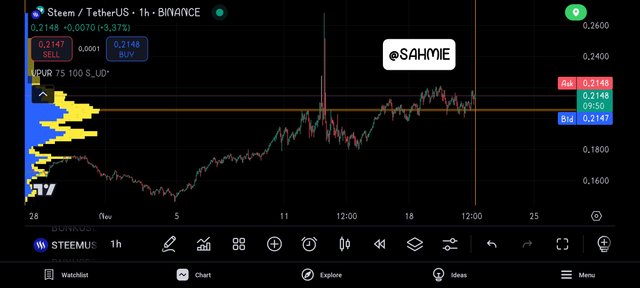
Once it was added, it was displaying the volume distribution the left horizontal axis.
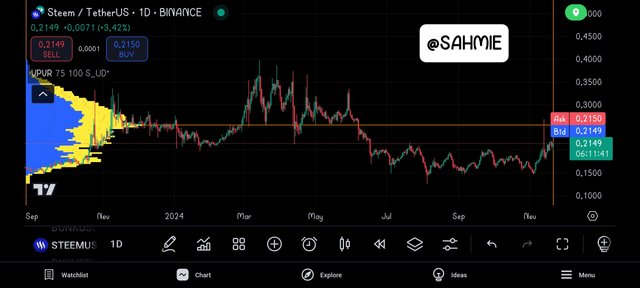
Which I changed to a smaller timeframe in the hourly timeframe since the daily is clustered as seen above.
Step 3:
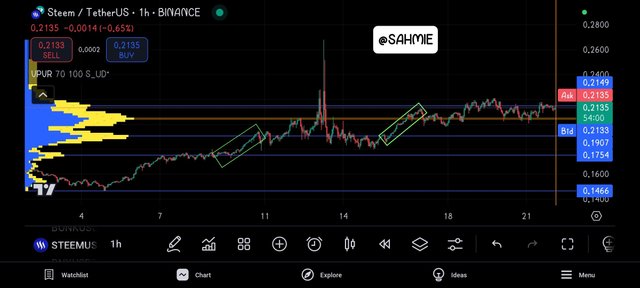
Since the Volume Profile indicator was added, I looked at the Volume Profile histogram on the left side of the chart, paying attention to the peaks as this is where trading volume is highest. Also, having in mind that these peaks indicate strong support or resistance levels, so I marked them out.
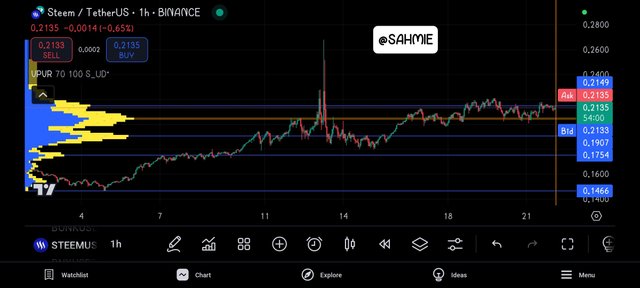
For example, there were significant peaks at price levels $0.1754, $0.1907, $0.2149 and the POC. These levels might act as a strong supports or resistance if the price approaches it from above or below.
Step 4:
Next, I looked for areas where the Volume Profile shows very little volume, which appears as valleys or dips in the histogram, because these low-volume zones indicate that there hasn’t been much trading activity at those price levels, suggesting that if the price breaks through these areas, it could move quickly since there’s less resistance.
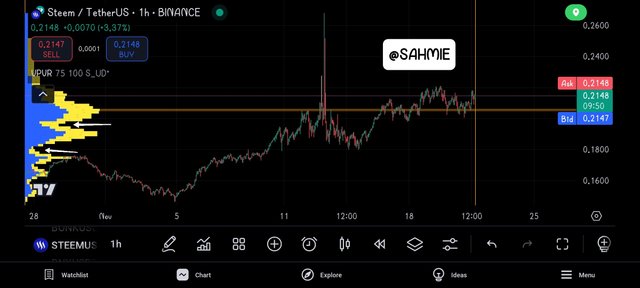
From the above screenshot, we can clearly see how prices moved quickly at this points.
Step 5:
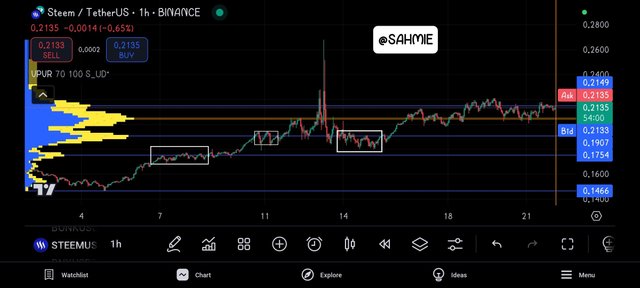
As the price approaches these identified support/resistance levels or low-volume zones, keep an eye for how it reacted. If the price consolidates around a high-volume area, it may signal a potential breakout. Conversely, if it approaches a low-volume zone and breaks through, it could lead to a swift price movement.
Step 6:
To confirm the break outs, check for moments when the price breaks through a support or resistance level which was accompanied by the volume, having in mind that a significant increase in volume during the breakout reinforces the strength of the move.
Validating Breakouts with VWAP |
|---|
Knowing what VWAP is all about now, during a breakout, we can look at how the price interacts with the VWAP to gauge the strength of that breakout. Then, what are we looking for when we look at the VWAP, well we will be looking at the following:
First let us follow these steps in applying VWAP on the STEEM/USDT Chart to support our analysis. I will be using the TradingView.
Step 1:
First thing first is to launch the TradingView app and search for the Steem/USDT trading pair and opened the chart in the daily timeframe.

Step 2:
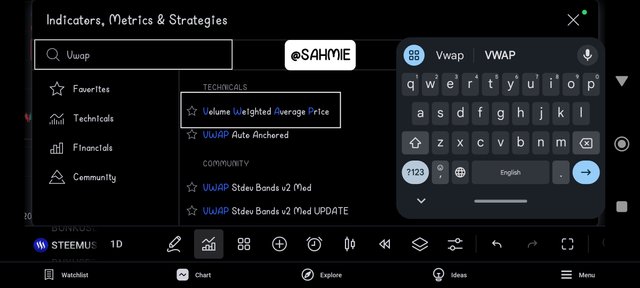
Once the chart was opened, I clicked on the indicators button and searched for the VWAP indicator to add it to the chart.

Step 2:
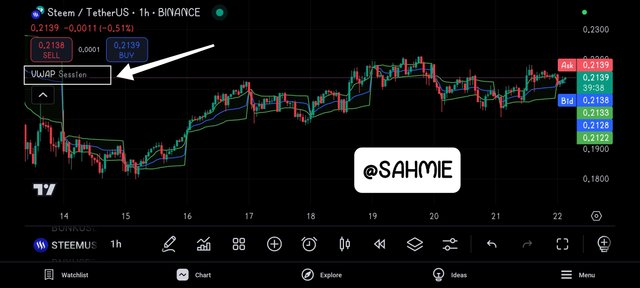
Once the indicator was added to the chart, I clicked on the indicator name to customise and remove the noise from the upper and lower bands.
Step 3:
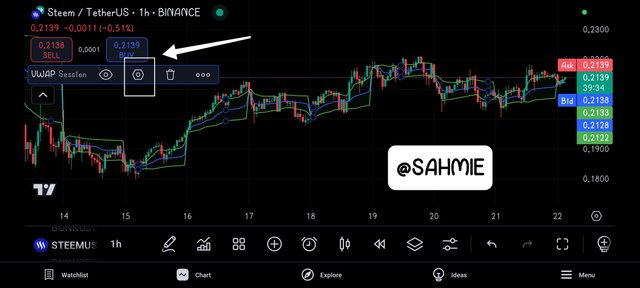
Click on the settings, then under Style toggle off both the upper and lower bands to remove them
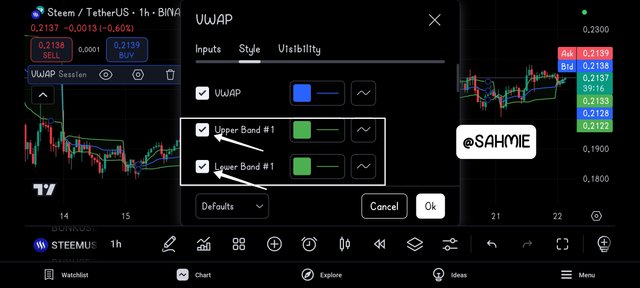
Doing so, removed the upper and lower bands to give a clearer view as shown below.
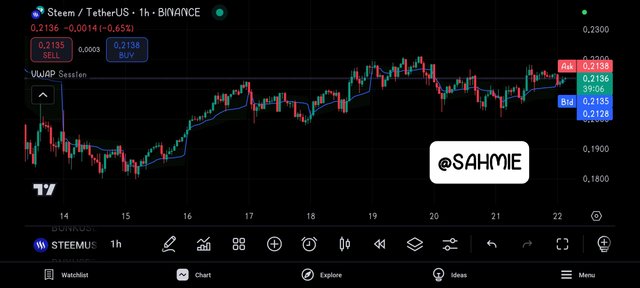
Now we can carry the out the analysis and what are we looking for when we look at the VWAP, which are;
If Price is Above VWAP:
We've learnt that when the price of an asset is above the VWAP, it suggests that buyers are in control.
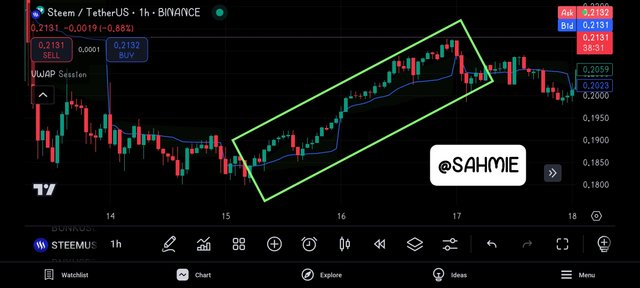
Therefore, if Steem's price breaks out above a certain level and stays above the VWAP, it indicates strong bullish momentum.
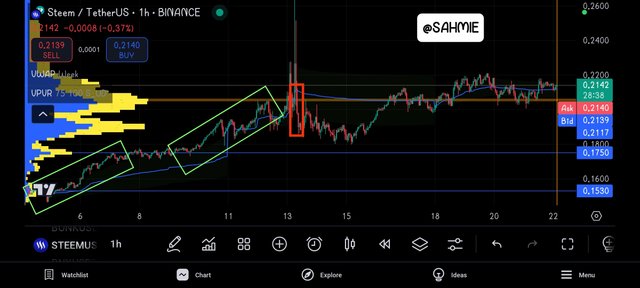
For instance, in the above screenshot, we can see in the green rectangles that Steem is above the VWAP (the blue line) and it breaks through resistance levels, it shows that the average price is supporting this move, reinforcing the idea that the breakout is strong.
If Price is Below VWAP:
On the other hand, if the price is below the VWAP, it suggests that sellers are dominating.
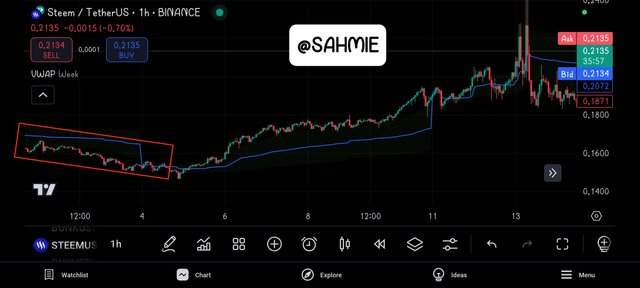
Hence, if Steem were to break below a support level and also drop below the VWAP, it could indicate a weak breakout, suggesting that the price might continue to fall.

For instance, in above screenshot, we can see in the red rectangle that Steem is below the VWAP (the blue line) and it breaks through a support level in the POC, indicating a weak breakout and the price fell, before reinforcement close to a support level.
Re-testing VWAP:
After a breakout, the price may come back to test the VWAP. Therefore, if it bounces off the VWAP and continues to rise, it confirms that the breakout was strong and that the VWAP is acting as a support level. For example, during Steem's bull run, if the price shot up to $0.30, then pulled back to the VWAP at $0.25 and bounced back up, it would suggest that there is still buying interest and that the trend is likely to continue.
Volume Confirmation:
This is also important to look at when analyzing VWAP, because if the breakout happens with high volume, it adds to the confirmation that the price movement is strong. For example, if Steem breaks out above $0.30 with significant trading volume and stays above the VWAP, it’s a strong signal for traders to consider entering or holding their positions.
However as useful as VWAP is for analyzing breakout strength, it does have some limitations that traders should be aware of. Some of such limitations include;
Lagging Indicator:
VWAP is a lagging indicator, meaning it is based on past price and volume data, therefore this can cause delays in signals. For example, if Steem is breaking out right now, the VWAP might not reflect that breakout immediately. Therefore traders might miss the initial momentum because the VWAP takes time to adjust to the new price levels.
Not Suitable for All Timeframes:
VWAP is often used on intraday charts, which means it may not be as effective for long-term trading. So if a trader is looking at daily or weekly charts, the VWAP might not provide relevant insights. For instance, during Steem’s bull run, daily movements might not align well with the VWAP calculated on an hourly basis, leading to confusion about the breakout strength.
False Signals:
Sometimes, the price can briefly dip below or rise above the VWAP without indicating a true breakout leading to false signals. For example, if Steem's price spikes above the VWAP but then quickly falls back below it, it could mislead traders into thinking there was a strong breakout when it was just a temporary move.
Volume Dependency:
VWAP heavily relies on volume data, therefore if there is low trading volume, the VWAP may not accurately reflect the true market sentiment. For example, if Steem is experiencing low trading activity during a breakout, the VWAP might not provide a reliable confirmation of strength, as the price movements could be driven by a few trades rather than overall market interest.
Market Conditions:
VWAP might not perform well in choppy or sideways markets. In such conditions, price movements may frequently cross the VWAP without any significant trend, making it hard for traders to determine whether a breakout is genuine or just noise. For instance, if Steem is moving up and down around the VWAP without clear direction, it could be challenging to assess breakout strength.
Ignoring Other Indicators:
Relying solely on VWAP may lead traders to overlook other important indicators or market factors. For instance, if there are significant news events or changes in market sentiment affecting Steem, these might not be reflected in the VWAP, leading to incomplete analysis.
Developing a Breakout Strategy |
|---|
To trade Steem/USDT pair using Volume Profile and VWAP for breakout trading strategy, we can follow the following steps;
Identify the Range:
Start by looking at the price chart to find a range where Steem has been trading sideways for a while. This is usually marked by horizontal support and resistance levels. The longer the price stays in this range, the stronger the potential breakout.
Check Volume Profile:
Use the Volume Profile tool to see where most trading activity has occurred within that range. Look for areas with high volume, as these are likely to act as strong support or resistance levels. The price is more likely to break out when it approaches these levels.
Look at VWAP:
Next, add the VWAP line to your chart. This line helps you understand the average price based on volume. If the price is above the VWAP, it indicates bullish sentiment, while being below suggests bearish sentiment.
Set Entry Points:
Plan your entry point just above the resistance level of the range if you expect a breakout to the upside. If the price breaks above this level and also above the VWAP, it’s a strong signal to enter the trade. Conversely, if you expect a breakout to the downside, set your entry just below the support level.
Define Stop-Loss Levels:
To manage risk, set a stop-loss order slightly below the resistance level if you’re buying (for an upside breakout) or slightly above the support level if you’re selling (for a downside breakout). This way, if the price reverses, your losses will be limited.
Establish Profit Targets:
Determine your profit target based on the distance between the support and resistance levels. For example, if the range is $1.00 wide, aim for a profit target of $1.00 above your entry point for a long trade or $1.00 below for a short trade. This gives you a clear goal to aim for.
Keep an Eye on Volume:
As the trade progresses, keep an eye on the volume. If the volume increases significantly during the breakout, it confirms the strength of the move. If volume is low, be cautious, as it may indicate a false breakout.
Adjust if Needed:
Be flexible and ready to adjust your stop-loss and profit targets based on how the trade develops. If the price moves in your favor, consider moving your stop-loss to break even to protect your capital.
Avoiding False Breakouts |
|---|
Breakout trading can be exciting, but it comes with some common risks we should be aware of. Some of such risks are:
False Breakouts:
This is when the price breaks above resistance or below support but quickly reverses back into the range. It can trick traders into thinking a new trend has started, leading to losses if they enter a trade based on this false signal.
Slippage:
Sometimes, when you place an order, the price might change before your order is executed, especially in fast-moving markets. This means you could end up buying at a higher price or selling at a lower price than you intended.
High Volatility:
Breakouts often occur during periods of high volatility, which can lead to rapid price movements. While this can create opportunities, it can also increase risk, as prices can swing wildly in a short time.
Insufficient Volume:
A breakout should ideally be supported by strong trading volume. If the volume is low, it may indicate weak interest in the move, increasing the chances of a reversal.
Market Sentiment Changes:
External factors like news events or economic data releases can suddenly change market sentiment, impacting the price direction and potentially leading to losses if you are caught in a trade.
Overtrading:
The excitement of breakout trading can lead to overtrading, where you take too many positions without proper analysis. This can increase your risk and lead to significant losses.
Being aware of these risks means that we can manage our trades more effectively and protect our capital while breakout trading and again to enhance the reliability of breakout trading, here are some practical tips we need to incorporate:
Confirm with Volume:
Always look for an increase in trading volume when a breakout occurs. High volume suggests strong interest and can indicate that the breakout is more likely to hold. If the breakout happens with low volume, it might be a false signal.
Identify Key Levels:
Use the volume profile to find significant support and resistance levels. Enter trades when breakouts occur at these key levels, as they tend to be more reliable.
Watch for Volume Confirmation:
When a breakout happens, check if the volume is higher than average. If it is, it adds confidence that the breakout is genuine.
Use Multiple Time Frames:
Check the breakout on different time frames. If a breakout looks strong on both a daily chart and a shorter time frame, it adds more credibility to the move. This way, you can see if the breakout is part of a larger trend.
Set Clear Entry and Exit Points:
Before entering a trade, decide on your entry point, stop-loss, and take-profit levels. This helps you manage risk and avoid emotional decisions during the trade. Stick to your plan!
Wait for Retests:
Sometimes after a breakout, the price will pull back to test the breakout level before continuing in the direction of the breakout. Waiting for this retest can provide a better entry point and increase the chances that the breakout will hold.
Look for Confluence:
Use other technical indicators or chart patterns to confirm the breakout. For example, if the breakout is happening at a key support or resistance level or is confirmed by indicators like moving averages, it adds more weight to the trade.
Be Aware of News Events:
Major news or economic reports can affect market behavior. Be cautious about trading breakouts just before significant news, as they can cause unexpected volatility that may lead to false breakouts.
Practice Patience:
Not every breakout will be a good opportunity. Sometimes it’s better to wait for a clearer signal rather than jumping into a trade too quickly. Keeping an eye on the market and being patient can lead to better trading decisions.
DISCLAIMER: Everything on this publication is not in any way a trading advice but just a piece of my understanding for learning purposes.
I wish to invite @starrchris, @bossj23, @ngoenyi, and @ruthjoe.
Thank You for your Time
NOTE: Always have a smile on your face, as you are never fully dressed without one.

Well understanding , appreciated.
Downvoting a post can decrease pending rewards and make it less visible. Common reasons:
Submit