 |
|---|
Welcome everyone to class once again as we will be discussing on another interesting topic; Advanced Strategies Using On-Chain Data and Sentiment Indicators. I hope you get to learn something new too.
Understanding On-Chain Data Metrics |
|---|
On-chain data metrics are basically the information that we can find directly on the Blockchain of a project. Since blockchain is a public digital ledger where every transaction is recorded, these metrics help us to understand what is happening in the network, like how many transactions are being made, how much money is being transferred, or how many new users are joining.
For an everyday example, imagine you have a neighborhood grocery store. If you wanted to know how popular the store is, you might look at the number of customers coming in each day or how many items they are buying.
Similarly, on-chain data metrics let us see things like the number of transactions happening in the Blockchain of the project just like Bitcoin or Ethereum, which helps us understand how active and popular that currency is.
So, just like tracking foot traffic in a store gives you insights into its success, on-chain data metrics provide valuable information about the health and activity of cryptocurrencies.
Taking our beloved Steem and Steemit as example, such on-chain metrics gives us a better understanding of the project whereas activities on the platform keep us updated. Some of the key on-chain data metrics for the Steem cryptocurrency are:
Transaction Volume:
This metric shows the total number of transactions made on the Steem blockchain over a specific period. A higher transaction volume indicates that more users are actively using the platform, which can signify its popularity and utility.
 |
|---|
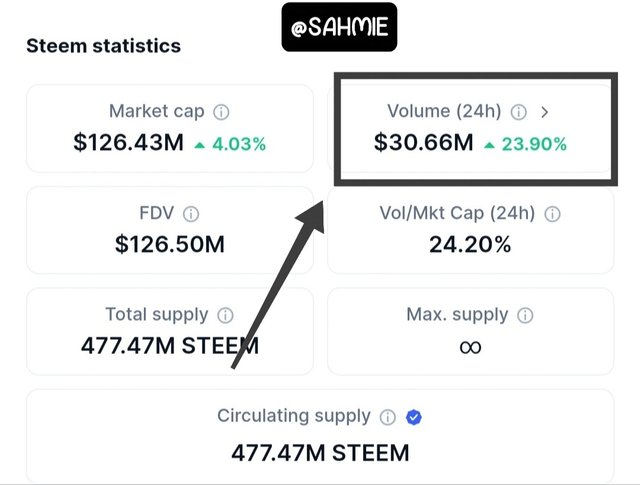
From the screenshot above, we can see that the Trading volume of STEEM has increased approximately 24% in the last 24hrs, indicating that more users are trading Steem.
Active Users:
This refers to the number of unique accounts that have made transactions or interacted with the network within a given timeframe. A growing number of active users suggests that the platform is gaining traction and attracting more participants.
Stake Distribution:
This metric looks at how Steem tokens are distributed among users. It can show whether a few accounts hold a large portion of the total supply or if the tokens are more evenly spread out, where a more even distribution can indicate a healthier ecosystem.
Content Creation and Engagement:
Steem is known for rewarding users for creating content, therefore this metric tracks the amount of content published (like posts and comments) and the level of engagement (likes, shares, and comments) it receives. Where high engagement levels reflect a vibrant community.
Market Capitalization:
This is the total value of all Steem tokens currently in circulation. It’s calculated by multiplying the current price of Steem by the total supply of tokens, where a higher market cap can indicate a more established and trusted cryptocurrency.
 |
|---|
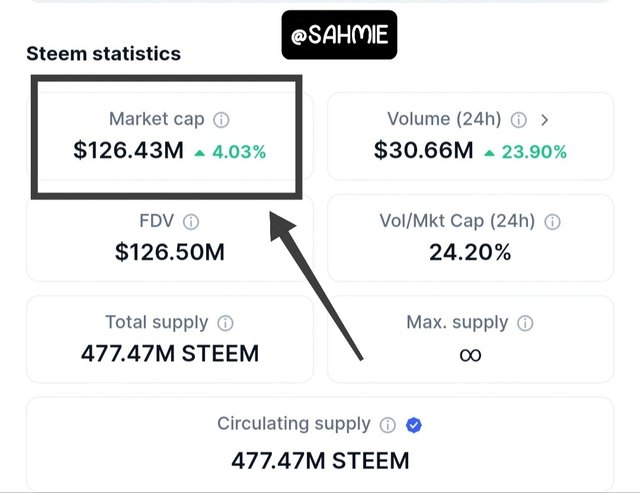
From the screenshot above, we can also see that the market capitalization of Steem has grown about 4%, indicating that it's been trusted more by users.
Voting Power:
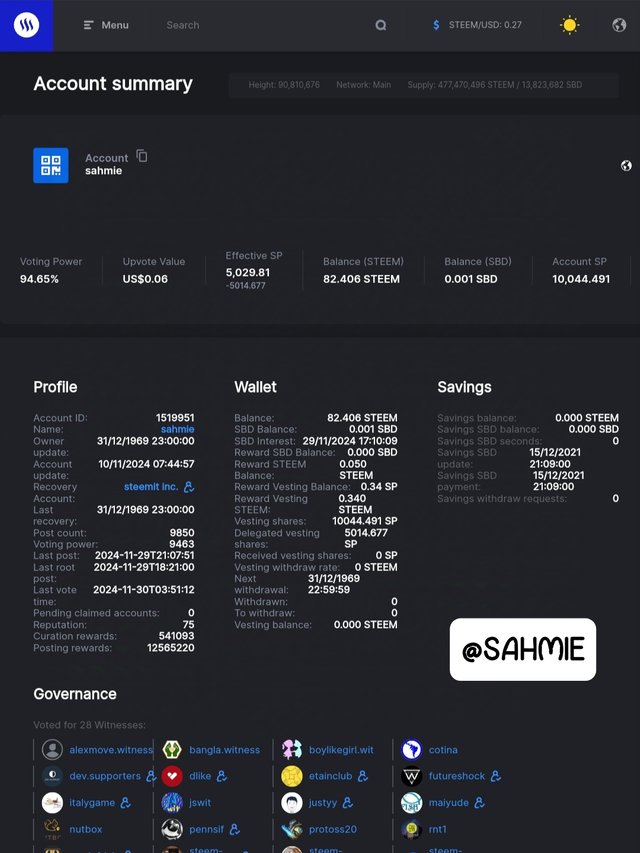
In Steem as we all know by now, users can vote on content and other users, which influences rewards. This metric shows the voting power of accounts and how often they participate in the voting process. Active voting can enhance community involvement.
Reward Pool:
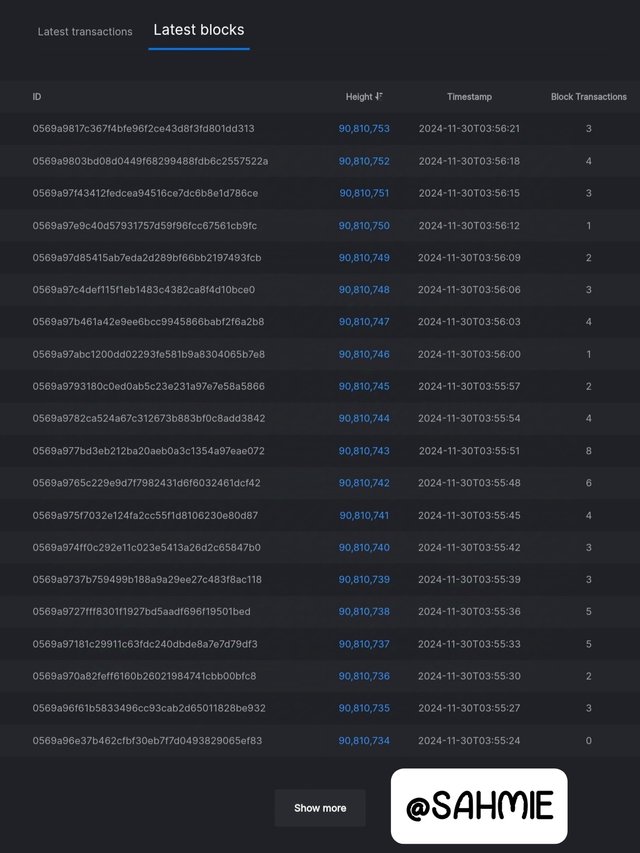
This metric indicates the total amount of rewards available for content creators and curators. Therefore, a larger reward pool can encourage more users to participate in content creation, as they see greater potential for earning rewards.
 |
|---|
 |  |
|---|
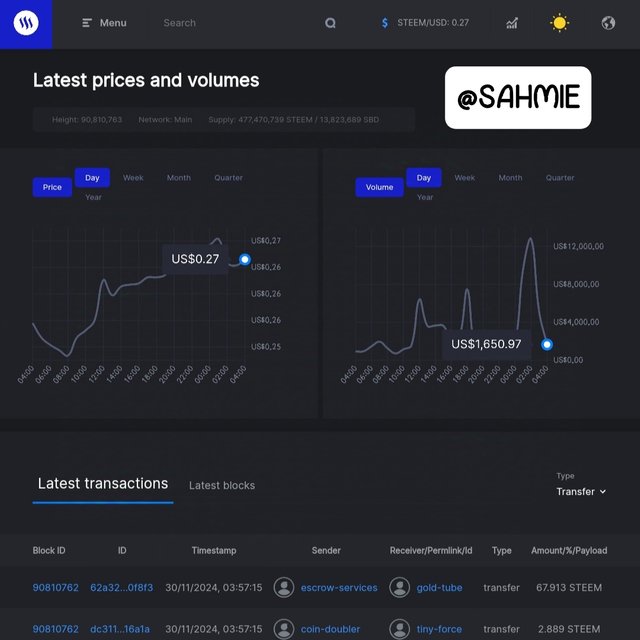
Therefore by analyzing all these on-chain data metrics, we can gain insights into the health and activity of the Steem Blockchain, helping us to make informed decisions about our involvement.
Now that we know what on-chain data metrics are all about, how is on-chain data metrics like wallet activity, exchange inflows/outflows, and token holding distribution are important?
Well, they are very important because they give us a clear picture of what's happening with a project. For instance;
Wallet Activity:
Wallet activity shows how often people are using their wallets to send or receive the token. If a lot of wallets are active, it means more people are engaged with that project, which is a good sign of its popularity and usability.
Exchange Inflows/Outflows:
Exchange inflows and outflows on the other hand refers to the movement of coins in and out of exchanges. When many coins flow into an exchange, it often means people are looking to sell, which might indicate they think the price will drop. On the other hand, if a lot of coins are flowing out, it could mean people are buying and holding, expecting the price to go up, helping us to understand market sentiment.
Token Holding Distribution:
Token holding distribution simply tells us how the tokens are spread out among users. Hence, if a few people hold a large amount of the total supply, it can create risks because those holders could influence the price significantly. Therefore, a more balanced distribution means that the cryptocurrency is less likely to be swayed by a few large holders, which can lead to a more stable market.
Now that we've come to know these metrics and their importance to understanding a project. We are left with how can these metrics help in indicating a market sentiment during a bull run?
During a bull run, when the price of a cryptocurrency is rising, on-chain data metrics can give us clues about how people feel about the market.
First, wallet activity usually increases as more and more people are using their wallets to buy and trade, showing that they are excited and confident about the rising prices. This therefore indicates that many people are jumping in, believing the price will continue to go up.
Next, looking at exchange inflows and outflows is crucial because if we are seeing more coins flowing out of exchanges, it means that people are buying and holding their coins instead of selling, reflecting as a positive sentiment, because investors are expecting prices to rise further. Whereas, if there are high inflows of tokens into exchanges, it may indicate that people are selling their coins, which could signal fear or uncertainty about future price movements.
Finally, token holding distribution can show us how many people are investing in the cryptocurrency. If more people hold smaller amounts of tokens, it can indicate widespread interest and confidence in the asset. However, if a few individuals hold large amounts, it could create a sense of caution, as those holders might sell off their tokens at any time, impacting the price.
Using Sentiment Indicators to Analyze Market Trends |
|---|
Sentiment indicators like the Fear & Greed Index and social media sentiment are useful tools for understanding how investors feel about the market, which can help predict whether prices are likely to go up (bullish) or down (bearish).
The Fear & Greed Index is a tool that measures how greedy or fearful investors are based on various factors, such as market volatility, momentum, and social media activity. When the index shows extreme greed, it often indicates that prices have risen too quickly, and a correction might be coming.
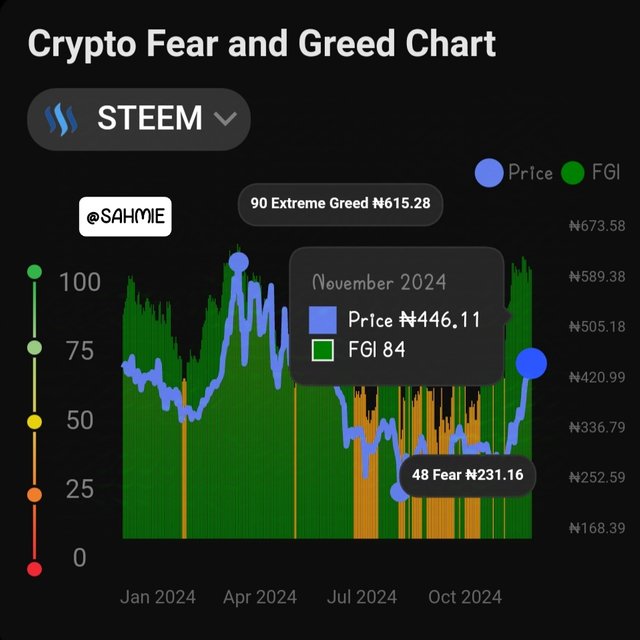
From the above screenshot, we can see that the current fear and greed index (FGI) of Steem is at 84 which is considered to be extreme Greed as shown in the screenshot below.
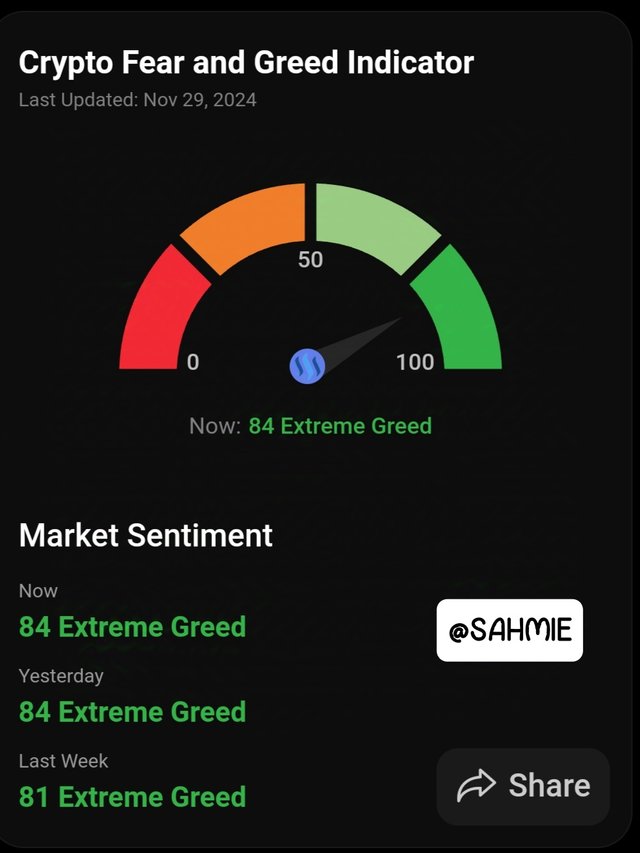
This means that users are optimistic about the price of Steem and are holding onto it, however as a user, we should be expecting a correction period as time goes on because at a certain point some of these users holding would want to make profit.
For example, back in 2017, the index reached very high levels as Bitcoin prices soared. Shortly after that, the market corrected sharply, showing that too much greed can lead to a downturn.
Social media sentiment on the other hand works in a similar manner to the fear and greed, remember it is also considered as a factor of the fear and greed index. Therefore by analyzing posts, comments, and discussions on platforms like Twitter or Reddit, we get to gauge public opinion about a cryptocurrency or the market in general.
If there’s a lot of positive chatter and excitement, it often signals bullish conditions. Whereas, if people are expressing fear or negativity, it can indicate bearish conditions. For instance, during the 2020 market crash due to the pandemic, social media sentiment turned very negative, which aligned with falling prices. But as the sentiment started to shift back to positivity, the market began to recover.
There are multiple cases of news we can look into that have affected the prices of cryptocurrencies positively and negatively in the past. Below is a table showing examples of news and how it affected the price of Bitcoin in the market.
| Date | News | ∆ Price after 10 days | Source |
|---|---|---|---|
| March 10, 2017, | USA SEC rejected Winkelwos’ crypto-currency ETF application | Negative | link |
| April 1, 2017, | Japan affirms Bitcoin as a legal tender | Positive | link |
| August 1, 2017, | Bitcoin divides into Bitcoin Cash and Bitcoin | Positive | link |
| September 3, 2017, | China forbids ICO for crypto-currencies | Negative | link |
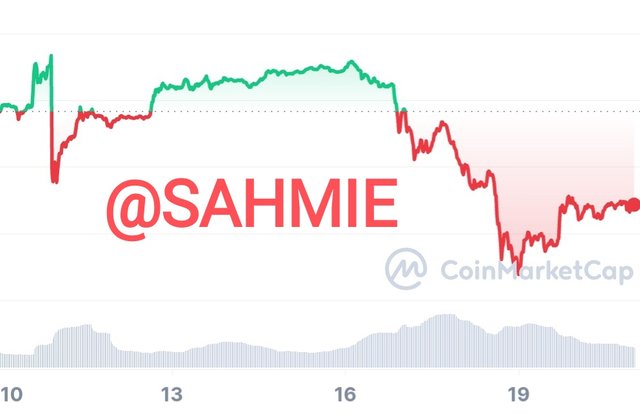 March 10-20, 2017 March 10-20, 2017 | 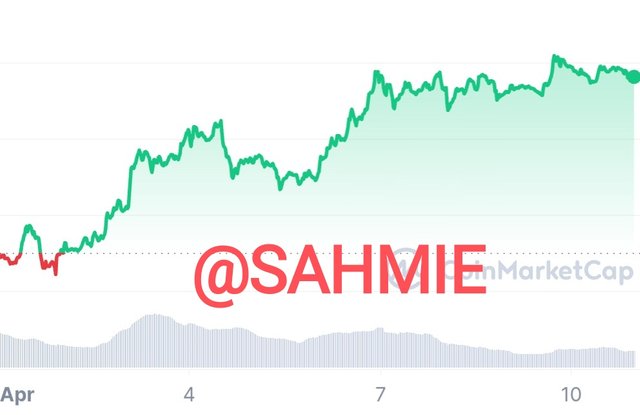 April 1-10, 2017 April 1-10, 2017 |
|---|
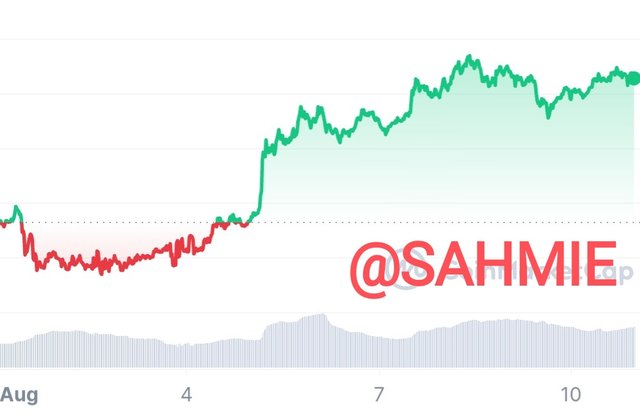 August 1-10, 2017 August 1-10, 2017 | 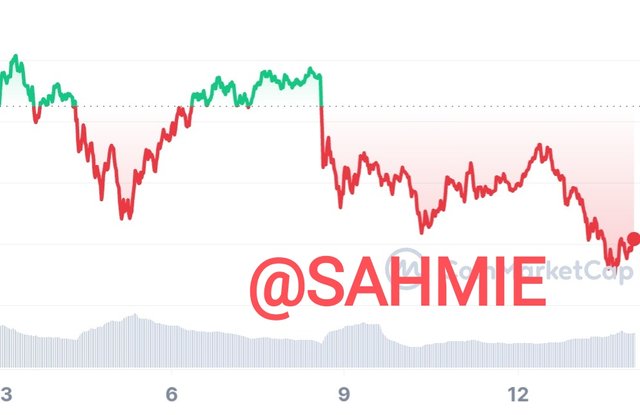 September 3-13, 2017 September 3-13, 2017 |
|---|
From the above, we can see how positive news about a project brings about positive change in price and also how negative news affects the price negatively. This shows that social media sentiment affects the price of an asset in the financial market.
Integrating On-Chain Data with Sentiment Indicators |
|---|
To create any trading strategy is all about making better informed decisions. Therefore, to create a sentiment-based trading strategy for Steem that combines both on-chain data and sentiment indicators, I would follow these steps:
Monitor On-Chain Data:
Start by regularly checking the Steem blockchain for transaction activity, where I will look for patterns like large amounts of Steem being transferred to personal wallets. This can indicate that investors are accumulating Steem, which might suggest a bullish sentiment. But then, if I see a lot of Steem being moved to exchanges, it could mean that investors are preparing to sell, indicating bearish sentiment.
Analyze Sentiment Indicators:
I will use sentiment analysis tools to gauge the mood of the market, such as checking social media platforms like Twitter or Reddit for discussions about Steem, paying attention to the overall tone of these conversations. Then if I notice a lot of positive comments and excitement about Steem, it means good things are coming as it is a good sign. I can also use sentiment indexes like the fear and greed index that measures fear and greed in the market. If the index shows high greed, it could be a signal to consider buying.
Combine Insights:
Once I have both on-chain data and sentiment analysis right, then I can now combine these insights. For example, if I see that on-chain data shows increased accumulation of Steem and sentiment indicators are positive, this could be a strong signal for me to buy. On the other hand, if on-chain data shows selling activity and sentiment is negative, it might be wise for me to sell or hold off on buying.
Set Trading Triggers:
Based on my analysis, I will have to set specific triggers for my trades. For instance, I might decide to buy Steem if the price drops below a certain level while on-chain data shows accumulation and sentiment is positive. Then again, I might set a trigger to sell if the price rises significantly but on-chain data shows increased selling and sentiment turns negative.
Regularly Review and Adjust:
Make it my habit to regularly review my strategy because markets change, and so do sentiments. This means that, I will have to keep an eye on both on-chain data and sentiment indicators to adjust my trading strategy as needed. For example, if I notice a shift in sentiment or on-chain activity, I will have to adapt my approach.
Finally, to tailor our trading strategy for Steem during bullish and bearish sentiment phases, we need to establish clear entry, exit, and risk management criteria and here is how we can approach each phase:
| Entry Criteria: |
|---|
Look for signs of strong buying interest, such as a significant increase in transaction volume on the Steem blockchain. If you see a lot of Steem being transferred to wallets instead of exchanges, that’s a good sign.
Check sentiment indicators; if social media discussions are overwhelmingly positive and people are excited about Steem, that’s another signal to enter the market.
Set a specific price point. For example, if Steem's price is trending upwards and breaks through a resistance level (a price point where it previously struggled to rise above), that could be a good time to buy.
| Exit Criteria: |
|---|
Plan to take profits when the price reaches a certain target, which could be a percentage increase from our entry price. For instance, if we buy Steem at $0.30, ,we might set a target to sell at $0.50.
If the sentiment starts to shift negatively, even if the price hasn’t reached our target, we should consider selling. For example, if we notice that social media discussions have turned more critical or cautious, it may be time to exit.
| Risk Management: |
|---|
Set a stop-loss order to prevent further losses. For example, if we buy Steem at $0.30, you might set a stop-loss at $0.25 to limit our loss to about 16.7%.
Only invest a small portion of our total capital in each trade to minimize risk. From my experience, it is a common rule that one should not risk not more than 1-2% of their total trading account on a single trade.
| Entry Criteria: |
|---|
In this phase, we look for signs of selling pressure. If we see a lot of Steem being moved to exchanges, it indicates that investors might be preparing to sell, which is a bearish sign.
Check sentiment indicators; if discussions on social media are predominantly negative or filled with fear, it’s a signal to be cautious or to consider going short (betting against) on Steem.
If the price breaks below a support level (a price point where it previously found buying interest), that could be a signal to sell or avoid buying.
| Exit Criteria: |
|---|
If you are holding Steem during a bearish phase, consider selling if the price falls to a certain level that you had predetermined, such as a percentage drop from your entry price.
If sentiment improves and discussions become more positive, it might be a good time to exit your position to avoid further losses.
| Risk Management: |
|---|
Similar to the bullish phase, set a stop-loss order to protect yourself from significant losses. If you bought Steem at $0.30 and the price starts to drop, you might set a stop-loss at $0.25 to limit your loss. Unless we are going short on Steem, then our stop loss can be higher than the price we've bought Steem, so let's say $0.35 then. This way if the market turns bullish, we don't lose from shorting.
Again, only risk a small percentage of your total capital on trades, especially in a bearish market where the risks can be higher.
Limitations and Best Practices in Sentiment Analysis |
|---|
Like every other thing in life, market sentiment analysis also comes with some challenges and limitations of market sentiment Therefore understanding these challenges can help us approach market sentiment analysis more wisely and make better decisions. Some of such challenges are;
Delayed Reactions:
Sometimes, even when important news comes out, people don’t react immediately. For example, if a company announces bad news, it might take a while for investors to sell their shares. This delay can cause prices to drop more than they should have because people are slow to respond.
Misleading Signals:
Sentiment analysis often looks at social media and news to gauge feelings about the market. However, not everything you read is true. A few people can create a lot of noise about a stock, making it seem like everyone is excited about it, when in reality, it’s just a small group. This can mislead investors into making bad choices.
Rapid Changes in Sentiment:
Market feelings can change quickly. One moment, everyone might be optimistic about a stock, and the next, they’re worried. This can happen due to new information or events. If traders rely too much on sentiment, they might find themselves constantly changing their minds and strategies.
Noise vs. Signal:
In sentiment analysis, there’s often a lot of “noise” (unimportant information) mixed in with the “signal” (important information). For example, a viral meme about a stock may get a lot of attention, but it doesn’t mean the stock is a good investment. Separating the two can be tricky.
Herd Mentality:
People often follow what others are doing, which can lead to irrational decisions. If everyone is buying a stock just because it’s popular, it may not be a sound investment. This herd mentality can drive prices up or down too quickly, leading to bubbles or crashes.
Emotional Bias:
Investors are human, and emotions can cloud judgment. Fear and greed can lead to poor decision-making. For example, during a market downturn, fear might cause investors to sell off their stocks at a loss, even if it’s not the best long-term decision.
Limited Historical Data:
Sentiment analysis relies on past data to predict future trends. However, if the market changes or if there’s a new factor that hasn’t been seen before, past data may not be helpful. This is like trying to predict the weather based only on last year’s forecasts, which might not apply anymore.
Now that we've known some of the challenges of sentiment analysis, how can we improve its reliability? Well, here are some tips we could practice to improve sentiment-based trading strategies reliability:
Use Multiple Sources:
Don’t just rely on one platform for sentiment analysis. Check different social media sites, news articles, and financial forums. By gathering opinions from various places, you can get a better overall picture of how people feel about a stock.
Look for Trends Over Time:
Instead of focusing on one-off comments or short bursts of excitement, pay attention to how sentiment changes over time. If people are consistently positive or negative about an asset for a few weeks, that’s more telling than a sudden spike in comments.
Combine Sentiment with Other Data:
Use sentiment analysis alongside other types of information, like financial reports or market trends. This way, we are not just making decisions based on feelings but also on solid facts. For example, if sentiment is positive but the project's activities are down, that might raise a red flag.
Be Aware of Market Conditions:
Keep an eye on the overall market environment. If the market is generally doing well, positive sentiment might be more reliable. Whereas, in a downturn, even good news might not matter much. Understanding the bigger picture can help us interpret sentiment better.
Watch Out for Fake News:
Be cautious of misleading information or rumors that can spread quickly online. Always verify the news before acting on it. If you see something that seems too good to be true, do some research to confirm its accuracy.
Set Clear Rules for Trading:
Establish specific guidelines for when to buy or sell based on sentiment. For example, we might decide to buy an asset if sentiment stays positive for a week. Having clear rules can help you avoid making impulsive decisions based on emotions.
Practice Patience:
Don’t rush into trades based solely on sentiment. Take your time to analyze the information and consider how it fits into your overall investment strategy. Sometimes, waiting a little longer can lead to better decisions.
Use Technology Wisely:
Consider using sentiment analysis tools or software that can help us process large amounts of data quickly. These tools can analyze trends and provide insights that might be hard to spot manually.
DISCLAIMER: Everything on this publication is not in any way a trading advice but just a piece of my understanding for learning purposes.
I wish to invite @starrchris, @bossj23, @ngoenyi, and @ruthjoe.
Thank You for your Time
NOTE: Always have a smile on your face, as you are never fully dressed without one.

Congratulations, your post has been upvoted by @scilwa, which is a curating account for @R2cornell's Discord Community. We can also be found on our hive community & peakd as well as on my Discord Server
Felicitaciones, su publication ha sido votado por @scilwa. También puedo ser encontrado en nuestra comunidad de colmena y Peakd así como en mi servidor de discordia
Downvoting a post can decrease pending rewards and make it less visible. Common reasons:
Submit