 |
|---|
INTRODUCTION |
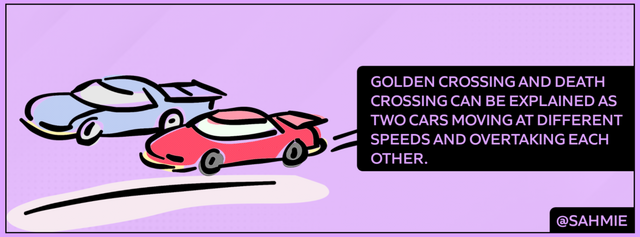
Imagine you and your friends are going for a field trip, but since a single vehicle cannot carry everyone, they use two vehicles and you are placed in the faster vehicle, but then, your faster vehicle overtakes the slower one with your friends, you will be full of excitement that you are going to reach the destination first, but then what happens if your friends slower vehicle overtakes your faster vehicle, you will be sad that you are lagging behind a isn't it?
 |
|---|
Now, you might be wondering why I'm talking about fast and slow vehicles in a topic about cryptocurrency, well this is very relatable to the topic at hand which is Golden Crossing and Death Crossing. Stick around to know how these two are related.
Explain in your own words, what is the golden crossing and what is the crossing of death. |
|---|
When we look at a chart showing the average price of a cryptocurrency or an asset over different periods. The Golden Crossing happens when the line representing the average price over a short period, crosses above the other line which represents the average price over a longer period.
When this happens, what does it mean to investors? Well, the golden crossing is seen by investors as a positive indication suggesting that the cryptocurrency or asset's price might go upward (I.e. Bullish) in the future signalling it is a good time to buy that asset or cryptocurrency. It is taken by investors to be a stop sign saying, "Hey, things are looking good and the asset or cryptocurrency price could be on the rise"
Now, this helps investors to make more informed decisions about buying or holding onto an asset or cryptocurrency. More like our green light on the traffic signs saying, "Go on, the coast is clear"
Therefore, relating it to our vehicle example, we can say Golden Crossing, is when your faster vehicle overtakes your friend's slower vehicle indicating a shift in momentum, just like the shorter-term (faster vehicle) moving average crossing above the longer-term (slower) moving average. Your excitement can also be related to the suggestion of a potential uptrend in the asset or cryptocurrency price.
Death Crossing on the other hand occurs when the shorter line representing the average price over a short period, crosses below the longer line, which represents the average price over a longer period.
Unlike the Golden Crossing, Death Crossing is seen as a not-so-great sign by investors. It is taken to be a signal that the asset's price might go down in the future. Also, like a red flag saying, "Be cautious, the asset's price could be on the decline".
Therefore, Investors use the Death Crossing indications as a helpful guide to make decisions about selling or avoiding an asset as it is taken to be a warning sign that says, "The asset might not be performing so well", hence it might experience a downtrend in the future.
Back to our vehicles, Death Crossing can be likened to when your faster vehicle is lagging behind your friend's slower vehicle indicating a change in momentum, just like the shorter-term (faster vehicle) moving average crossing below the longer-term (slower vehicle) moving average, your sad mood can also be related to suggestion of a potential downward trend in the stock's or cryptocurrency price.
If you wondering why the fast vehicle is the shorter term, and the slower vehicle is the longer term, it's simply because the faster vehicle will require shorter time intervals (short term) to get to the destination while the slower vehicle will require a longer time interval (long term) to get to the same destination.
The same is applied to the moving averages as the shorter term always requires or uses a smaller number of days (short term) while the longer-term moving average uses or requires a larger number of days (long term).
Use the BTC/USDT pair to show the golden crossover and the crossover of death, in Tradingview. Also, use the STEEM/USDT pair to show the golden cross and the death cross. Screenshots are required. |
|---|
To add both golden and death crossings on a price chart using TradingView, we can use the Moving Average indicator.
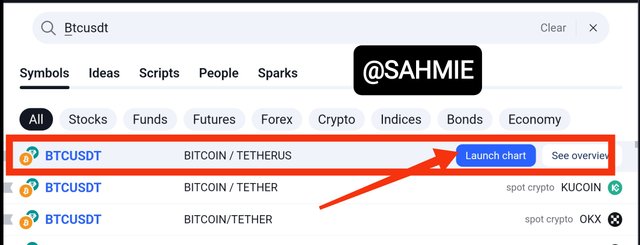
Step 1: Open TradingView and search for the BTC/USD pair to open the chart.
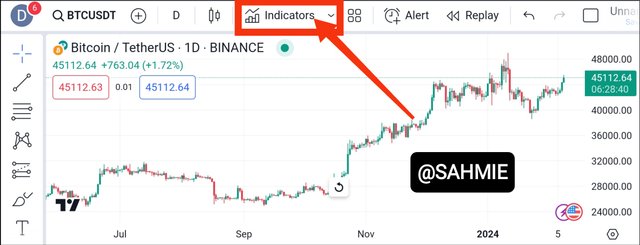
Step 2: On the opened chart, click on the "Indicators" button at the top of the chart.
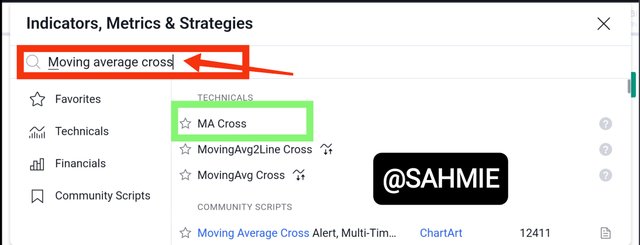
Step 3: In the search bar, type "Moving Average Cross" or "MA Cross" and select it from the list of results.
Step 4: To set the Moving Average indicator to your desired parameters for the short and long periods. Click on the "screw button" or "settings" on your indicator
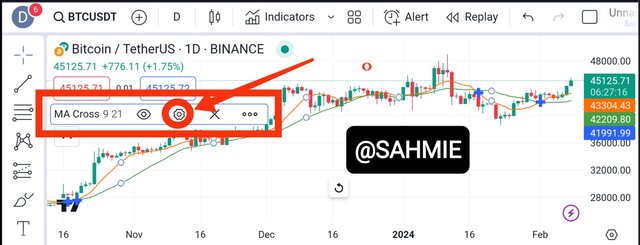
Step 5: You can now set your desired parameters that is the short term and long term moving averages durations and click Okay below to apply the settings
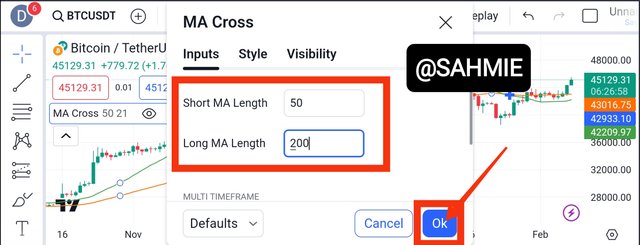
Once you click on the Okay button the changes will be applied as shown below.
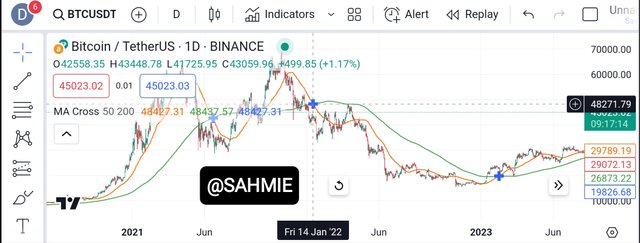
Now remember, the GOLDEN CROSSING occurs when the shorter moving average line crosses above the longer moving average line, while the DEATH CROSSING happens when the shorter line crosses below the longer line. Hence we can now look at the chart to point out this various crossings.
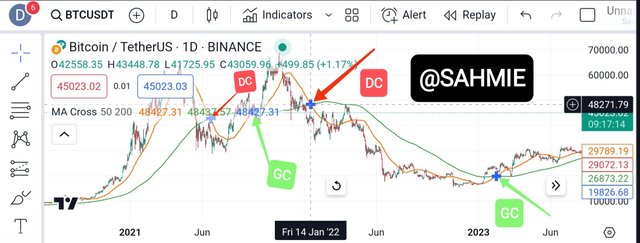
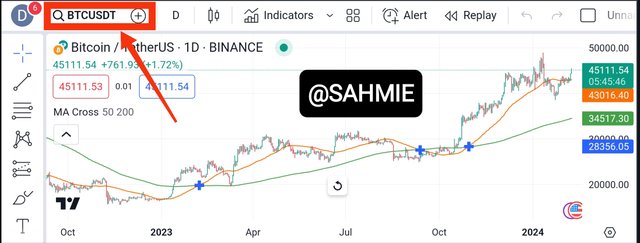
From the screenshot shown above, we can see the point(s) of Golden Crossing (GC) in green and Death Crossing (DC) in red on the BTC/USDT chart on a 1 Day time frame.
To apply the Moving Average Crossing indicator the STEEM/USDT pair from the above chart, click on the BTC/USDT pair above as shown below.
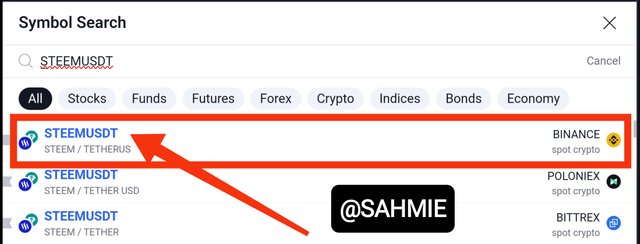
Search for STEEM/USDT pair in the search bar, and click the pair from the results provided as shown below.
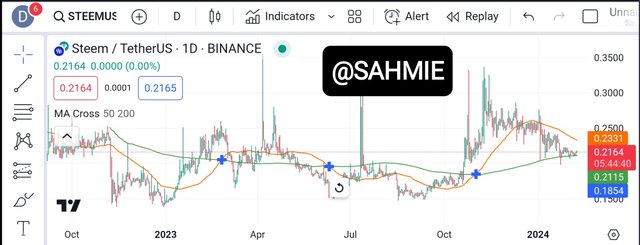
The chart will be displayed with the different points of Golden Crossing (GC) and Death Crossing (DC) as showing below.
Now we can now look at the chart to point out this various crossings points as shown below.
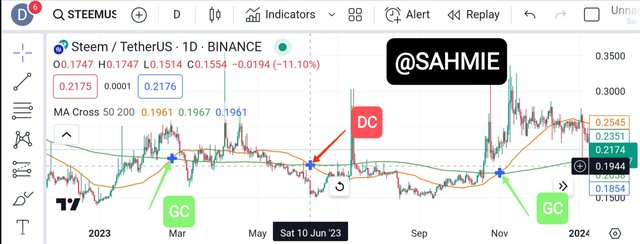
The above screenshot shows Moving Average Crossing indicator of the STEEM/USDT pair on a 1 Day time frame chart. However, I couldn't help but notice how this indicator is not foolproof.
From the above image, as at Saturday 10th, June 2023. The indicated predicted a Death Crossing, meaning the likely occurrence of a downward trend, however an upward trend was experienced that it moved from $0.1944 in June 10, to 0.3029 an increase of aprox. 55.82% in July 11th, 2023 as shown in the screenshot below.
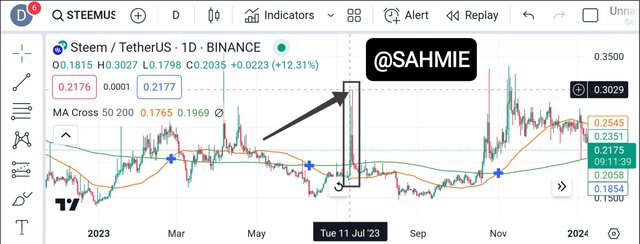
This shows that this indicator is not so foolproof hence, we should be careful when using this indicator.
Note:
Orange Line: Short-term MA
Green Line: Long-term MA
DC: Death Crossing
GC: Golden Crossing
What is the difference between the golden crossover and the death crossover? |
|---|
| Category | Golden Crossover | Death Crossover |
|---|---|---|
| Definition | It occurs when a shorter-term moving average line crosses above a longer-term moving average line. | It occurs when a shorter-term moving average line crosses below a longer-term moving average line. |
| Significance | It is considered a bullish signal, suggesting a potential upward trend in the stock's price. | Death Crossover: It is seen as a bearish signal, indicating a possible downward trend in the stock's price. |
| Timing | It typically happens after a period of decline or consolidation, signalling a potential reversal and the start of an uptrend. | Death Crossover: It often occurs after a period of growth or consolidation, indicating a potential reversal and the start of a downtrend. |
| Investor Reaction | Investors may interpret it as a buy signal, indicating a good time to enter or hold a position in the stock. | Investors may interpret it as a sell signal, suggesting a good time to exit or avoid a position in the stock. |
| Trend Confirmation | It is often used to confirm the beginning of a new bullish trend or to support an existing uptrend. | It is often used to confirm the beginning of a new bearish trend or to support an existing downtrend. |
In addition to these two chartist patterns, what other indicator would you add to make the technical analysis more effective at the moment of making a decision? |
|---|
In addition to the golden and death crossovers, another indicator that can complement an investor's technical analysis of an asset or cryptocurrency is the Relative Strength Index (RSI).
The RSI is a momentum oscillator that measures the speed and change of price movements. It helps identify overbought and oversold conditions in an asset or cryptocurrency. Therefore, by adding the RSI to one's analysis, we can gain insights into the strength of a trend and potential reversals.
The RSI indicator usually uses two values (30 and 70) to indicate the positions of overbought and oversold. When the oscillator indicates that the price of an asset or cryptocurrency is above 70, this indicates that the asset or cryptocurrency is being overbought, suggesting a possible price correction or reversal hence showing the likelihood of a Death Crossing occuring.
Whereas, when the RSI indicator value is below 30, it indicates the asset or cryptocurrency is being oversold, suggesting a potential price bounce or reversal to the upside, hence indicating the likelihood of a Golden Crossing occurring.
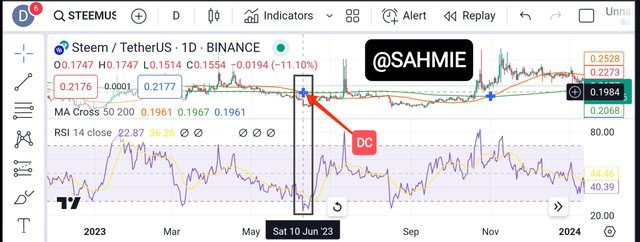
Applying the RSI indicator to the MA Crossing indicator also seem to prove that the MA Crossing is not so foolproof. On the same 10th of June where the MA Crossing indicator predicted a downward trend, the RSI indicator predicted the opposite as the price index was below the 30 value mark, indicating the occurrence of an upward trend which eventually happened.
Therefore, using the RSI together with the Golden and Death crossovers can provide a more thorough view of the cryptocurrency or asset's price movements and the possibility for various entry or exit points.
Apart from the Relative Strength Index (RSI) indicator, there are several other indicators we can also add to make our technical analysis more effective at the moment of making a decision. These other indicators include;
Moving Average Convergence Divergence (MACD):
The MACD is a trend-following momentum indicator that helps identify potential buy (Golden Crossing) and sell (Death Crossing) signals. This indicator usually consists of two lines, the MACD line and the signal line, along with a histogram, hence, if the MACD line (Short-term) crosses above the signal line (Golden Crossing), it suggests a bullish trend and market entry point, and when it crosses below (Death Crossing), suggesting a bearish trend and market exit point.
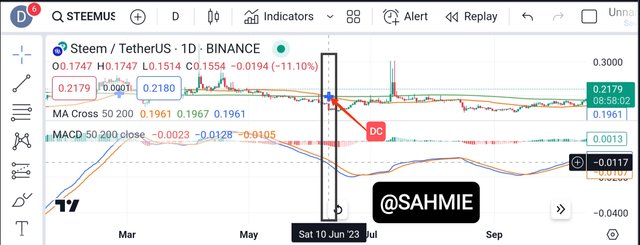
Applying the MACD indicator together with the MA Crossing indicator also show that the MA Crossing is not so foolproof. On the same 10th of June where the MA Crossing indicator indicated a downward trend, the MACD indicator was already on a downtrend, whereas the MA Crossing was just predicting the downtrend, showing the MA Crossing indicator is lagging behind.
Bollinger Bands:
The Bollinger Bands is an indicator that consists of a middle moving average line and two outer bands that represent standard deviations from the moving average. This indicator is used to identify volatility and potential price breakouts. Hence, when the price touches or crosses above the upper band, it may indicate overbought conditions, suggesting a downtrend and point of exit. When it touches or crosses below the lower band, it suggests oversold conditions, hence suggesting an upward trend and the point of entry.
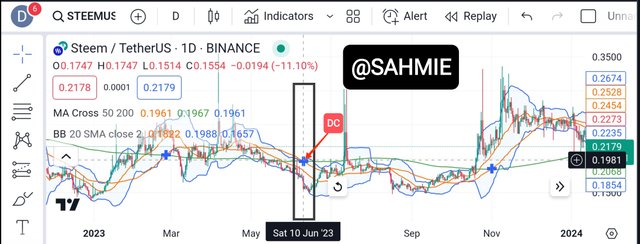
Applying the BB indicator together with the MA Crossing indicator also show that the MA Crossing is not to be trusted solely as on the same 10th of June where the MA Crossing indicator predicted a downward trend, the BB indicator predicted the opposite as the price index was already touching the lower bands indicating an upward trend reversal.
Stochastic Oscillator:
The Stochastic Oscillator like the RSI measures the momentum of price movements and helps identify periods where an asset is being overbought and oversold. It consists of two lines, %K (which is the ratio of an asset or cryptocurrency's current price position to the price range) and %D (the ratio of the moving average to the %k).
Like the RSI, it also uses two values (20 and 80) to indicate Overbought and Oversold conditions. Therefore, when the price ratio of an asset or cryptocurrency is above 80, it suggests overbought conditions (Death Crossing situation), whereas when the ratio value is below the 20 mark, it suggests oversold conditions (Golden Crossing situation).
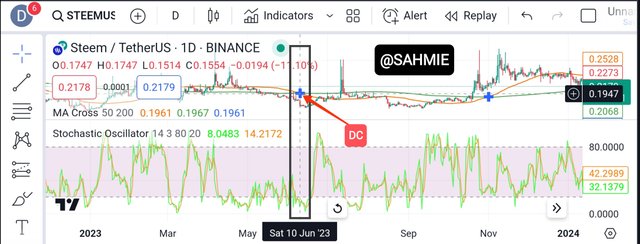
Applying the Stochastic Oscillator together with the MA Crossing indicator also show that the MA Crossing is not to be trusted alone as on the same 10th of June where the MA Crossing indicator predicted a downward trend, the Stochastic Oscillator indicated the opposite as the price index was already below the 20 mark, indicating a potential upward trend.
Fibonacci Retracement:
The Fibonacci Retracement makes use of horizontal lines to indicate potential support and resistance levels based on the Fibonacci sequence, and it is used to identify potential price reversal levels during a trend.
Moving Average:
This indicator smooths out price data over a specific period, which in turn helps users to identify trends. The most common types are the simple moving average (SMA) and the exponential moving average (EMA).
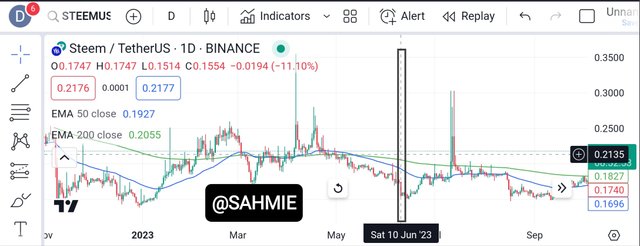
Applying the Moving Average Exponential indicator with two moving averages, 50 days for the short term and 200 days for the long term same as the MA Crossing indicator also shows that the MA Crossing is not to be trusted solely as on the same 10th of June where the MA Crossing indicator predicted a potential downward trend, the EMA indicator shows an already in motion downward trend, showing that the MA Crossing indicator is lagging behind.
Ichimoku Cloud:
The Ichimoku Cloud indicator provides a broad view of the support, resistance, and trend direction of an asset or cryptocurrency. It consists of several lines and a cloud area that helps identify potential entry (Golden Cross) and exit (Death Crossing) positions.
Average True Range (ATR):
The Average True Range (ATR) indicator measures the market volatility of an asset or cryptocurrency by calculating the average range between high and low prices of an asset or cryptocurrency over a specific period.
Therefore, it is always a good idea to combine multiple indicators to get a more thorough analysis, however, know that each indicator comes with its strengths and weaknesses, so it is always important to understand how they work and how they fit into your overall trading strategy.
CONCLUSION |
Both Golden Cross and Death Cross are indicators that traders use to help them spot potential changes in the price of an asset or cryptocurrency in the market, helping them make informed decisions about buying or selling an asset. However, one should keep in mind that these indicators are not foolproof, hence users should learn to incorporate other indicators to help make better decisions.
I wish to invite @yakspeace, @ninapenda, @ruthjoe, @drhira and @suboohi
Thank You for your Time
NOTE: Always have a smile on your face, as you are never fully dressed without one.

Your post is always outstanding but the last question you have answered in a very detail depth way and most likely when I was searching for it I really don't know how to answer this question I found it very difficult and for me to having better understanding then I search a lot and so when I see your post you have answered very nicely and you have you so many indicators and well with the explanation of the chart to make it clear understanding that's the best part of your post.
RSI index and with the long that MacD I found to have a best use for Golden cross best of luck friend for this contest
Downvoting a post can decrease pending rewards and make it less visible. Common reasons:
Submit
Downvoting a post can decrease pending rewards and make it less visible. Common reasons:
Submit
Thank you so much for your kind words. I'm thrilled to hear that you find my posts outstanding. I'm glad that my detailed and in-depth answer to the last question was helpful to you. I understand that it can be challenging to find the right answer sometimes, but I'm glad I could provide clarity with my explanation and the chart. It's great that you found the RSI index and MACD to be useful for the Golden Cross. Best of luck to you too, my friend, in the contest. Keep up the fantastic work.
Downvoting a post can decrease pending rewards and make it less visible. Common reasons:
Submit
Your welcome 🤗🤗 your the best in cryptoacdemy Contest knowledge
Downvoting a post can decrease pending rewards and make it less visible. Common reasons:
Submit
Upvoted! Thank you for supporting witness @jswit.
Downvoting a post can decrease pending rewards and make it less visible. Common reasons:
Submit
Upvoted. Thank You for sending some of your rewards to @null. It will make Steem stronger.
Downvoting a post can decrease pending rewards and make it less visible. Common reasons:
Submit
This is a perfect explanation from you sir. Death Crossover and Golden Crossover are two perfect ways of knowing bullish and bearish market.
Downvoting a post can decrease pending rewards and make it less visible. Common reasons:
Submit
Thank you so much for your kind words. I'm glad you found my explanation to be perfect. You're right as the Death Crossover and Golden Crossover are indeed two effective ways of identifying bullish and bearish market trends. They provide valuable insights for traders and investors to make informed decisions. It's great to see your understanding of these concepts.
Downvoting a post can decrease pending rewards and make it less visible. Common reasons:
Submit
TEAM 4
Congratulations! This post has been voted through steemcurator07. We support quality posts and comments!Downvoting a post can decrease pending rewards and make it less visible. Common reasons:
Submit
Thank you so much @malikusman1, I very much appreciate your support. It's been a long while I saw one of this on my publications.
Downvoting a post can decrease pending rewards and make it less visible. Common reasons:
Submit
You have created a very high quality post and have demonstrated your trading skills through charts . The analogy of vehicles on a field trip effectively simplifies the concepts of Golden Crossing and Death Crossing, making it relatable for readers unfamiliar with cryptocurrency terminology. It cleverly ties the excitement or disappointment of overtaking or being overtaken to the bullish or bearish signals conveyed by these crossings.
Good lock .
Downvoting a post can decrease pending rewards and make it less visible. Common reasons:
Submit
Thank you for the kind words. I'm glad you found the post helpful in simplifying the concepts of Golden Crossing and Death Crossing. It's always great when analogies can make complex ideas more relatable. And I did share the analogy of comparing it to vehicles on a field trip and the excitement or disappointment of overtaking or being overtaken hoping it does help convey message about the bullish or bearish trend signals to those new to this terms. I appreciate your support and Good luck with your trading endeavors.
Downvoting a post can decrease pending rewards and make it less visible. Common reasons:
Submit
Dear @sahmie,
Your explanation of the Golden cross and death cross was cool.it was done in a way that even a newbie in cryptocurrency can understand that.
I also appreciated your taking time to explain the various indicator which could be used to perfect or reconfirm the signals given by the GC and DC.
Overall, it was an insightful writeup. Wishing you the best In this contest.
Downvoting a post can decrease pending rewards and make it less visible. Common reasons:
Submit
Thank you so much for your kind words. I'm glad that my explanation of the Golden Cross and Death Cross in cryptocurrency was helpful and easy to understand, even for someone new to the world of crypto. It's important to make this concepts accessible to everyone. I'm also happy that you found the additional information about other indicators useful in confirming the signals given by the Golden Cross and Death Cross. I appreciate your feedback and support. Wish you the best too.
Downvoting a post can decrease pending rewards and make it less visible. Common reasons:
Submit
Has realizado un contenido bastante completo de las pautas exigidas del desafío abarcando el tema con gran explicación y dominio del tema.
Has regalado los detalles para aplicar el indicador y has hecho la interpretación adecuada de los resultados para el BTC y el STEEM.
Una de las características reveladores de una buena señal de la tendencia es su confirmación con los volúmenes que entran en la tendencia, después de ocurrir el cruce, pues una reversión de la tendencia a esas alturas calificaría al cruce como una falsa señal.
Me gusta aplicar el indicar RSI, es muy sencillo de entender y aplicar para tomar posiciones de compra o venta muy eficiente.
También me gusta observar las Bandas de Bollinger para estudiar la tendencia.
Gracias amigo por tu aporte en conocimientos a través del presente post.
¡Te deseo mucho éxito!
¡Saludos y un fuerte abrazo!
Downvoting a post can decrease pending rewards and make it less visible. Common reasons:
Submit
Your post is very detailed and you have covered the topic with great explanation and solution. You've combined it with daily life examples to make it easy to understand, making it relatable to readers unfamiliar with cryptocurrency terminology. Your writing with this information is a good creation. Best wishes
Downvoting a post can decrease pending rewards and make it less visible. Common reasons:
Submit