INTRODUCTION
Greetings steemians, i have returned to share my knowledge on the Advanced Technical Analysis with Divergence Trading, as I directly write based on the hints given to us by the professor.
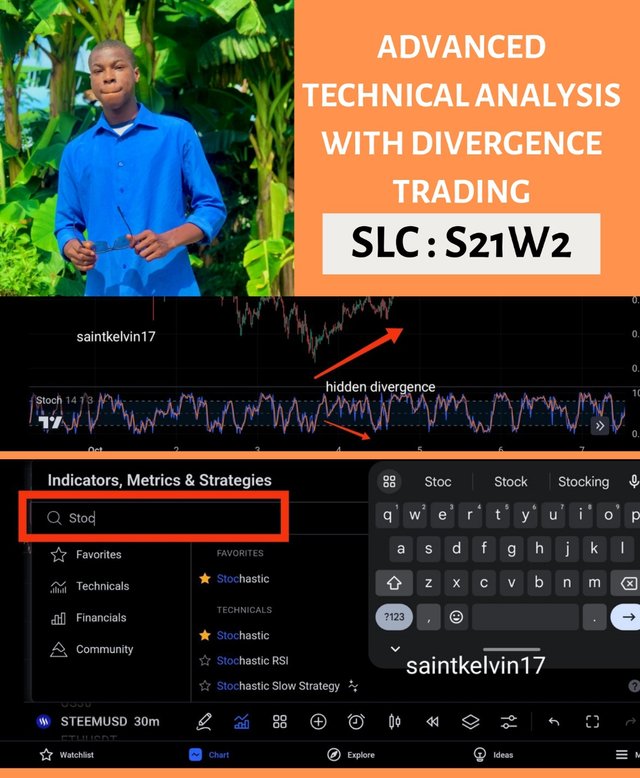
Question 1: Explain the Concept of Divergence in Trading
Divergence in technical analysis happens when the price movement of an asset and one of its indicators backed up by a momentum oscillator such as the Relanvti Strength Index (RSI), Moving Average Convergence Divergence standard or stochastic oscillator start to move in opposing directions. This phenomenon implies that the current trend is diminishing and may turn around. Divergence is particularly helpful for traders as it can warn them of an anticipated change in market trends and direction that may not yet be reflected in the price action.
As an illustration, consider this: if an asset is experiencing an appreciation trend, and its RSI begins to fall, this may be a signal that buying pressure is starting to fade out. Divergence serves as a reminder of these gaps between price and momentum trends, and helps traders determine whether a trend has real market strength backing it or is just overstretched and close to breaking down.
Divergence can be classified under two main categories which are bullish divergence and bearish divergence. Bullish divergence can be seen when an asset’s price falls to a new low but an indicator indicates a higher low.
This pattern shows that the selling pressure is getting weaker and it is probable that the trend will change to a bullish trend. For instance, if a stock price moves down and registers a new low and the MACD hits a higher low, then the traders may assume that the selling pressure is now weak and change is likely to be to the upside i.e. the market will likely go up.
On the other hand, Bearish divergence occurs when the price reaches new heights and the indicator fails to do so which leads to an assumption that there is low buying momentum. In a situation where the price is moving upward and higher highs are created however the RSI or MACD is lower, this sends an alert that buyers are losing control and another upward swing is unlikely therefore increasing chances that the next swing will be downward. Such lines of vision help traders spot exhaustion or potential trends and reversals with ease.
Divergence as an indicator can be very useful when looking to forecast trend changes such as bullish or bearish. It is essential to combine the use of divergence with other tools, as it is not perfect on its own.
People are frequently misled, especially in active markets where the price and indicators are off throttle for a brief moment. This explains why several people include additional tools to support the signals provided by the divergence; additional tools can include volume analysis, levels of support and levels of resistance, and price patterns. Furthermore, it is critical to have a comprehensive understanding of price action and the indicator to comprehend divergence as it involves how much the momentum is in alignment with the price trends.
When employed appropriately, divergence is useful for traders as it allows them to know the possible future movement in the market, therefore giving them an advantage. However, the degree to which it is efficient differs, and its useful nature simplifies when combined with other technical analysis forms, assisting traders in improving their entry and exit strategies by better recognizing the trend’s price movements.
TYPES OF DIVERGENCE
- REGULAR DIVERGENCE:
Regular Divergence is a well sought after signal in technical analysis which presages an imminent trend reversal. Regular divergence is the case when the price of an asset and a technical indicator like RSI or MACD move in opposite directions.
This type of divergence indicates that the price action currently dominating the market may be running out of steam and warns traders of an impending reversal. Regular divergence can be of two types,:- bullish and bearish. Bullish regular divergence occurs during downtrend where the price makes a new lower low but the indicator makes a new lower high.
This discrepancy indicates that even though price is making new lows, there is less and less selling momentum and this suggests that a price reversal is likely. As a result, traders consider this divergence as an opportunity to buy, believing that the assets selling pressure has probably has plummeted. Through identifying regular divergence, traders can recognize certain stages of the trend and prepare for future changes in the market trend.
Nonetheless, it happens that otherwise bullish situations show up on the daily chart. Bearish regular divergence shows itself in an uptrend when there is a new peak with a higher high in general price action, but high is formed on the indicator. This form of divergence indicates that while the price is pushing upwards to set a new high, the levels of buying have begun to decline, thus a reversal in price is likely.
Such situations are designed in a way that discourages further buys, or advises buyers to close their long positions, as reversals of the upward momentum trend will be happening soon. Such divergence is frequently considered confirmation of the fact that the buyers are losing their control over the price action, which brings the likelihood of a period of selling pressure on position holders.
Likewise, by employing bear regular divergence as per that designed in the first instances as a warning against losses from price changes, traders time their exits. In a nutshell, therefore, regular bearish divergence regulars embraces the bearish market trend enabling traders to make profits by either selling at a higher price or preventing a loss if a clear uptrend is reversing.
Regular divergence charts are insightful to the underlying market behavior and can be applicable across different time horizons hence, either short-term traders or long-term traders can utilize it. Nonetheless, similar to every technical indicator, regular divergence possesses its drawbacks and can provide invalid signals when the market is under extreme fluctuations.
For this reason, traders frequently use other indicators along with regular divergence, such as support and resistance areas or trend lines, to check out the level of the potential reversal before they take the trade. Principles of confirming divergence elements, other than regular divergence, are common in many commercial applications, notably price bars initiated combinations of candles, price runs or trading pauses.
Regular divergence alone along with these other indicators helps traders to identify true trend changes better and avoids unnecessary false signals. If you rely on regular divergence, this is worth praying in God’s direction if you believe that there will be an alteration in the direction of the market.
- HIDDEN DIVERGENCE:
Hidden Divergence is another type of divergence useful to the traders in determining the likelihood that a current trend will be continued as opposed to predicting that it will be reversed. The hidden divergence is unlike regular divergence in that the latter indicates a likelihood of trend weakness while the former indicates trend enforcement.
Hidden divergence occurs when price and the indicator move against each other substantially enough to suggest more of the trend. For example, in fictive hidden divergence/selling divergence, the price makes a higher low on a pullback when the price moves upwards, but the indicator makes a lower low when the price was at a higher high. This implies that the pullback is likely to see little selling pressure, therefore the upward trend is likely to continue.
This is viewed by the traders as the moment for making purchases of the instrument since hidden divergence indicate that the market is still, upwards average over several periods. Hidden bullish divergence can also reassure the traders wishing to increase the size of their positions helping them take advantage of tempory decreases in price without the fear of a wholesale trend reversal.
On the other hand, bearish hidden divergence can be defined as the one that occurs in a downtrend and attempts to show that the downtrend will persist. Here, the price is said to have made a lower high when the price was in a rally, and the indicator is interpreted to be at its higher high.
This tendency suggests that there is little buying power in the rally and that the sellers are about to overhaul and depress the price further. If the traders are in a short position and sees this type of pattern, they tend to remain in this position as it confirms the downtrend. By utilizing such a technique, traders show a tendency to stay in a trending position without the fear of reverse pressure.
That is, knowing bearish hidden divergence tells them that the price will still go down, allowing them to stay in position no matter how deep the white gashes cut. This form of divergence protects the traders from being “shaken out,” or hopping in and out of trades, when the market makes moves against them.
Hidden divergence is particularly advantageous for the trend-following traders attempting to benefit from long handles in the market. But, just like the regular divergence, it is also not reliably accurate all the time, and may periodically give false trades.
To increase the efficacy of hidden divergence, traders regularly use it together with other tools like moving averages, trend lines, or even Fibonacci retracement levels for trend’s viability confirmation. Also, volume analysis may be important since later, in case of the hidden divergence formation, its volume increase will further confirm the trend direction strength.
Therefore, traders are able to significantly increase their success chances of hidden divergence trades and therefore increase their ability to profit from trend riding. In the end, hidden divergence is what traders use to define the direction trend strength helps to validate when to enter positions or how much you wish to add into an already existing position in a strong trend.
To conclude, both regular and hidden divergences although different in application purpose, are two crucial aspects in technical analysis of the market. Regular divergence assists in evaluating the quality of the movement which in turn alerts traders to potential change of mood in the market when there is a separation of momentum and price.
Hidden divergence on the other hand facilitates the maintenance of a trend allowing reinforcement of the trend when a pullback or a rally occurs thus reassuring traders of their position. Learning both types of divergence helps traders prepare for different market environments.
Regular divergence allows for getting out or getting in with the trade expecting a reversal, while hidden divergence is suitable for riding trends entering the trade at the best points in the trends lifetime. Both regular and hidden divergence can when combined with other indicators and technical analysis tools, improve a trader’s ability to assess and react to changes in market momentum for better and timelier trades in a wide range of market conditions.
THE SIGNIFICANCE OF EACH TYPE AND HOW THEY RELATE TO POTENTIAL REVERSALS OR TREND CONTINUATIONS.
Regular divergence is an important tool for traders who want to find the trends that are about to shift. Such kind of divergence can be observed when there is a scenario where the asset price and a momentum indicator such as RSI/MACD move into opposite directions. For instance, let’s consider a downtrend. When the price reaches a new low, but the indicator shows a higher low, this is called regular divergence and it tends to be bullish because any further drop in this indicator would mean there is a bullish signal on the charts up coming soon.
This means that since the prices have decreased, selling is weakening and demand would begin to overpower what is in stock eventually increasing price. Now, let’s consider an uptrend situation. When the price increases and makes a new high, but the indicator does not follow and create a new high this is called regular divergence and it is described as being bearish, which means there is a likelihood of the upward trend weakness and a reversal will begin. Regular divergence is a good tool for people who want to take advantage of reversals early because it allows them to see an upcoming shift before it is assured by the price, which makes it easier for them to time the trades effectively.
The application of regular divergence over reversal is highly emphasized. Regular divergence indicates to the trader the possible discrepancies which occur when the price and momentum are not in sync with one another: there is a trend out there but if the trend continues, or it is still strong. If an uptrend continues, for example, bullish regular divergence notifies buyers that the pressure available in the downward trend may have been progressively diminishing, this makes the timing for buyers right to take up the market and increase prices.
Bearish regular divergence also shows that the strength of buying pressure in an uptrend is slowing down and sellers may take control. This kind of divergence serves as a sign that the trend in the other direction will soon be in place, so it helps traders make moves at times that are most advantageous for opening and closing positions.
Regular divergence is significant in these markets because they assist traders in preventing acting too fast and making losses based only on price changes. In these markets, where prices change consistently and reversals are frequent, regular divergent becomes valuable since it prevents traders from losing trades too early.
Regular divergence is a good potential reverse identifier. It is however not a magic bullet and should be further confirmed. It is common for traders to use divergence signals along with other technical indicators including areas of support and resistance, volume or moving averages which assist in determining the potential viability of the reversal. In addition, the regular divergence is more effective when it is combined with the occurrence of price’s structures such as double tops and double bottoms and so on, as these structures also reinforce the divergence signal. Using a combination of different methodologies effectively minimize false signals and assist traders in making sound decisions.
In conclusion, we can say that one of the most important functions of regular divergence is that it warns the trader on a possible reversal and in this way enables him to set orders in light of what is expected to happen next in the market. As long as regular divergence is properly understood and employed, it should illustrate areas of where the direction of the market changes. This is a key component of risk management and the decision making process when it comes to trading to achieve profit.
At the same time, as hidden divergence emphasizes continuation rather than reversals, it can also be used in trading. Hidden divergence is where price action and an oscillator move in a manner where a trend is expected to continue even if retraced.
For instance, in an uptrend, bullish hidden divergence occurs when price action shows a higher low but indicators show a lower low. It implies that a minor dip in price does not change the forward momentum, instead it’s a small disturbance during an active uptrend. Therefore, this type of divergence strengthens the hands of the traders, as they know the momentum in which price is moving is still strong.
Similarly, in a downtrend, bearish hidden divergence occurs when the price shows a lower high in a rally and the indicator depicts a higher high. This suggests that an existing trend is only temporary and the downtrend will resume. Hidden divergence is very important for those who want to stay in the strategy during the trend since they have more security towards the strength of the trend.
The importance of hidden divergence is that it helps confirm trend strength, which enables traders to stay in positions comfortably for an extended period and make use of longer price movements. Through the recognition of hidden divergence, a trader understands that a retracement in price is just a consolidation in the direction of the primary trend and not a reversal in trend.
For example, in a bullish hidden divergence, even if there is a price correction, the lower low in the indicator implies that demand is still present and the uptrend is likely to continue. This confirmation enables the trend following traders to remain in position without the worry of getting ‘shaken out’ of the position by daily fluctuations.
Alternatively, bearish hidden divergence allows traders to realize that the buying power of a retracement in a downtrend is not sufficient to change the trend, hence traders can stay short or enter short positions. In this manner, hidden divergence is able to assist traders in making sure that potential gains are not missed because retracements are not mistaken as reversals.
In order to effectively utilise hidden divergence, traders do not haphazardly use it alone but alongside other technical indicators and analytical tools such as trend lines, moving averages and Fibonacci retracement measures to provide confluence for the prevailing trend.
Hidden divergence is also confirmed with regards to volume, where the increase in volume during a market retracement can also suggest trend stay intact and hence will likely continue. The combination of hidden divergence and these other techniques enhances the traders‘ comprehensiveness of the market and their abilities to interpret trend continuation signals with accuracy.
To conclude, hidden divergence is important in the sense that it helps traders ride the trends to the maximum by differentiating between corrective moves and reversal moves. Basically, this reserve function of hidden divergence and its confirming ability to polarity of the mean make it remarkably heavy and crucial for any trend-following trading style.
Question 2: Identifying Divergence with the RSI or MACD
In order to attempt this part, I decided to apply the rsi indicator to the price chart and then I'll show how to find a divergence using the rsi indicator.
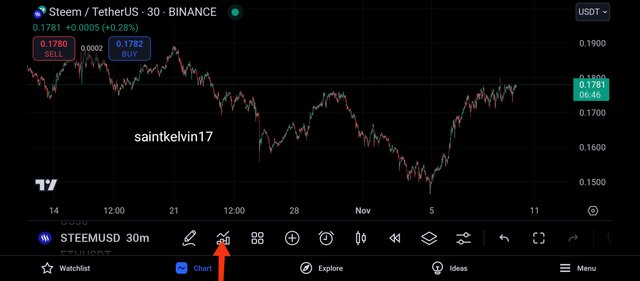
I moved to the trading view app as it is on this app that I take my analysis for my crypto trades, and from the above screenshot, I was able to, and I immediately moved to STEEMUSDT which is the pair I am about to carry my analysis on.
And then I decided to add the rsi indicator which will is a very important tool in searching for a divergence while trading.
And to do that, I clicked on the icon indicated above as the icon is usually used when a trader is about to add or search for indicators to make use of.
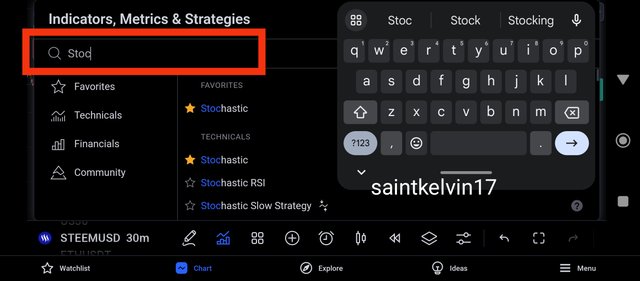
After clicking on the indicator icon, the above image appeared and I went ahead to search for the rsi indicator that I intend to apply to the price chart.
After inputting the first letters of this indicator, the indicator came out and I immediately clicked on it, just as shown below.
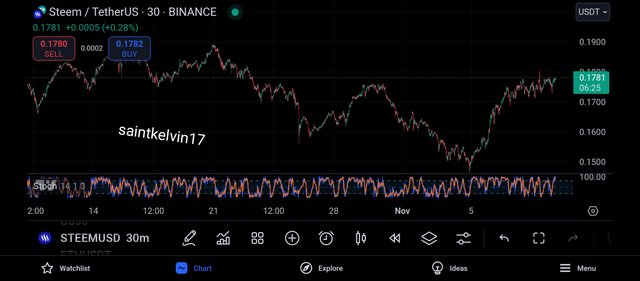
And from the image above, we can see that the rsi has been added to the price chart through the process I just explained.
Now let's proceed to search for our divergence signal.
- BULLISH DIVERGENCE:
As explained in the first question of this challenge, I will explain a bullish divergence in a simple term.
A bullish divergence can be explained to be a trading signal that confirms the weakness of the bears in the market and the strength of the bulls in the market.
A bullish divergence can either be a regular divergence or an hidden divergence which I will explain here.
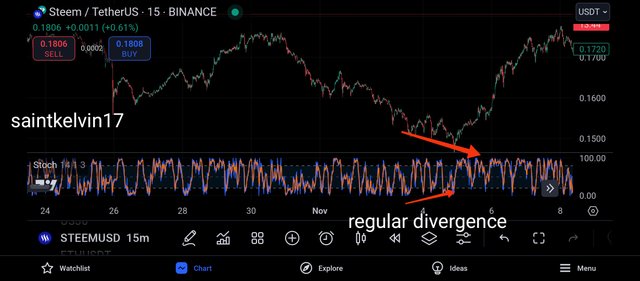
The screenshot above of STEEMUSDT on the 15m timeframe shows a perfect example of a bullish divergence.
When searching for a regular bullish divergence, we can expect to price chart to create lower lows while the rsi indicator creates a higher low.
A very interesting factor to note is that when searching for a bullish divergence, we are most likely interested in the support levels of the price chart and the indicator.
And from the image above, we can see the price chart making a lower low and the indicator making a higher low.
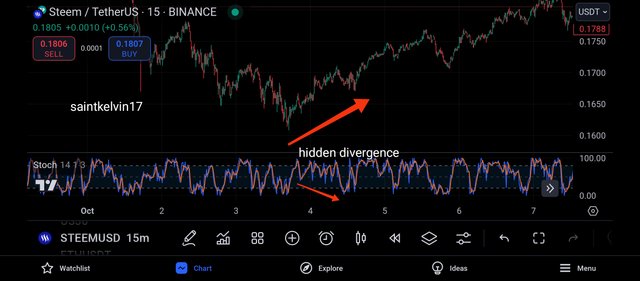
The above screenshot is another beautiful example of a bullish divergence but looking carefully, we would notice that it is very much different from the other screenshot.
Here, on the screenshot above is an hidden bullish divergence.
An hidden divergence often signals a trend continuation rather than a trend reversal, and as seen above, the price chart created a higher low while the rsi indicator created a lower low.
- BEARISH DIVERGENCE:
A bearish divergence is understood to mean the exact opposite of a bullish divergence, in the sense that when a bearish divergence is signaled, the market is expected to be accompanied by bearish candles.
And just like the bullish divergence, a bearish divergence also comes in the form of regular bearish divergence and hidden bearish divergence and I will be showing them below.
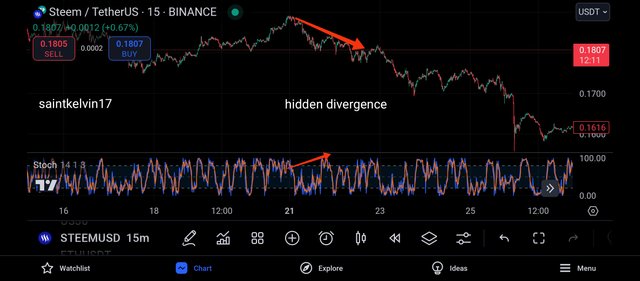
The above screenshot is that of STEEMUSDT on the 15m timeframe, and shown above is the perfect example of an hidden bearish divergence.
One secret about a bearish divergence is that we always watch the resistance level of both the price chart and the rsi indicator.
And from the above screenshot, we can see that the price chart formed a lower low and the indicator created a big low, which shows the strength if the bears in the market.
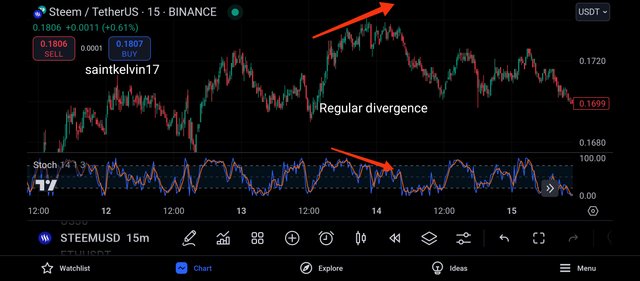
The screenshot above is that of STEEMUSDT showing another example of a bearish divergence in the price chart.
And from the screenshot above, we can see that this is a regular bearish divergence and it is different from the bullish bearish divergence.
And like I earlier explained, the regular divergence signal a trend reversal and an hidden divergence signals a trend continuation.
HOW THIS DIVERGENCE COULD HAVE INFORMED TRADING DECISIONS
The use of divergence in crypto trading is one of the most effective way to predict price movements, as the divergence helps us in identifying a potential trend reversal and trend continuation.
- TREND REVERSAL:
A trend reversal is understood to mean a change in market trend, that is, if the market was formerly bullish, it will then become bearish and if the market was for shell bearish, it will then become bullish.
Divergence plays a very important role in identifying trend reversal in market price, and this form of divergence is what we know to be the regular divergence.
In a bullish trend, when we notice that the price chart creates a new high but the rsi indicator has failed to create a new high, we can thus call this a bullish regular divergence, and this implies that the bulls have become weak in the market and we should expect the bears to take control.
Likewise in a bearish trend, when a regular divergence is spotted, we can expect to see the bulls take control of the market as the bears have become weak in pulling the market downwards.
And a bearish regular divergence can be detected when the price chart creates a new high and the rsi indicator fails to create a new high, rather it creates a low.
- TREND CONTINUATIONS:
Just as the name implies, a trend continuation is understood to mean the continuity of the market in its prevailing trend.
This means that if the market is in a bullish trend, and the divergence is formed, the market will continue in its bullish trend by creating new highs in the market.
Ideally, the type of divergence responsible for a trend continuation is what we know to be the hidden divergence, whenever the hidden divergence is formed, we can expect to see the continuation of the market's prevailing trend.
For a bullish hidden divergence to be seen, it will be noticed that the price chart created a new high while the rsi was unable to create a new high.
And for a bearish divergence to be noticed, we would see the market creating a new low while the rsi is unable to create such.
Question 3: Combining Divergence with Other Indicators
The validity of trading signals and decisions is also improved through the use of divergence in combination with other indicators, these can be moving averages, Bollinger Bands, or volume analysis. By themselves, divergences point to possible trend based retractions or continuations, the combination of these with moving averages however provides the requirement of trend direction and strength attributes in addition to serving to support the signal. For example, a reversal could come about thanks to a bullish regular divergence; however, if, due to a short term moving average crossing above a long term moving average also known as ‘golden cross’, this crossover can further enhance the uptrend movement.
The other area of concern is if the bearish regular divergence came about while the price is moving through the lower threshold of a major moving average such as 50 day or 200 day moving average, it indicates further upward progression. Moving averages are employed by the traders for the most part in order to identify medium and long term trends while avoiding disarray brought about by short term price changes.
The alignment of divergence with other patterns such as moving average crossovers or trend line breakouts validates the price direction indicated by divergence as it makes it probable that this is not a short-term fluctuation but a trend marker, therefore enabling better deciding on trades.
Bollinger Bands together with divergence is also another way of confirming trading signals taking into consideration the aspect of volatility. A typical Bollinger Bands consists of an upper and lower band situated either side of a simple moving average which represents price changes and therefore allows traders gauge on volatility changes. When price trades close to the outer Bollinger bands, it implies that the asset is overbought or oversold.
For instance, if a bullish divergence shows up around the lower Bollinger Band, it implies that the generated selling zoom is decreasing at an oversold level hence increasing chance of a bullish reversal. This signal is made even stronger when the price moves back above the lower band to stay within the clouds. Lower band gets crossed during the sell-off and the price does not come back into the band, defining that the downward trend may be terminating.
Bullish divergence appearing near the upper Bollinger Band and Upper band getting touched or crossed provide a possibility of a bearish activity, exposing the fact that the asset may be overbought. This combination of divergence with Bollinger Bands provide an effective tool for the traders allowing them to measure cyclical structure and resiliency of the asset comprehensively reducing chances of wrong trades.
Providing volume analysis along with divergence is yet another useful technique in the confirmation of trends and trading signals. This volume indicates the intensity level of a particular price action, and volume changes can lend credence to divergence signals and demonstrate the strength of shift in momentum.
For example, when bullish divergence is confirmed with volume increasing, it implies that new buyers are arriving into the market. This therefore means that there is now more chances of a reverse bullish trend. On the other hand, if the volume is decreasing and bearish divergence is present, buyers are losing interest which may mean price will likely fall. Volume can also show divergences within itself, such as when the price reaches a new high while volume did not and therefore may indicate that the upward move lacks conviction.
Therefore, through analyzing the divergence and volume, traders have an idea whether wider market interest will support possible reversals or continuation and thereby enhancing the accuracy of their analysis. A combination of these three data sets, aids traders in the pursuit of developing a consistent trading plan. The robustness of the analysis is significantly raised and makes it possible for the traders to trade confidently.
Alongside the rsi indicator that I make use of to identify divergence trading, I will be searching for bullish and bearish entry with the use of bollinger band indicator, and to this, I will follow the footsteps shown below.
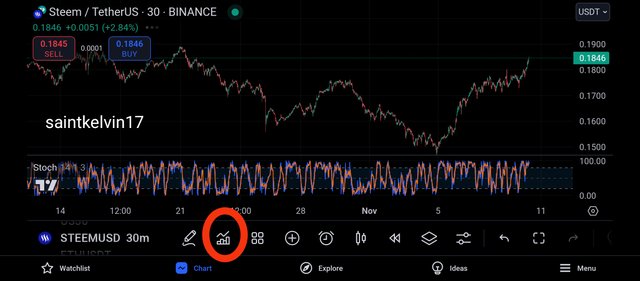
With my rsi indicator on the price chart, I decided to add one more chart which is the bollinger band and to do this, I clicked on the indicator icon as shown above.
And then the image below appeared, after which I inputted the name of the indicator that I intend to make use of.
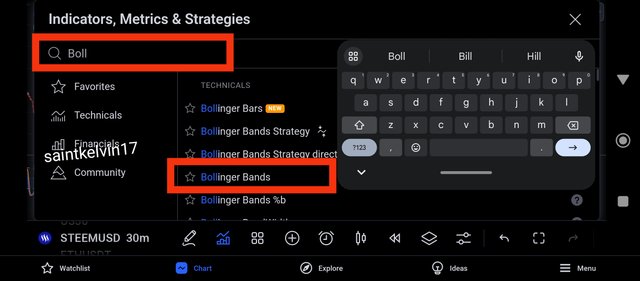
And from the screenshot above, we can see that there are different types of analytical tools with the name bollinger, then I decided to search for the one I intend to make use of.
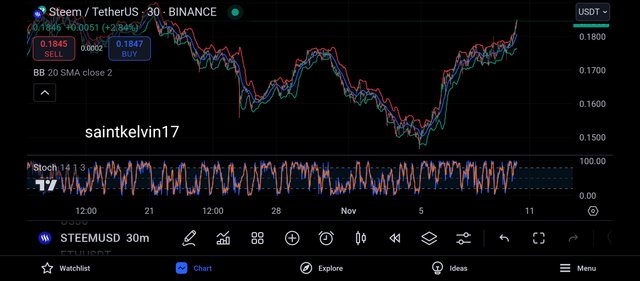
And here we have it, the bollinger band is applied to the price chart and then I can proceed to search for the divergence which is required in this section.
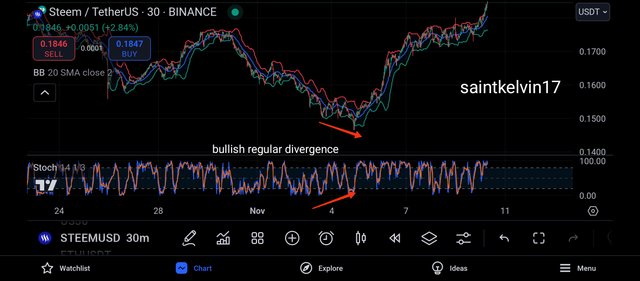
While Searching for a very good example of divergence, I came across the bullish regular divergence, and as we earlier explained, a regular divergence signals a trend reversal of the market price.
From the above screenshot, we can see that the price chart formed a lower low while the rsi indicator formed a higher low, and this indicates the weakness of the bears in the market.
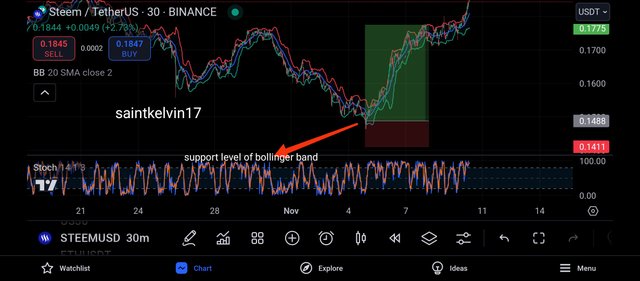
And as a confluence, I noticed that the market has traded on the support level of the bollinger band, and there are lots of buyers resting on this level, waiting to push the price upwards.
And with this confluence, I can proceed to place a buy on the market immediately, just as seen above.
And then I decided to search for a bearish signal in the market also.
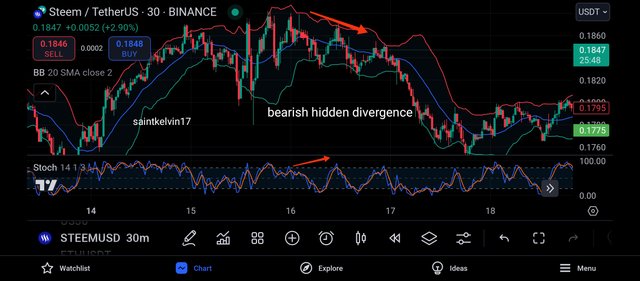
And looking carefully, I was able to identify a bearish hidden divergence, and a bearish hidden divergence is one that signals a bearish trend continuation.
From the screenshot above, we see that the market created a new low which indicates it's continuation of the bearish move while the rsi indicator created a new high.
And then we can see what follows, series of bearish candles but then I need to search for confluence in the market.
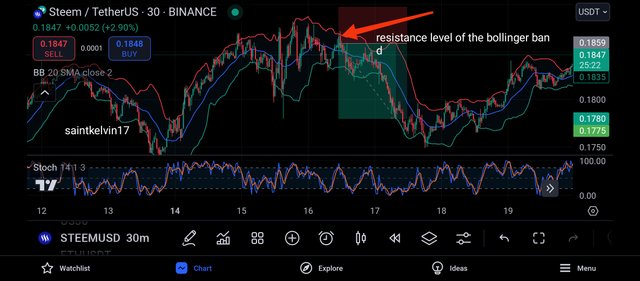
As a confluence, I realised that the market has traded towards the resistance level of the bollinger band, and in one of our lectures, we learnt on the importance of the upper band of the bollinger band.
Whenever the market trades towards this level, it shows that the market is being overbought and the buyers have become weak in the market.
Question 4: Developing a Divergence-Based Trading Strategy
To develop a trading strategy that is divergence based is a quite easy task and here are the things I watch out for.
- TREND IDENTIFICATION:
While developing my trading strategy, the first step I'll take is to identify the overall trend of the market and this can only be done on the higher timeframe, most preferably the monthly timeframe.
Just as the saying goes , the trend is your friend and I don't intend trading against the market trend as research as shown that this is very costly.
It is practically wrong to take a buy order in a bearish market as this can cost one a lot, trading in the direction of the trend is usually very important and very profitable.
- IDENTIFY DIVERGENCE:
The next step I'll take after identifying the prevailing trend of the market is to identify a divergence signal that is in alliance with the trend of the market.
For example, If the market is in a bullish trend, I won't go about searching for a bearish divergence, rather I will be in search of a bullish divergence.
Likewise, if the market is in a bearish trend, I will watch out carefully for a bearish divergence, either a regular or a hidden bearish divergence.
And to identify the divergence, I will make use of rsi indicator, as it is a very effective tool used in identifying divergences in the market price.
- CONFLUENCE USING OTHER INDICATOR:
Another step I'll take is to search for trading confluence using a different indicator, there are different types of indicators that can be used as a confluence to my trade.
I can make use of the bollinger band indicator, the trix indicator, moving average, ichimoku cloud and other indicators.
The use of confluence in trading is very important as an indicator is subject to false trading informations and some other forms of market manipulation.
- MULTI-TIMEFRAME ANALYSIS:
Another criteria I will love to apply is the use of multiple timeframe in my analysis.
The use of multiple timeframe when carrying out analysis is very important, as the use of multiple timeframe helps to filter out false signals, and give you a more profitable trade.
- RISK MANAGEMENT:
The use of risk management in trading is very important, as a successful trader is not known for how many times he trades or how effective his analysis is, but rather, he is known by how effective his risk management technique is.
Like in my previous posts, I will risk only 25% of my trading capital, that is, If I have an account size of $100, I will only risk $25 per trade.
And before my account can be blown, I will have to encounter a loss 4x consecutively.
- RISK TO REWARD:
While placing my trade, I will ensure a risk to reward ratio of 1:3.
This means when I risk $25 in a trade, I will be getting a reward of $75 when the trade hits my take profit level.
And I will ensure that my stop loss position is not too large as this will give me a more risk to reward ratio, which will inturn reduce my risk and maximize my take profit.
Question 5: Limitations and Best Practices of Divergence Trading
LIMITATION OF DIVERGENCE TRADING
Most of the traders are familiar with divergence trading and its importance, but the only few of them are aware of the limitations that can lead to false signals and undesired trades.
It is vital for the traders to understand that even though divergence theory is strong, it does not explain when exactly the trends will change direction or continue in the same direction.
Another thing to note is that divergence may form quite some time before the actual change in price takes place which could lead to a situation where a trader gets in too early if he relies only on this technique.
For example, a standard bullish divergence may point toward the fact that the strength of the downtrend is declining but may continue for quite a long time before finally turning upwards. The doubt here lies in the timing that sometimes makes the traders enter into a position too quickly which may expose them to losses all the way until a positive reversal happens.
In response to this, the traders can incorporate divergences along with a number of different examples such as moving averages to help determine when to get in and out of the trades. Sometimes it can also be beneficial for the trader to wait until the price breaks resistance and then get in the trades which assure them of better returns over time.
It is commonplace in divergence trading to have false signals, and this weakness becomes even worse in trending and ranging markets. Divergence signals are of the greatest value when there is a distinct trend since they can indicate changes in momentum that will be much more likely to result in reversals or further trends development.
But in such choppy markets, divergence may take place rather often without a noticeable price movement due to price fluctuations at a relatively tight band so that significant price movement is not likely to occur. This may lead to several false breakouts where divergence occurs but the anticipated reversal or continuation does not materialize.
Such conditions can lead traders to become hyperactive, buying and selling frequently and therefore incurring much in transaction costs and increasing their level of risk. This can be overcome where traders practice divergence trading only in assets or markets that have a readily visible trend or work with higher time frames to cut down noise.
Another way of cutting down on false signals in trending or consolidation markets is using filters, for instance, divergence can be overlooked unless it occurs in the vicinity of critical support or resistance zones.
Most importantly, understanding the price and indicator movements in divergence trading consistently and correctly can be difficult as they depend to a large extent on the technical indicator and the time frame selected.
Various indicators, for example, the RSI, MACD, or stochastic oscillator, are able to produce different divergence signals, some stronger or weaker than others due to their different formulas and how intensely they respond to price changes.
This difference can cause discrepancies in the expectations especially when one indicator shows diverging price actions and the other does not. Traders must make choices about which indicators and time frames to place most emphasis on and develop a consistent focus to prevent them from over-analyzing the market and receiving conflicting signals.
To overcome this problem, traders might decide to concentrate on a single primary indicator or at most two, which supports their plan and backtest them so as to see the patterns that produce good returns. By following a set of explicit rules such as only taking actions when the direction of divergence corroborates with that of other indicators or the trend conditions, the chances of misinterpretation of shooting solely divergence are minimized hence enhancing their trading strategies.
BEST PRACTICE OF DIVERGENCE TRADING:
There are several great practices of divergence trading and I will be explaining them below.
- IN CONFLUENCE WITH OTHER INDICATOR:
One very effective and great practice of divergence trading is when it is being used in alliance with other trading indicators.
One mistake some traders make us by relying solely on a single indicator, as single indicators are subtle to market manipulation.
When used with simple moving average indicator, or the death cross and golden cross, one can get very effective trading signal which will result to a profitable trade.
- USED WITH MULTIPLE TIMEFRAME:
Another best practice of divergence trading is when it is used in conjunction with multiple timeframes.
A divergence trading is usually stronger whenever the analysis is being done on multiple timeframe, as the other timeframe will further serve as a confluence to one's trade.
- WHEN FOUND IN A TRENDY MARKET:
Another best practice of divergence in trading is when it is spotted in a trendy market, the divergence signals is more visible and effective when the market is trending.
And it is very important to avoid the market when it is in a consolidation phase, at this phase, there's indecision in the market and traders will need to be very careful when searching for divergence on a ranging market.
CONCLUSION
Divergence trading is a very interesting and effective trading strategy used in predicting price analysis, and when used in confluence with other indicators, it produces a more effective trading result.
I appreciate the host of this great contest and I anticipate next week contest already.
Twitter share
https://twitter.com/Saintkelvin18/status/1855573011706830849?t=JRbbzdck7VRPAbYpV_YG3Q&s=19
Downvoting a post can decrease pending rewards and make it less visible. Common reasons:
Submit