INTRODUCTION
Bollinger is the topic for this week, as participants are expected to create their entry in answering questions about mastering steem market volatility using bollinger band, by the teacher. Join me as I take you on a brief trip in this post.
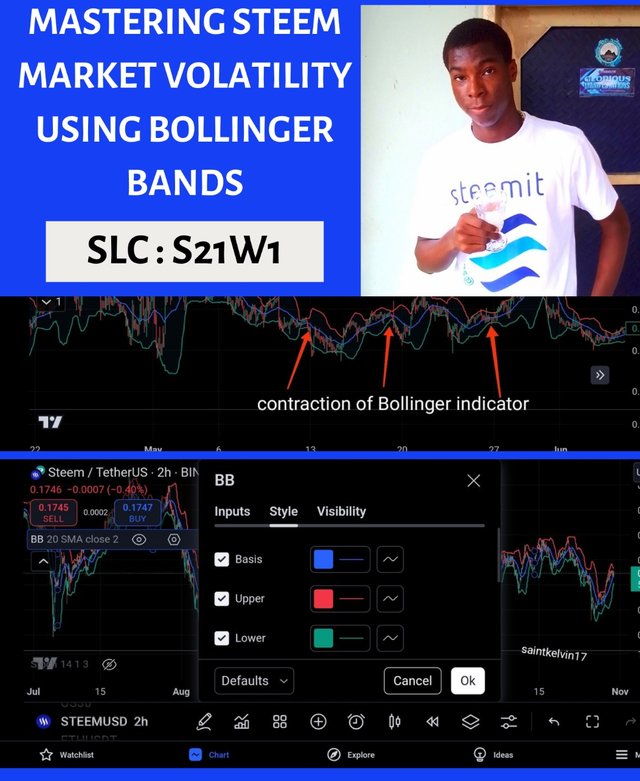
QUESTION 1: EXPLAIN THE COMPONENTS OF BOLLINGER BANDS
- SIMPLE MOVING AVERAGE (SMA):
Bollinger Bands make use of the Simple Moving Average which is the baseline indicator and it calculates the price of an asset over a while. This duration is usually 20 days; however, it can also be altered depending on the time frame of analysis and the volatility of the asset. The Simple Moving Average does this by smoothing out price data through computation of average closing prices for each given time period which helps in eliminating short term noise to focus on the overall trend. Such an average renders a horizontal line that indicates the overall direction of price change over time, and indicates whether the underlying instrument is on an uptrend, downtrend, or moving in a horizontal pattern. Being more conservative than other moving averages, including exponential moving averages, the Simple Moving Average is a good point of reference for the prices remaining within the Bollinger Bands.
The SMA is located between the two bands which are positioned above and below it, and it represents the middle line, in the ploy’s configuration of the Bollinger Bands. The structure of the bands depends on one of the critical elements, which is the centerline. Since the SMA shows the most recent direction of the instrument, it has a crucial application for investors in their asset valuation based on history. When the market price is in close proximity with an SMA, such a market is said to be quiet and balanced but when the market price moves far from the SMA level, it could be interpreted that market conditions are changing or moving to one direction.
SMA is important in trading and can serve its purpose as it places an asset’s price within a context. For traders, the SMA can offer a solid level of reference in their efforts to determine general trend and price level relative to asset such as whether the asset is labeled overbought or undervalued. For example, a curious trader can interpret the price levels above of the SMA and price still increasing as price uptrend allowing more people to buy. On the other hand, in the case where price is significantly below the price of the SMA line, it may yield a favorable position for taking a short position as it indicates dominance of the sellers. This standard feature of the SMA horizontal line, in conjunction with Bollinger Bands, allows traders to analyze price trends in the general direction of the prices in a more visual manner which is why this is such a great component to have while performing the analyses.
- UPPER BAND
An important element of Bollinger Bands is the Upper Band, which indicates the price’s highest point range and is mostly derived as two standard deviations from the simple moving average (SMA). Fluctuations of the price of the asset around the SMA are best expressed through standard deviation, and since two standard deviations are used, the band is able to capture around 95% of the price data, which is normal distribution. The use of these two standard deviations allows the Upper Band to automatically adjust itself to a level of volatility expansion or contraction. As volatility increases, so do the distances between the bands, while low volatility levels narrow the distance between the bands. The Upper Band indicates the maximum price level of an asset and therefore when a price for an asset reaches or surpasses it, it tells the trader of an overbought status. This implies a price level higher than the asset's expected range and therefore a potential price correction or pullback is due.
The Upper Band can be seen as a probable level of resistance for a majority of traders, which means that prices are unlikely to increase too much when they come close to this level. When the price gets closer to the Upper Band or crosses the level, it is normal that some buying pressure will be falling, especially where the asset price is expecting to raise a lot without much of the upward momentum. But however, do remember that even if the Upper Band serves as an indication of being overbought, it does not necessarily mean that there must be a reversal as prices could still progress higher due to market forces. Some traders may regard it as a trend reversal point and may remain cautious after a touch of the Upper Band and look for other signals to provide confirmation on further advance or succumb to the reversal.
Traders may perceive it as an indication of solid demand whenever prices are able to touch the Upper Band on an extensive basis. This may provide encouragement for traders involved in a long position as it would indicate that the demand is considerable. However, if the price reaches the Upper Band only for a very short duration and later on declines, it can signal that the buyers are not as dependable as expected, and can be the potential cause of trend reversal or correction in the short run. In that situation, the Upper Band functions as an elastic band, permitting traders to gauge current price levels relative to historical norms, examining volatility in the security of interest. By understanding how price interacts with the Upper Band, traders can determine whether to close existing positions, initiate new ones or refrain from action until more favorable conditions present themselves.
- LOWER BAND
Equally important within Bollinger Bands is the Lower Band which defines the lower limit of the price range. It is said to be two standard deviations below the SMA and is similar in distance and flexibility to the Upper Band. The Lower Band is flexible and varies depending on the market condition. Usually, it is wider in a volatile market and less pronounced in a stable market. The Lower Band suggests that an asset is undervalued or oversold when an asset’s price comes close to or reaches the Lower Band. This scenario presents a favorable buying opportunity as the price of the asset is likely lower than its average price. Typically, oversold conditions tend to entice buyers who are waiting to enter the market at a cheaper price level with the expectation that the price will bounce back.
In technical analysis, the Lower Band can also be regarded as a support level for prices, indicating that it may become hard for prices to fall much lower than this level. In such cases when prices are at or somewhat lower than the Lower Band, it is common to view this as a signal that the selling pressure may be forming a peak or that a roll over or a bounce may not be too far away. But, like the Upper Band, the Lower Band cannot be relied upon alone to indicate that a price rise should be expected immediately since prices may still decline under strongly bearish conditions. There are instances when traders believe that the Lower Band can be used with other measures to establish whether the price of the asset under the band is truly cheap or further declines are forthcoming before attempting to recover.
The analysis of the Lower Band also assists the traders to interpret market psychology especially so when the overall market is bearish. Is there such a thing as ‘too much selling’. Quite the opposite is true, that things have gone so far that there are significant buyers for significant prices. If prices persist in staying around the Lower Band or even below for a considerable time frame then one can surely conclude that there is active selling and bearishness. But if prices rise quickly after touching the Lower Band then that is bad news for the bears as they have less and less selling pressure and a trend reversal might be in the making. The Lower Band thus enhances the trader’s ability to determine the times when an asset’s price is considered low in relation to its price history in recent times and therefore facilitates timing decisions about entering long positions, covering short positions or awaiting further confirmation. When trades are tracking the Lower Band it allows them to see when the asset might be relatively over sold and therefore make better timing decisions about when to buy and sell.
HOW DOES EACH COMPONENT CONTRIBUTE TO UNDERSTANDING MARKET VOLATILITY AND MAKING TRADING DECISIONS?
- SIMPLE MOVING AVERAGE (SMA)
The Simple Moving Average, or SMA, also helps in fathoming the recurrent trends of the market and is considered the main focal point of the Bollinger Bands .The SMA is determined by averaging the cost of an asset over a selected number of days, usually twenty. This means that the price trend shown by the SMA covers a large number of fluctuations that typically occur in short up or down movements. This smoothing effect is especially useful in highly volatile markets where many traders need to tell the difference between short-term price fluctuations and price trends. The stability offered by the Moving Average allows the trader to see how the present price movements are with respect to the moving average over time. Lakatsous (2002) reports that the rule of thumb is that the greater the distance between the present price and the effective average moving price, the weaker the long-term probability and vice- versa. For example, when present values remain average, it usually means low volatility. Prices are stable and do not vary widely. When prices reach the opposite extreme, that is when they notice interesting extremes, it could indicate low average price levels accompanied by high activity.
For Bollinger Bands, the SMA is very important in determining the current direction and the strength of the trend. Because the SMA is placed in the center, it makes Boslinger’s Bands such that the traders assess how much the prices depart from their recent mean. When prices rises above the SMA persistently, it suggests an uptrend, and thus a time of buying pressure, prompting the traders to go long. Conversely, when the prices are depressed below this average for a long time, it implies downtrend and hence potential pressure in selling opportunities. This manner, the SMA plays an important role of helping the traders always move with the current trend while at the same time, warning them of possible reversals in the trend as prices begin to cut across the SMA in a contrary direction.
More than just spotting trends, the SMA’s function within the Bollinger Bands provides assistance to the traders on the risks and timing of their trades. If the prices are narrow around the SMA, it indicates that the market is neutral since there are neither buyers nor sellers who are really active. This would be a neutral stage of trading, and traders might refrain from making drastic changes. However, once the price starts moving away from the SMA, the volatility in the market increases and either profits or losses become more probable. These restrictions enable the traders to know the right time to make their trades while the SMA provides a good measure for determining when the price of an asset is normal or abnormal. In choppy markets, the SMA is used to identify more permanent price shifts from fleeting price movements that are important to making sound trading choices.
- UPPER BAND
The Upper Band in Bollinger Bands represents that price area up to which a term can normally be broadened, the price area which is two standard deviations procured above the moving average line. There is a direct relation between the Upper Band and the volatility level: the more the oscillations of price intensity, the wider the Upper Band, and the narrower the Upper Band in a more tranquil period. This variability helps in understanding the strength of price movements in the market while being in an overbought condition. In such cases when the price is hovering or has gone above the upper Band, it indicates abundance of buying on that asset and therefore the price is due for a pull back or a correction. Consequently, the Upper Band depicts the degree of fluctuations and provides traders with the timing opportunity to exit if the asset price is high more than its worth or adjust their stop loss order.
When prices approach the upper boundary, many traders believe that prices are unlikely to go much further, which is why the Upper Band can be considered a form of dynamic resistance. On the other hand, that only happens infrequently and for short time periods when prices are above the Upper Band, which means there is an extreme buyer's market. However, following the release of buying pressure, it is typical for prices to return to around the SMA, making that range above the Upper Band short term. This sort of price depreciation around the upper band is seen as a way to validate how sustainable a bullish position is; where the upper band can be viewed as a marker of high prices that should be crossed rather than one which will be tested if the pair is stabilized. However, if the price returns quickly after touching the Upper Band, then it may mean that there are no buyers left and a change in trend direction is imminent. The Upper Band decreases because the upper band’s price moves perfect and maintains its structural integrity.
The Upper Band is of use even when devising long-term strategies since it could also be used to gauge when price tops may be reached together with the extent of movement within a bullish trend. When price activity disturbingly often registers in proximity to the Upper Band, it could represent a heated market and suggest a more conservative activity on the part of traders. On the other hand, continuously elevated prices at the Upper Band can be indicating strong activity from the market bulls which can be seen as a positive but could also be a precursor to a violent reversal. Traders who see prices hanging around the Upper Band may adopt a wait and see policy, staying out of new buy positions until the market gives evidence of being more stable. In such a way, the Upper Band serves the purpose of informing market participants of the presence of risk not only in their short-term, but also their long-term trading strategies.
- LOWER BAND
Considering that the Lower Band is the value which is two standard deviations away from the SMA but located at the downside, the band is also important for market volatility analysis as it aids in the identification of potential overselling. The Lower Band is also like the Upper Band in the sense that it is fluctuating based on the volatility, meaning it will also widen or narrow according to price changes. If the prices are close or touch the Lower Band then there is likely high selling pressure at that particular time and the currency may be selling at lower levels compared to the average line. This scenario may provide trading opportunities for traders anticipating a price recovery. In this light, the Lower Band serves as a guideline towards when assets may be marked as cheap, thus assisting the traders in establishing whether the market is overly pessimistic and an upward reversal may occur.
In the case of traders, the Lower Band can be regarded as an elastic support level in which oversold prices are expected to either maintain or bounce back from. If the prices are lower than the Lower Band, such extreme selling pressure might be described as reaching an even more cracking point. Most of the time, traders use this an opportunity to make the necessary purchases so long as there are other signs which seek to show that this particular asset has indeed been over purchased. But the Lower Band provides no ceiling where a reversal will occur as prices often remain as lower than this level in bad bearish conditions. To mitigate this risk trade routinely combine the Lower Band with other indicators so as to validate oversold conditions. If the price is at the or Lower Band The price falls or touches the bounce back this provides the good leeway for individuals’ buying pressure and this also verifies that selling pressure has become less.
In times of increased volatility, the Lower Band is very useful since it provides some indication that the sales pressure is likely to be highest at that point in time and traders can make trades appropriate for the level of risk and the expected reward. As they learn the workings of the Lower Band in relation to the price movements, they become more trustworthy of the current price level in question as to whether it is just a short-term bottom or a long-term bottom. For instance, in cases where price stays below or close to the Lower Band, one can infer that there will be sell off for quite some time, meaning that such investors should be careful. On the contrary, investors may view this as a temporary oversold condition which provides a buying opportunity when price only just touches the Lower Band and rebounds up toward the SMA. The wider picture of the market presented to them in terms of the Lower Band enables them appreciate the identifiable lower price of the asset and hence enable them decide better when to enter long positions.
Question 2: Analyzing Market Conditions with Bollinger Bands
And inorder to provide my answers to this question, I'd first of all apply the Bollinger bands to the price charts and this can be seen below.
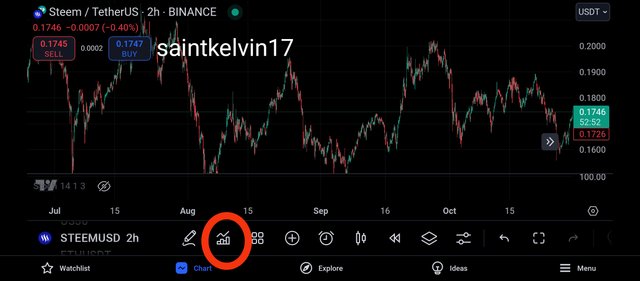
To apply the Bollinger band indicator, I visited the trading view app on my device and I searched for the pair STEEMUSDT and the above screenshot appears.
And then I clicked on the icon that is for the application of indicators just as seen above, and the below screenshot appeared.
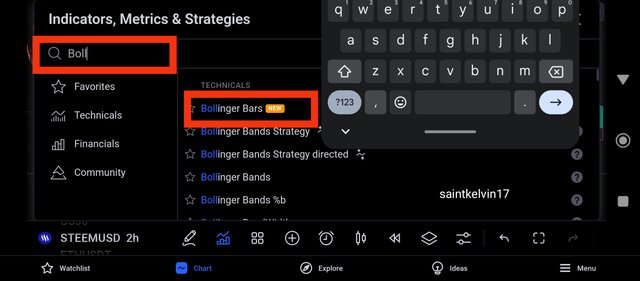
Then I moved to the search botton to search on the specific indicator that I intend to apply to the price chart, and as we all know, there are varieties of indicators that can be used for market analysis.
We have the relative strength index, we have the ichimoku cloud indicator, we have the moving averages and many more.
Then I decided to search for the Bollinger band indicator just as seen above and there are different kinds of Bollinger indicator and I clicked on the exact one I intend to add to the price chart.
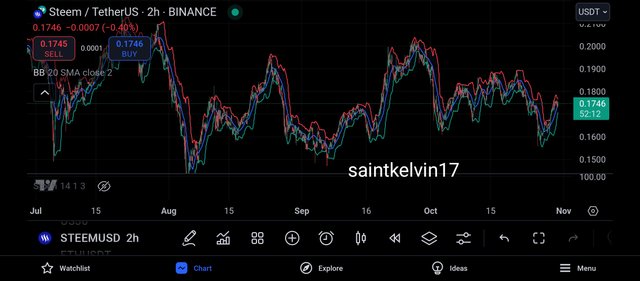
And then the Bollinger band indicator was added to the price chart just as seen above.
And from the above screenshot, we can see that the Bollinger band consist of 3 different parts as this have been discussed earlier.
We have the simple moving average, the lower band and the upper band and to properly identify this, I decided to move to the settings of this indicator.
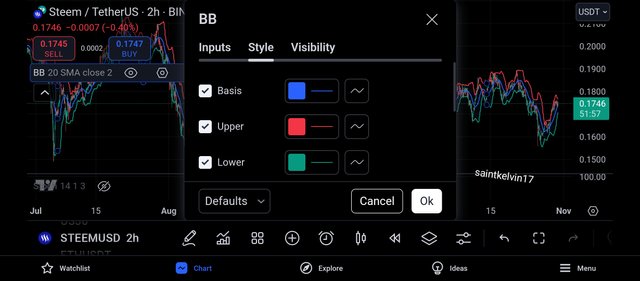
And as seen above, we have 3 different colours which indicates the 3 parts of the Bollinger band indicator.
The blue band which is labelled as the basis can also be known to be the moving average indicator, and it is very important in identifying trend direction of the market.
The band with the red colour is the upper band and the upper band is also very useful in market analysis as it plays it role in the identification of potential levels in the market.
And the third band is the one with the green colour and it is known to be the lower band, and this band is also useful in identifying important levels in the market.
UNDERSTANDING OVERBOUGHT, OVERSOLD AND NEUTRAL STATES
- OVERBOUGHT:
To understand if the market is in an overbought state, we first of all have to understand the concept of overbought and oversold regions.
The crypto market consists of buyers and sellers, and for the market to be balanced, both buyers and sellers have a very important role to play.
When the buyers have excercise more than enough dominance in the market then the market can be said to be overbought, and for it to be balanced, the sellers are expected to come in, and take profits which will return in the formation of bearish candles in the market.
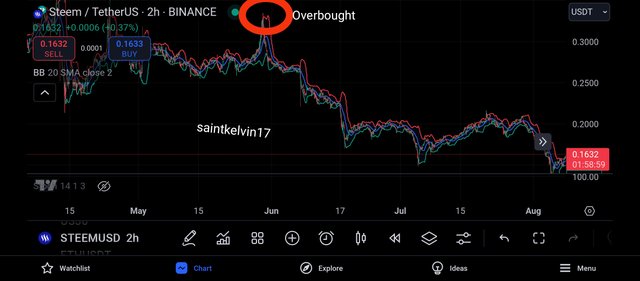
And moving to the steem price chart, I was able to identify an overbought market, I specifically identified the overbought region of the market using the Bollinger band.
From the above screenshot, we can see that the buyers have been driving the price upwards until they became weak and are unable to push the market upwards any further, in this situation, the market can be said to be overbought.
And in this scenario, we can expect to see the sellers take control of the market, just as shown above.
- OVERSOLD:
The oversold market condition operate under the same phenomenal as the overbought market in the sense that when the sellers have excercise more than enough dominance in the market then the market can be said to be oversold, and for it to be balanced, the buyers are expected to come in, and buy the market at low prices and this will push the market upwards.
The oversold and overbought market operates based on the phenomenal of supply and demand, the buyers buy at a low price and sell at a higher price which makes them profitable overtime.
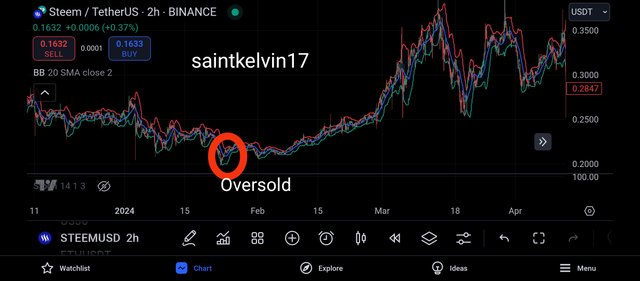
And to identify the oversold region in the market, I moved to the pair STEEMUSDT, and I noticed that the market has previously been forming lower lows and lower highs.
And I also noticed that the sellers have become weak and can no longer drive the market downwards, and it has become time for the buyers to buy again at a discount price.
HOW BOLLINGER BANDS CAN SIGNAL POTENTIAL BUYING OR SELLING OPPORTUNITIES
The Bollinger band indicator plays a very important role in identifying potential buying and selling opportunities.
When the market is in an oversold state, that is a market condition where the sellers have become weak, then a potential buying opportunity can be spotted.
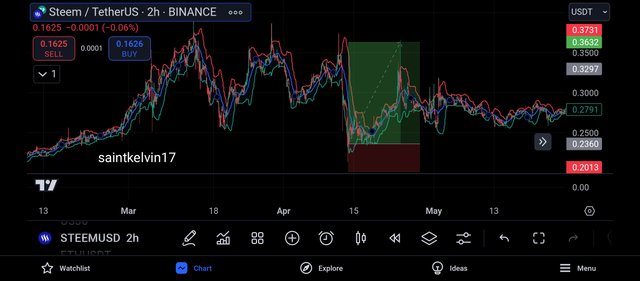
Like I earlier said, the lower and upper band are very important in identifying buying and selling opportunities.
And to identify my buying opportunity, I waited until the market touch the lower band, and in this situation, the lower band can be said to be functioning as a strong support level to the market price.
And also, we would notice that this level is an oversold level and we can only expect to see the buyers take control.
It is with this confluence that I identified my buying opportunity.
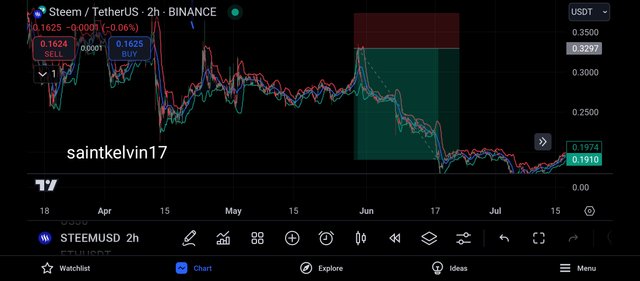
And to identify my selling opportunity, I waited until the market touch the upper band, and in this situation, the upper band can be said to be functioning as a strong resistance level to the market price.
And also, we would notice that this level is an overbought level and we can only expect to see the sellers take control afterwards
It is with this confluence that I identified my selling opportunity in the market.
QUESTION 3: IDENTIFYING VOLATILITY PATTERNS WITH BOLLINGER BANDS
It is for this reason that Bollinger Bands are so widely utilized as part of the technical analysis they are an effective and graphical way to measure market volatility, or how much the price of a particular asset varies over a given timeframe.
The bands are formed with the help of a 20-day Simple Moving Average (SMA) line placed at the center and two other lines forming the upper and the lower bands at two standard deviations above and below the line. And these bands do not stay static – they are determined by how much standard deviation there is in the movements.
Qualified as a statistical measure of dispersion, wider deviations have wider bands, thus indicating more volatility and the narrower indicating the less. This adaptability makes it easy for investors to quickly determine the level of price fluctuation around the mean when interpreting the Bollinger Bands and depicts the inherent strength of the market conditions.
Increased market volatility will result in an increase in unpredictable price movements, which widens the Bollinger Bands. In this scenario, the upper and lower bands will also move far apart from the SMA in order to allow for larger price movements.
An increase in the Bollinger Bands can signify rise in uncertainty or volume, usually caused by earnings reports, breaking news or major moves in the market. Such an expansion of the bands is also useful for traders as it acts as a warning for periods of sharp price movements.
A high volatility period could mean that a new trend is likely to start or that the current trend is reaching a climax. As a result, active traders are prepared for future changes by either adhering to stricter stop loss limits or waiting for clear reversals.
On the other hand, a decrease in volatility leads to the contraction of Bollinger Bands whereby the upper and the lower bands are brought closer to the SMA. This contraction is referred to as a squeeze and is usually associated with periods of little market activity or consolidation where the price moves within tighter bands. In technical analysis, squeezes are important because they are often the precursors of sharp price shifts or breakouts in trend.
A squeeze compresses the bands so traders know that price is within a narrow range but quite possibly there is a high likelihood of expansion in either direction. Many traders might utilize the squeeze as a warning shot, anticipating a break by looking through volume, momentum, or any indicators. Therefore, Bollinger Bands enable traders to be in sync with the changing level of volatility enabling them to predict and act according to the market situations accurately.
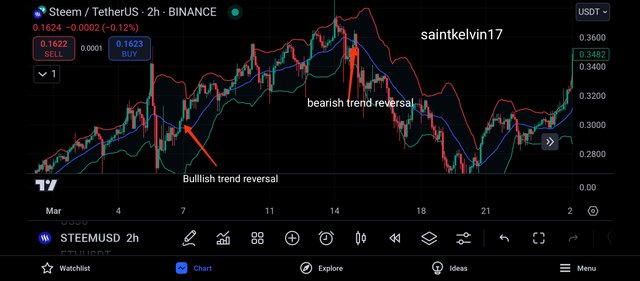
The screenshot above is of the pair STEEMUSDT on the 2hr timeframe, and shown above is an example of expansion of the Bollinger band.
The phenomenon behind the expansion of the Bollinger band is that the upper band and the lower band moves away from the the moving average which is the basis.
And when this happens, it gives a warning to traders, that they should be in expectation of a rapid price movements.
The expansion of the Bollinger band signals an increased volatility and as shown above, we can see that whenever there is an expansion, the market is often accompanied by an impulsive move, either a bearish move or bullish move.
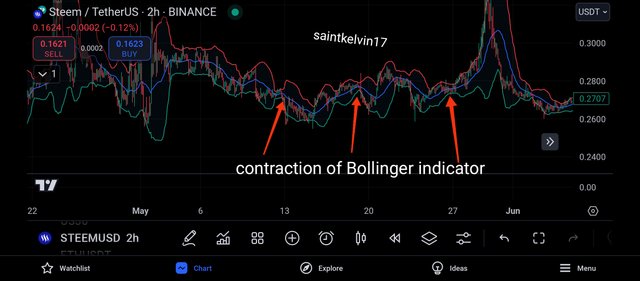
And the screenshot above shows the contractions of the Bollinger band as the upper band and lower band have moved closer to the simple moving average, or the basis.
And as earlier explained, the contraction of the Bollinger band indicates a low volatility in the market, that is a slowness in the market, where both buyers and sellers are weak in the market.
From the above screenshot, we can see that there are no impulsive movements in the market whenever there's a contraction of the Bollinger band.
QUESTION 4: DEVELOPING A TRADING STRATEGY WITH BOLLINGER BANDS
Developing a trading strategy with the Bollinger band is quite easy, as they are most likely respected by the market.
- TREND IDENTIFICATION:
To develop my trading strategy, the first thing I'll consider is the identification of market trend, as I won't be looking for a buy opportunities in a bearish trend unless the market has traded towards its oversold region.
For the identification of the market trend, I will be making use of the simple moving average of the Bollinger band, and whenever the SMA crosses below the price chart, the market can be said to be bullish, and when the SMA crosses above the price chart, the market can be said to be bearish.
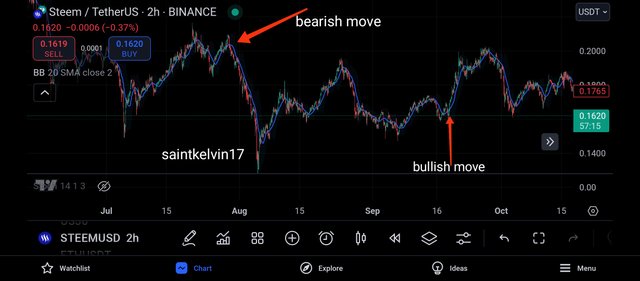
From the above screenshot, I removed the upper and lower band of the Bollinger band indicator, which leaves me with the SMA indicator.
And from the above screenshot, I was able to identify a bearish and bullish entry criteria.
When the SMA crosses below the price chart, I understand it to means a bullish market move and when the SMA crosses above the price chart, I understand it to be a bearish trend move.
- TOUCH POINT OF THE UPPER AND LOWER BAND:
Another thing I will take into consideration is the touch points of the upper and lower band of the Bollinger band indicator.
The upper band will function as my resistance level to the market price and the lower band will function as my support level.
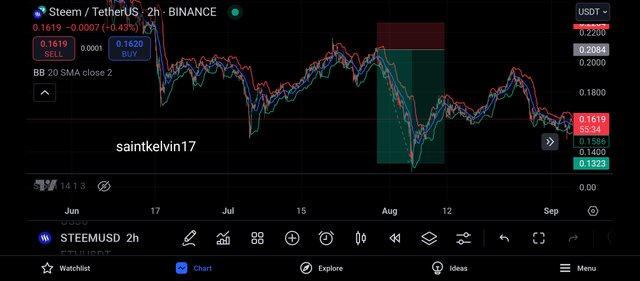
From the principle of support and resistance strategy, whenever the market touches its resistance line, we expect the bears to take over the market and this is very much applicable in this scenario.
Whenever the market makes a touch on its upper band, we can expect it to be accompanied by several bearish candles.
From the above screenshot, I ensured that the SMA has crossed above its price chart which signals a bearish move, plus the market has touched the upper band of the Bollinger band.
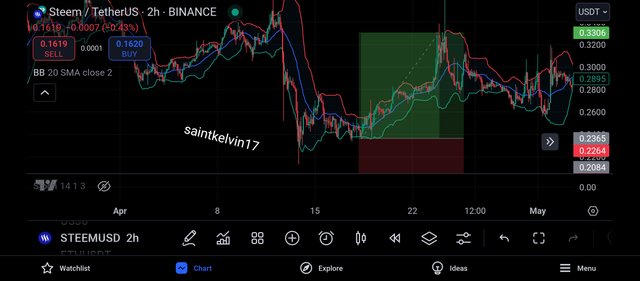
A similar scenario is applied to the lower band of the Bollinger band indicator.
Using the principle of support and resistance strategy, whenever the market touches its support line, we expect the buyers to take over the market and this is very much applicable in this scenario.
Whenever the market makes a touch on its lower band, we can expect it to be accompanied by several bullish candles.
From the above screenshot, I ensured that the SMA has crossed below its price chart which signals a bullish move, plus the market has touched the lower band of the Bollinger band.
- ENTRY CRITERIA:
My entry criteria using the Bollinger band is very simple and straightforward, first of all I seek to identify the prevailing trend of the market using the SMA indicator.
And when this is done, I search for confluence using the upper band and lower band of the indicator, which is also similar to me finding it's overbought and oversold regions and trading from it.
- RISK MANAGEMENT:
A good trader is most often known for how well his risks is being managed, and to manage my risk, I will only risk 25% of my trading capital.
This implies that if I trade an account with a value of $1000, at every trade I take, I will only risk $250 which means I will have to encounter a 4x loosing streak before my account will be blown.
- TAKE PROFIT AND STOP LOSS:
The take profit of my trades will always be set in a way that I have a risk to reward ratio of 1:3, that is, if I am risking $250 per trade, I expect to have a reward of $750.
And my stop loss will be set in a way that if the market goes 15pips against me, I'll be kicked out of the market.
QUESTION 5: PREDICTING PRICE MOVEMENTS WITH BOLLINGER BANDS
In this section, I will be showing my analysis on the prediction of steem price using the Bollinger band.
The first thing I decided to do was to identify the trend of the market and I did this by going to my trading view and clicking on STEEMUSDT.
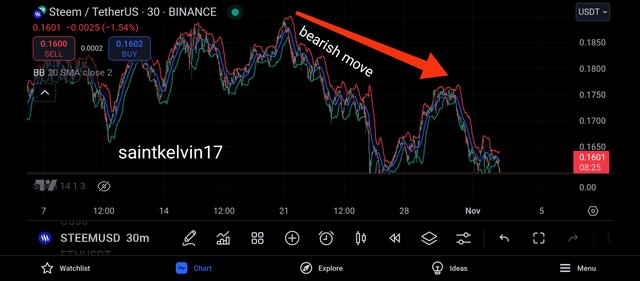
From the above screenshot, we can see that the sellers are currently in control of the market, and we can see the market forming new lows and confirms that it is in a bearish phase.
And also looking the the Bollinger band, we would realise that the SMA of the bollinger band has crossed above the price chart and this is a clear indication of a bearish move in the market.
And we would also noticed that the market is reacting from the rejection it had touching the upper band of the Bollinger band, and we noticed that a rejection from the upper band of the bollinger band is a bearish move in the market.
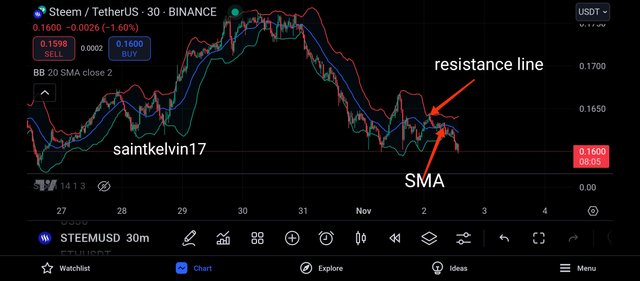
The above screenshot is also of the pair STEEMUSDT on the 30m timeframe, and the chart above is showing the upperband functioning as a resistance line to the price chart.
We can also see the SMA trading above the market price which is a clear indication that the market is continuing on its bearish move for a while.
Then I realised that the market is probably retracing to retest test a unique support level, which is shown in the chart below.
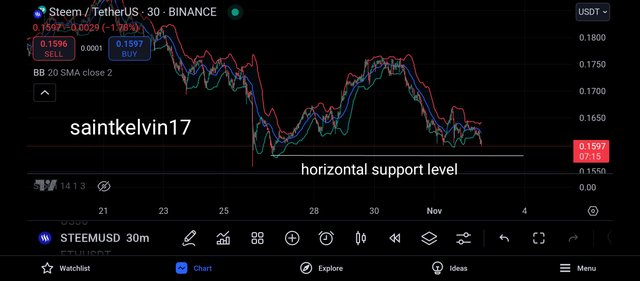
From the chart above, we can see that the market has a targeted level it is trading towards, the market is trading towards an horizontal support level just as seen above.
And using the phenomenal of support and resistance, we expect to see a sharp rejection on the price when it touches this horizontal support level, and then we can expect to see the buyers take control of the market.
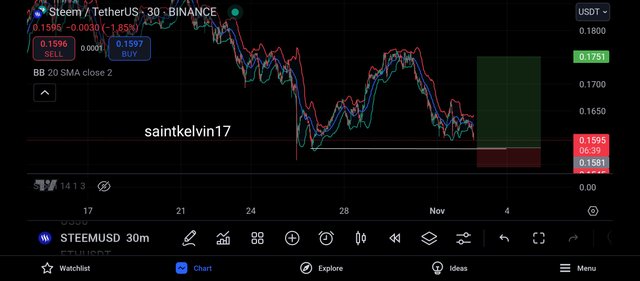
And with this, I expect to see a bullish rejection of the market, and before entering the trade, I intend to search for trading confluence using the lower band of the bollinger band.
CONCLUSION
Learning about the bollinger band indicator has been fun all the way, this is a very interesting and effective trading strategy that is most often times respected by the market.
And in my upcoming trades, I will ensure to search for trading confluence using the bollinger band indicator.
Twitter share
https://twitter.com/Saintkelvin18/status/1852754435908276285?t=5v-nvGFp-tWxLHuAbzxJIg&s=19
Downvoting a post can decrease pending rewards and make it less visible. Common reasons:
Submit