Good day crypto enthusiasts. We had an educative lecture from professor @utsavsaxena11 and it is all about trading with the ultimate oscilator. He explained the topic with a simple presentation. I have participated in this lecture and this is my homework presentation as assigned by the professor.

Image created with Splendid Logo Designer

Question 1:What do you understand by ultimate oscillator indicator. How to calculate ultimate oscillator value for a particular candle or time frame. Give real example using chart pattern, show complete calculation with accurate result.

The ultimate oscilator is one of the technical indicators being used by traders in different kinds of asset markets, like forex, cryptocurrencies, stock trading, and the likes. It was created in the 1970s by an American trader, called Larry Williams. The indicator is a momentum indicator as it utilizes the momentum of different timeframes to signal traders about the possible movement of the price.
The Ultimate oscillator works in a similar way as the RSI and the stochastic indicators, with the main difference being that, it works on three time frames, in contrast to the RSI and the stochastic indicator, which work on one and two timeframes, respectively. The three different time frames being used in the ultimate indicator add additional functionality as it combines analysis of both long term and short term price changes into one, so that the price fluctuations in the short time period will have an insignificant influence on the outcome.
With this indicator, the market diverges in both strong and weak markets, depending on the state of the divergence. The divergence could be bullish or bearish and it signals traders to enter or exit their positions. The time frames being used in the Ultimate oscillator are the 7,14, and 28 timeframes. It takes their weighted averages to measure the accumalation and distribution in the market.
In general, the signals of the Ultimate Oscilator include:
Overbougt and OverSold areas
Price Action confirmation
Buy and sell Spots
Future price reversal
Calculation of the Ultimate Oscilator
As I indicated earlier, three time periods are used to calculate the value. The 7, 14, and 28 time periods are the standard time periods for calculating the Altimate oscillator. First of all, we have to find the Buying Pressure by using the High, Low and closing prices of periods 1 to 28 to determine the amount of buying for the day, which gives the price action.
After we find the selling pressure, the next step is to find the True Range which gives us the activity for the period, thus the measure of gain or loss. With the selling pressure and the true range, we can use it to find the weighed average of the 7, 14, and 28 timeframes and use it to calculate the Ultimate Oscillator.
Parameters for Calculating the Ultimate Oscilator
Let
BP =Buying Pressure
TR =True Range
AVG7 = Weighted Average of 7 timeframe
AVE14= Weighted average of 14 timeframe
AVG28=Weighted Average of 28 timeframe
UO = Ultimate Oscilator value
BP=Close−minimum( current Low, previous Close)
TR = Maximum(current High or previous Close) - Minimum(current ,Low or previous Close)
AVG7= (Acculation of BP up to period 7)/(Accumulation of TR up to period 7)
AVG14 = (Acculation of BP up to period 14)/(Accumulation of TR up to period 14)
AVG28= (Acculation of BP up to period 7)/(Accumulation of TR up to period 28)
UO = 100 x [ (AVG7 x 4) + (AVG14 x 2) + (AVG28) ] / 7)
Illustrative Example
With the help of MS Excel, I used the Avax/USDT (1-day) chart to calculate the Ultimate Oscilator. I used the daily low, high, and close from day 1 to Day 28 with the help of the price history of Avax/USDT from Yahoo Finance. The screenshots below show the daily price history of the Avax coin from day 1 to day 28. [Dec-09-2021 to Jan-05-2022].
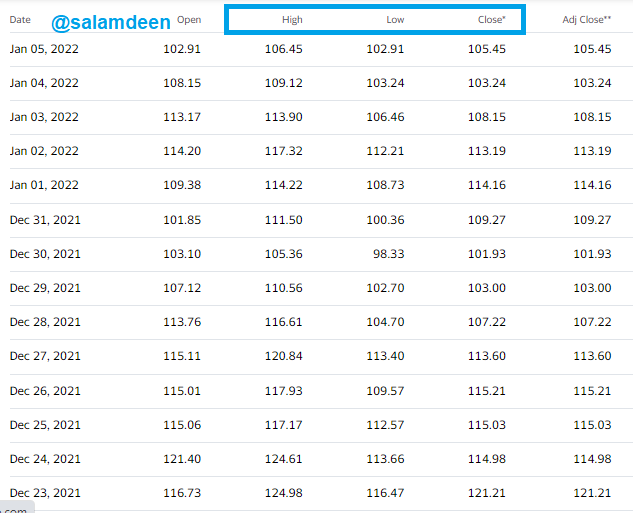
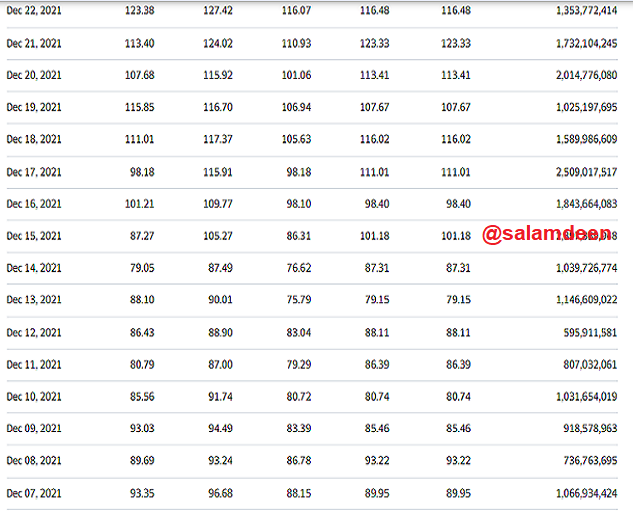
Price History of Avax/USD from December 7th to 5th January Screenshot From
As seen in the price history above, it is the price history from [Dec-07-2021 to Jan-05-2022]. I used it to calculate the value by representing it in an MS Excel spread sheet. The screenshot below is the calculation of the Ultimate Oscilator in Excel.
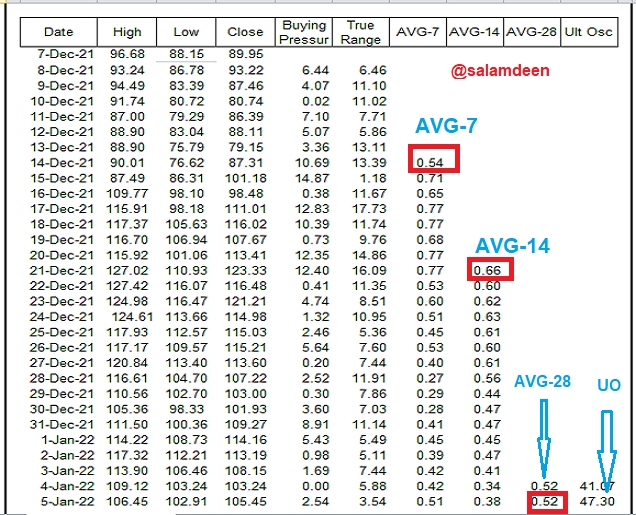
MS Excel Spreadshit for Calculation of the Ultimate Oscilator Value
From the Spreadshit,
AVG7 = 0.54
AVG14 = 0.66
AVG28 =0.52
UO= 100 X [(0.54 X 4) + (0.66 X 2 )/7]
Therefore, the Ultimate Oscilator value for the 28 days is 47.30
As seen in the Avax USDT (1day) chart below the value 47.8
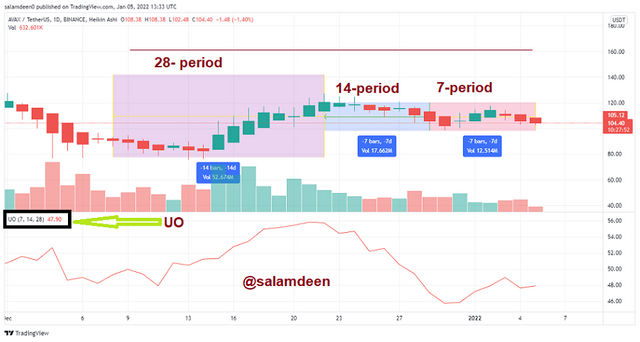
DOT/USDT chart from

How to identify trends in the market using ultimate oscillator. What is the difference between ultimate oscillator and slow stochastic oscillator.

The ultimate oscillator uses the relationship between the buying pressure and the true range to give signals about the market trend. The oscillator rises and falls with respect to the buying pressure; it rises as the buying pressure rises and vice versa. We can use this idiology to spot trends in the market through the overbought and overold areas. We set the oversold area to 30 or below and the overbought to 70 or above. With the Ultimate Oscilator (7,14,28), we are able to identify trends for long time frames. We can also decrease the timeframes to increase the sensitivity of the oscilator.
Identifying Bearish Trend
As I indicated early on, we can simply use the oversold and overbought areas to identify trends in the market. We set the overbought and oversold areas and then compare the price chart with the oscillator. As the buying pressure increases, the oscillator diverges upwards. This means that traders are buying more of the asset. When the oscilator crosses the 70 zone, it indicates that the asset is overbought. Hence, sellers will take over the market, which is a signal of a downtrend. Traders or investors can then use the divergence of the oscillator to determine their positions. In summary, a bearish trend mostly comes after the oscillator moves to the overbought area. An example is shown in the DOT/USDT (45min) chart below.
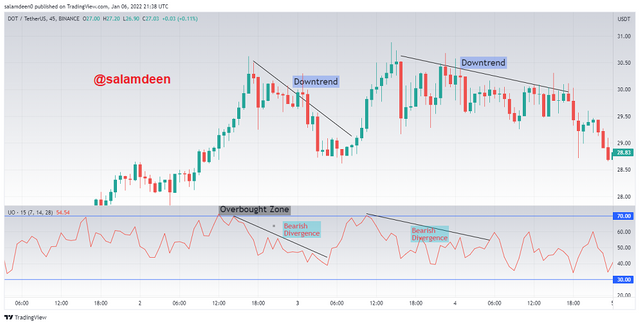
DOT/USDT chart from
From the chart, you can see that I have indicated two points where the oscillator crossed the overbought zone and were preceded by a down trend. In the first indication, the price crossed the overbought on January 2nd. This caused a downtrend until January 3rd, when a small buying pressure pushed the price back to the overbought zone. It was also followed by a downtrend, which we are still experiencing now.
Identifying Bullish Trend
This is directly opposite to identifying a bearish trend. With the Ultimate oscilator, a bullish trend usually comes after the period where the oscilator crosses the oversold area. The psychology behind this is that, the oscillator falls when the buying pressure falls as sellers have taken over the market. When the oversold area is crossed, it means that, the sellers have exhausted their quota and buyers could take over at any moment. This signals traders a possible uptrend as people start buying with higher volume, which increases the buying pressure. The price will increase, forming an uptrend as the buying pressure rises. Consider the chart below.
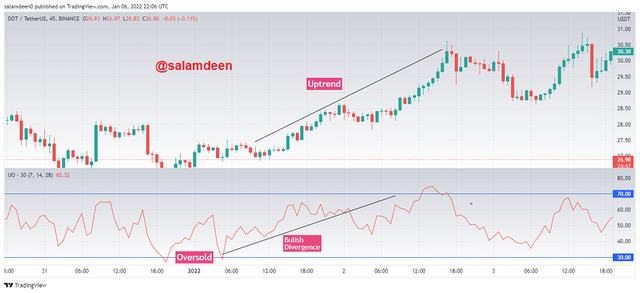
DOT/USDT chart from
As seen in the chart above, the Ultimate Oscilator hit the oversold area at 9AM on January 1st, and the price showed a bullish uptrend.
Difference between the Ultimate Oscilator and the Stoschastic Oscilator.
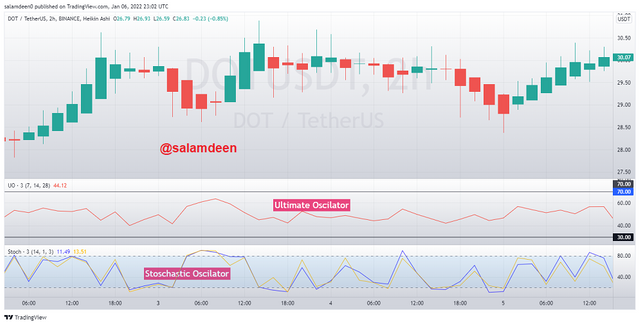
DOT/USDT chart from with Ultimate Oscilator and Stoschastic Oscilator
Both the Ultimate and Stoschastic Oscilators work similarly as they are all momentum indicators. This means they use the momentum of the buying and selling of the asset to signal the possible price movements. However, the Ultimate oscillator differs from the Stoschastic Oscilator in so many ways due to additional parameters being added in the Ultimate Oscilator to maximize profitability in both longer and shorter time frames. I have highlighted some of the differences between the two oscillators in the table below:
| Ultimate Oscilator | Stoschastic Oscilator |
|---|---|
| The primary difference of the Ultimate OScilator with the Stoschastic Oscilator is the time periods being used. In the UO, three timeframes are being used. | The Stoschastic Oscilator uses only a two time frames. |
| As seen in the chart above, the Ultimate Oscilator does not include any signal line | The Stoschastic Oscilator, on the other hand, does have signal line. |
| Can give different buy/sell signals with the same data | Gives only one buy/sell order |
| There is additional three step method for trading with the divergence Ultimate Oscilator | No additional method employed |
| The defualt timeframes used are the 7,14 and 28 timeframes. | The default timeframe used are 3 and 14 timeframes. |

How to identify divergence in the market using the ultimate oscillator, if we are unable to identify divergence easily than which indicator will help us to identify divergence in the market.

Similar to other momentum oscillators, traders use the divergence of the Ultimate Oscilator to determine if there is a possible downtrend or an uptrend. The divergence is the direction of the general price trend with respect to the oscillator. The direction of the divergence could be a bullish or bearish one. I have stated how to identify both the bearish and bullish divergence below.
Identifying Bullish Divergence
For a bullish divergence to form, the price has to form a lower low while the oscillator is forming a higher low. In order to form an operable bullish divergence, the first low of the bullish divergence must be below 30, as an indication that, the asset is oversold. We begin to observe the chart closely to set a buy order when the oscilator breaks the previous high of the bullish divergence upwards. However, prior to the buy order, we have to confirm the price movement and if it is forming a lower low whilst the oscilator is forming a higher low, we can set our buy order after a breakout of the oscilator from the previous high.
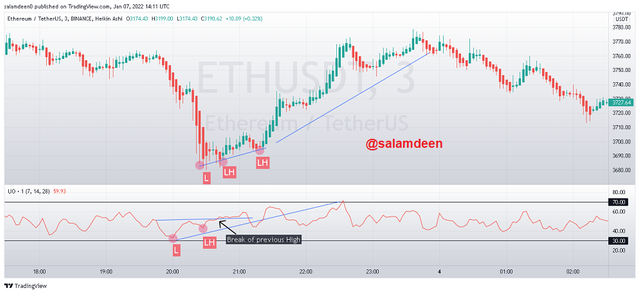
ETH/USDT 3mins chart with the Ultimate Oscilator from
Identifying Bearish Divergence
In contrast to the bullish divergence, the bearish divergence is observed when the price is forming a higher high and the oscillator is forming a lower high. The first high of the bearish divergence should cross 70 as an indication that, the asset is overbought. We can then observe the price and if it is forming a higher high, we can observe the oscilator closely to place a sell trade when the low during the divergence is broken.
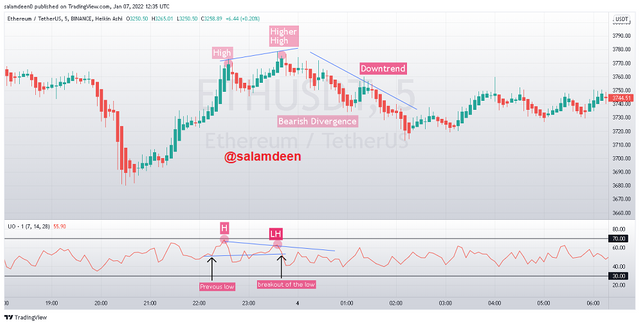
ETH/USDT 5mins chart with the Ultimate Oscilator from
Using the Stochastic Oscilator to help identify divergence
It is a fact that, all the technical indicators have their strengths and drawbacks. That is why it is advisable to implement other indicators to help give valid signals to traders. As the Ultimate oscilator is made up of multiple time periods, it is usable in both long-term and short term analysis, but it is good practice to add another oscilator/momentum indicator for intraday or short-term trades as the Ultimate indicator favours long term and mid-term traders rather than shorter-term trades. Even in identifying trends in the longer time frames, we can still use the Stoschastic oscilator to help us spot the overbought and oversold areas easily as it is more reactive than the Ultimate oscillator.

DOT/USDT chart from with Ultimate and Stoschastic Oscilators
In the chart example below, I have included both the Ultimate and Stoschastic Oscilators. The ultimate oscilator uses the 7, 14, and 28 time periods and the stoichastic uses 3 and 14 time periods. Hence, the stoichastic will be more reactive to price actions than the UO and it can be seen that the stoichastic oscilator has cross the oversold and overbought areas on so many occasions. We can use this along with the Ultimate oscilator during periods when we find it difficult to spot oversold and overbought areas with the UO.

what is the 3 step- approach method through which one can take entry and exit from the market. Show real example of entry and exit from the market.

Traders use a three step approach in order to set entry and exit positions as implemented by the creator of the Ultimate Oscilator. When these criterions are followed well, there is higher chance of profitability with the ultimate indicator. Lets discuss the approach in the next paragraphs.
A buy trade with the the 3 step approach
✔✔✔ Step 1: Check for a Bullish Divergence: We have to first of all check for the formation of a bullish divergence between the oscilator and the asset price. Thus, when the osilator forms a higher low and the price comes from a lower low. As seen in the buy trade below, the price chart formed a lower low whilst the osilator formed a lower high.
✔✔✔ Step 2: Check to see if the if the low formed by the oscilator move below 30 This is to prove that the asset is oversold . From the trade setup below, the low was at 29.5, as I found it a bit difficult to spot a low below 30.
✔✔✔Step 3. This is the final step where we have to check to see if the oscillator move breaks the previous high. If the privious high is broken, we can create a position by setting the entry and exit levels. I have placed a trade setup with a risk reward ratio of 1:2.
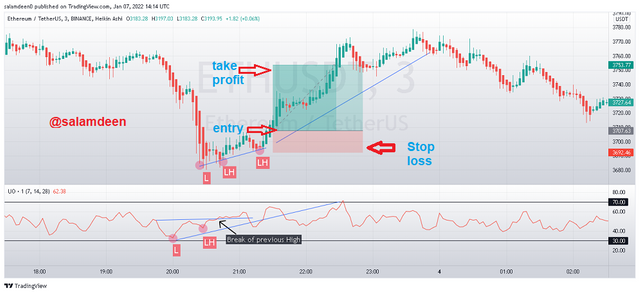
a buy trade setup with ETH/USDT chart from
A sell trade with the 3 step approah
✔✔✔ Step 1: Check for a Bearish Divergence: This is the first step where we have to check if the divergence of the oscilator has formed a lower high and that of the price has formed a higher high. As seen in the trade setup below, the price chart formed a higher high whilst the osilator formed a lower high.
✔✔✔ Step 2: Check to see if the high formed by the osilator move above 70. This is done to ensure that, the asset is really overbought. From the trade set up above, the osilator crossed the overbought zone.
✔✔✔ Step 3: This is the final step. This is where we check to see if the low formed is below the previous low of the divergence. The trade setup below, is a short position placed on the ETH/USDT 5 minute chart.
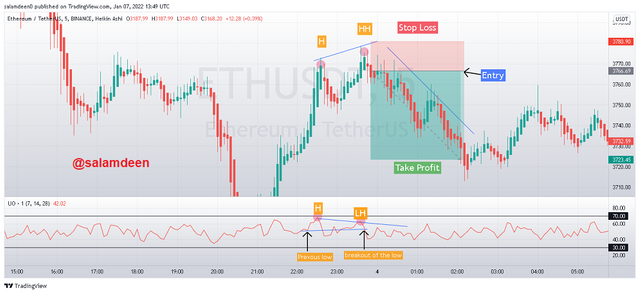
a sell trade setup with the ETH/USDT chart from

What is your opinion about the ultimate oscillator indicator. Which time frame will you prefer how to use ultimate oscillator and why?

From my perspective, while the ultimate oscilator is useful for both long-term and short-term trading, it is more useful in setting up long-term trades because it can easily miss out on short-term trades, which is the ultimate oscilator's main disadvantage.
The use of multiple timeframes has added more functionalities to the ultimate oscilator, which makes it a good choice for traders. Traders can even set the time frame to their preferable values to suit their trades.
The default timeframes are the 7, 14, and 28 time periods, and I would prefer to use them for my trades because these timeframes are enough for a valid trade. It is a fact that all the indicators have their strengths and weaknesses, so it is always good to use other indicators alongside the ultimate indicator as a backup for stronger signals.

Conclusion

The ultimate indicator is a very good indicator for different signals. As I indicated earlier, the indicator is not 100% dependable, but we can use it in our trades for strong signals. There are many other indicators that we can use with the Ultimate indicator, including the other mommentum oscilators like the RSI and the Stochastic oscilator. We can also use it as a trend confirmation for our long term position trades.
I want to thank professor @utsavsaxena11, for this lecture, I have really learnt alot in comming out with my presentation. I hope to learn more from you.
Thanks for your time