

QUESTION:1
Give a detailed analysis of BICHI STRATEGY. Starting from introduction, identification of trends, trend reversal in market, entry and exit from the market, one demo trade and finally your opinion about this strategy. (Screenshot required)

Detail analysis on BICHI strategy and introduction
Bichi strategy basically deals with 2 indicator known as Bollinger bands and ichimoku clouds. This accumulation is based on reliability and scalability towards your trades, hence you need multiple Indicators for better and fruitful results. This accumulation is also known as confluence trading. Here we are combining two indcators mainly bollinger bands and ichimoku. They maintain good relationship providing better momentum and strength of asset. Bollinger bands we had discussed in our previous session of crypto whilst ichimoku was also discussed in same session though Bollinger bands play a vital role attempting support and resistance levels whilst ichimoku clouds settle the momentum of price.
These Indicators provide a good opportunity and signals by maintaining 80% accuracy, whilst when you know the resistance and support from Bollinger bands thus ichimoku finds the getaway to identify golden routes from market.
Trend identification:
Trend identification is basic issue for traders you can't invest just by sentiments or fundamental analysis, you need a good strategical approach and formula to calculate the trend momentum in market. This can either be manipulate by your mentor or by your personal expertise using technical indicators or strategies which we had discussed in detail lectures about many Indicators and strategies including that bollinger bands and ichimoku are one of them which purify the traders need and extract trend reversal and current trend in market. Since as you know trend basically leads in two directionsupward tend and downward trend meanwhile trend reversal might happen also to distinguish the market structure.
You guys aware of the term trend is your friend, until the end when it bends this basically used by mentors which examine the buy and or sell your asset, becuase a short momentum or fluctuations can break your tempo and you might exit or enter in market for maintaining that, trends identification play vital role for better manipulation for better identification better strategies should use since we are using BICHI which is accumulated by Bollinger bands and ichimoku.
Upward trend:
Upward or bullish trend is assumed when the green soldiers or continuous upward price action can be seen making different strategies like higher highs or bull run position.
Since bollinger bands and ichimoku are also trend identifiers which can depicts good signals in market, bollinger bands traced out the resistance and support areas and ichimoku clouds ready to extract the trend cycles and a perfect breakout for upward or bull cycle. There combination became bichi analysis which we will explore in below chart.
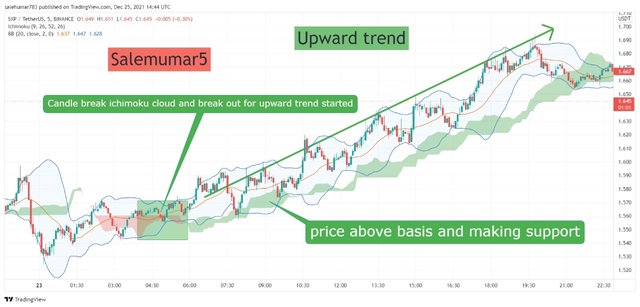
Above chart shows us the upward trend, coin is SXP/USDT 1.56$ the price shows upward trend because the Bollinger bands making support and resistance price also crosses the basis line making upward motion.
Downward trend:
Downward or bearish trend is assumed when the red soldiers or continuous downward price action can be seen making different strategies like lower lows or bearish cycle.
Since bollinger bands and ichimoku are also trend identifiers which can depicts good signals in market, bollinger bands traced out the resistance and support areas and ichimoku clouds ready to extract the trend cycles and a perfect breakout for downward or bear cycle. There combination became bichi analysis which we will explore in below chart.
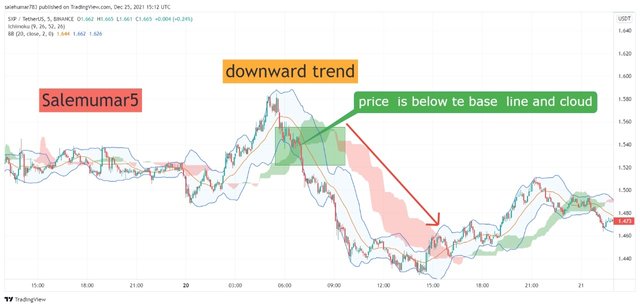
Above chart show us the downward trend, from 1.560$ the price strated downward direction and ichimoku cloud breakout jas been observed and moving down whilst bollinger bands also show that basis line also giving price downward and pushing it downward.
Trend reversal
Trend reversal can be formed in tow stages might, one is that when price making consolidation in market and suddenly they maintain new gateway and price move upwards or downward. When price turns the direction by moving upward suddenly makes new position in market by moving downward thus what trend reversal area which is very useful to analyse. If you captured this by using correct tools you might get beneift from heathy profits.
Bichi indicator is one of accumulation of Bollinger bands and ichimoku which predicts us perfect and approximately 80% accuracy in market by depcits reversals in market, lets analyse two main trend reversals.
Downward and upward trend reversal:
For downward trend reversal using bichi strategy when market making sideways with Bollinger bands, and price showing upwards movement and no bullish cycle is shown instead a sideway market is obtained thus a new trend might be in market, and showing the price breaks the cloud amd move below basis and clouds thus downward trend is observed and trend of bull run has been finished and downward trend has started. Same when market is in bear cycle and making lower lows and bear cycle thus a sideway happen and ultimately price move upward amd crosses the base line and clouds thus bichi Indicating new trend in market.
Lets see these trend indications in below chart
Upward trend reversal:
Below chart shows us 5 mins timeframe analysis of sxp/usdt chart. Where the market is making lower lows and moving in downward cycle thus suddenly market makes a turn over and start making sideways which gave us the first identification of trend reversal, since you can see, market break the resistance and downward to upward trend reversal is observed and bichi plays a role by verifying price is above clouds and basis line which you can see na continuous upward motion has been depicted.
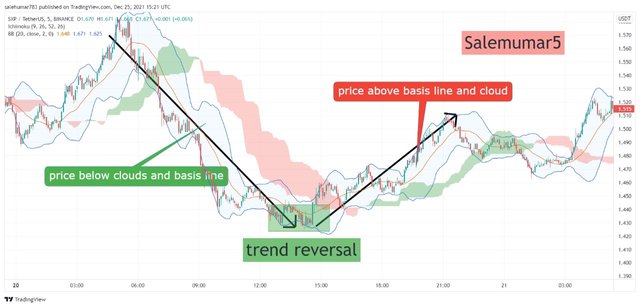
downward trend reversal:
Below chart shows us 5 mins timeframe analysis of sxp/usdt chart. Where the market is making higher highs and moving in Upward cycle thus suddenly market makes a turn over and start making sideways which gave us the first identification of trend reversal, since you can see, price market break the support and starts going downward to new trend reversal is observed and bichi plays a role by verifying price is above clouds and basis line which you can see na continuous downward motion has been depicted.
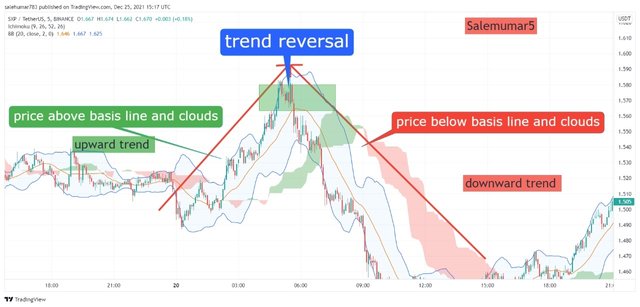
Sideways trend reversal:
Sometimes market is showing continuous sideways motion, this also leading us towards any situation by moving upwards or downward since bichi indicator having good familiarity about resistance and support and from this a clouds breakout indicates us new trend in market below charts show us both directions of trend reversal in a sideways situation.
Market entry and exist points
Entry point using BICHI:
Entry in market using bichi first need to understand the market sentiment and trend of current market. Using bichi always do check bollinger bands if price is above basis line such base line show the market support amd wait for ichimoku cloud to give perfect breakout for upward direction then entry point is formulated where the closing of breakout candle is established do take entry position there and stop loss should be placed by assuming your risk reward ratio and its good to sett your stop loss at Bollinger bands support level.
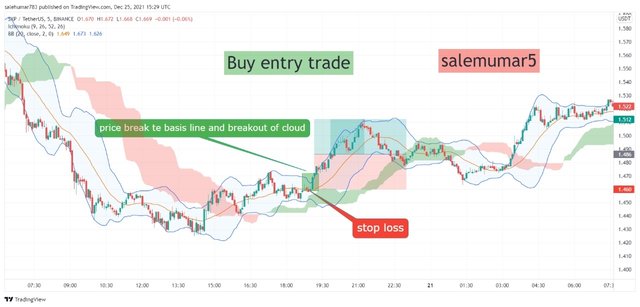
Above chart shows us the buy entry trade, where price move above basis line and Bollinger bands are also making support and resistance, thus waiting for clouds breakout and price is above basis line and breakout of ichimoku has been depicted and maintain my stop loss by the help of basis line and same where the candle open below basis line.
Exist point using BICHI:
Exit point from market using bichi strategy when price showing downward direction, use Bollinger bands first to check the resistance level and if price is below basis levels then wait for ichimoku to show perfect exist position where ichimoku cloud move downward we make our sell position and stop loss level is sett according to your risk reward ratio and good to sett stop loss at Bollinger bands resistance level.
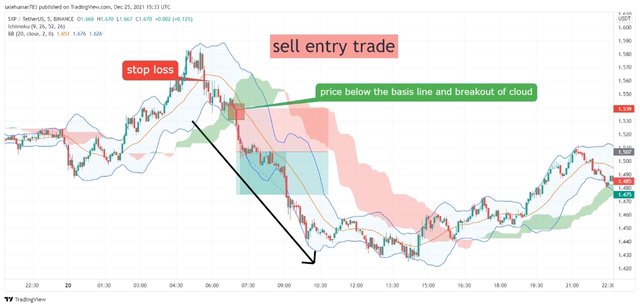
Above chart shows us the exit entry trade, where price move below basis line and Bollinger bands are also making support and resistance, thus waiting for clouds breakout and price is below basis line and breakout of ichimoku has been depicted and maintain my stop loss by the help of basis line and same where the candle closed at basis line.
Demo trade
We had discussed the theoretical part now lets make a practical approach by making demo trades we will will do buy and sell trade using bichi strategy.
Upward trend and buy trade:
Let us now look practically how to use this Bichi Strategy. Here, I will discuss about the buy side trade using the Bichi Strategy. Then price breaks these levels in Upward direction wait for ichimoku clouds to signal us breakout and base line move in upward direction and entry point can be sett in next candle.
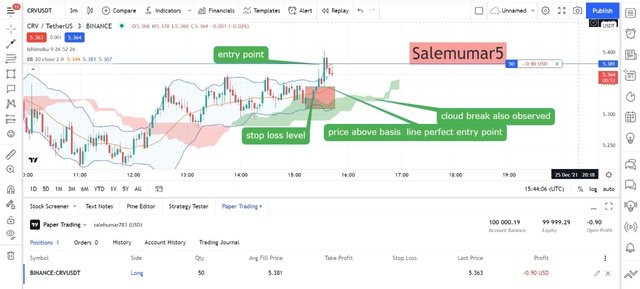
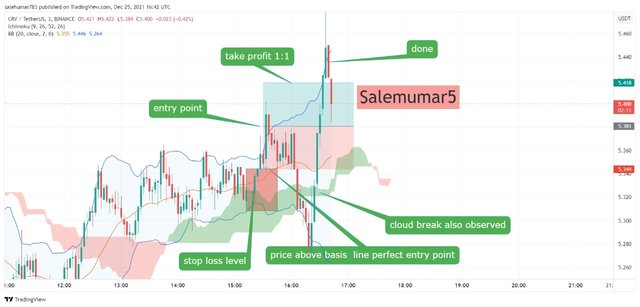
Above chart you can see price breaks the baseline and breakout from cloud moving upward direction and from next candle which highlighted you have to make entry for buy trade. 5.39$ is the price where the perfect combination of bichi strategy has been seen my risk reward ratio is 1:1. Chart also show the crv/usdt buy position.
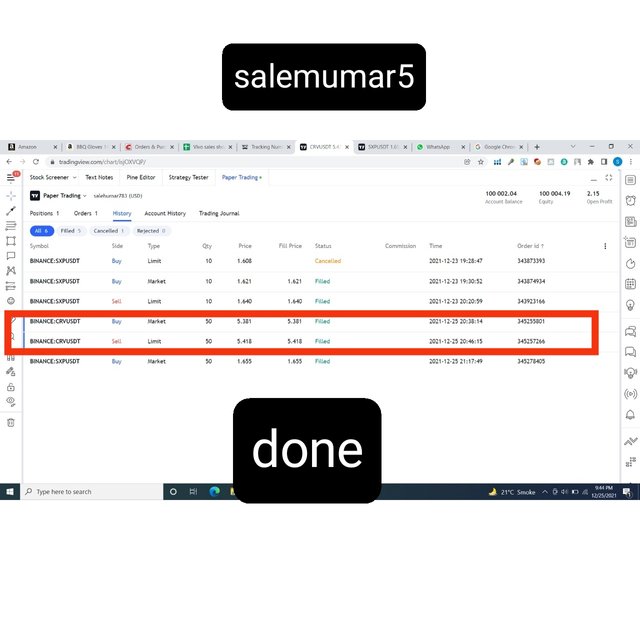
After minutes ago the price hits my profit and target, which you can see clearly the price action croses the ling position area which i maintain for position. The chart below is the perfect strategy of bichi indicator and fruitful results.
My opinion for BICHI strategy
Bichi strategy having a marekt capture of 80% where this % means alot in trading because no strategies and technical tools offers you such management that bichi provides. Traders should have enough knowledge in ichimoku and Bollinger bands to analyse the appropriate market levels to obtained good results from bichi.
Bichi strategy can be useful for both long-term and short-term trades becuase ichimoku Indicator is mainly used detect the long-term goals, since using Bolling bands verify us the resistance and support levels since it is possible when you use 5 mins time frame that it might assure you better result for short term.
Bichi indicator can be easy to use and analyse the market sentiment because this Indicator is a mixture of complete package for traders and a maneuver trader can benefit from using bichi strategy alot.
QUESTION:2
Define briefly Crypto IDX and Altcoins IDX. What is signal prediction trading. Is it legal or ill-legal in your country. (Explain briefly) [2points]

Crypto IDX
Crypto idx means cryptocurrency index, which is accumulated by 4 cryptocurrency Bitcoin, Ethereum, Litecoin, Zcash. They rely on demand and supply rules rather than only prices of crypto. This index works on Binomo platform and they were only single entity which maintain this service.
The process of Binomo is established by rigid and complex software since having monopoly and they settled four cryptocurrency only. There Calculation are also made on complex software.
This platform is established for experience traders but beginners can also engage for trading, but this not so easy like spot trading you need good sentiments fundamental and technical analysis experience to engage here, held calculation is also based in software which is quite complex.
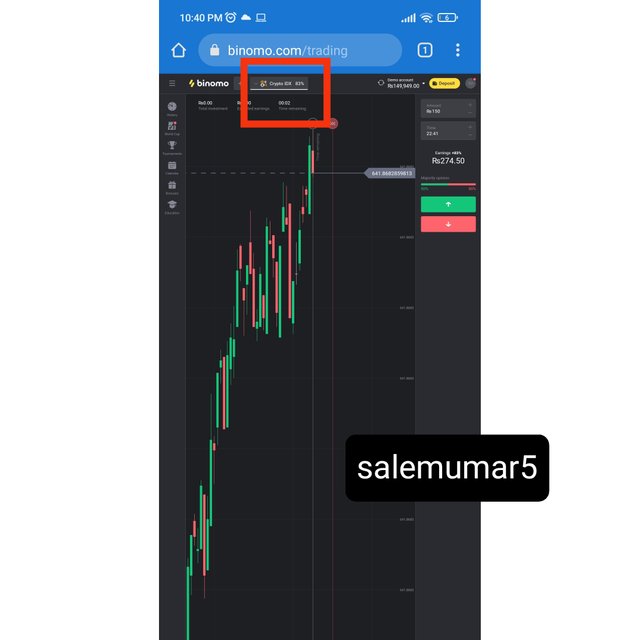
The chart above show us the Crypto idx where enlightened yellow box with red highlight indicates crypto idx and a deposit option is there to add four crypto currency to run your trade but still its based not only for price but a parameter if demand and supply were also use.
Altcoins IDX
Here the trading is based on alt coins and trading is based on healthy alt coins, at least four alt coins are used to analyse parameters and calculation. The four alt coins are Ripple, Litecoin, Monero and Ethereum.
Same Iike crypto idx and alt idx is based in software where complex calculation and demand and supply are used to analyse the profit
It can be examined from Binomo platform, here we alos need to do sentimental fundamental and technical analysis but a good analysis on demand and supply.
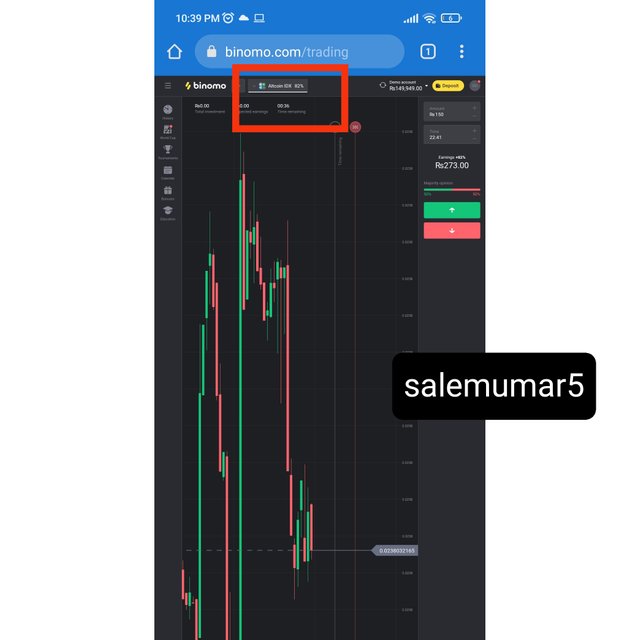
The chart above is from Binomo platform where yellow box indicates us Alt coin IDX. The deposit option is there to enter your four alt idx coins to run trading in Binomo.
Signal prediction trading.
Signal prediction trading is based on the future price of asset. Signal prediction is not like spot trading but here we need to analyse the demand and supply of price and no need to hold the asset, but here you need to hold the sentiments if you suggest and analysis correct prediction for asset price you can enjoy profit.
Since they are subdivided into manual and software trading, mentor who have good experience uses manual strategy but software trading of signal prediction is done by a redimit software which predicts and extract the future price prediction in a same manner which i illustrated above.
Is it legal or ill-legal in your country.
As i made a research about the illegality of this trading came to know that its legal in my country because forex trading is based on this widely, some traders use this (signal prediction trading) to analyse the price of asset and manipulate the prediction among strong financial persons that invest their money and do benefit from signal prediction trading. Since the point of illegality came where traders use their credit cards to sell and purchase crpyto currency because state bank of Pakistan has prohibited the sell purchase of virtual assets by circular number 3 from banking policy and regulation department.
Since signal prediction trading from Binomo platform is allowed and not declared illegal yet from Pakistani govt.
QUESTION:3
If you want to create your own penny IDX, then which 4 penny assets will you choose and what what is the reason behind choosing those four assets. Define Penny currencies.(Explain, no screenshot required). [2points]
Penny cryptocurrency
Penny currency are alos known as shit coins having a value approximately 1$, these tokens having low pooling profits but they have high and good profit ratio, once the coin became stable before you invested as a penny can admire you very much. You might know few months ago the hype of doge coin and many traders get fruitful results and profitable portfolio from this coin and shiba and other penny currency like chiliz, shiba, safemoon and doge are below 1$ and buying these coins in large amount can ultimately give you good result in future.
It is a digital coin that costs approx $1. These are very similar to larger coins or stocks just their price is lower because of that these are known as penny cryptocurrencies. There is a very big advantage of investing in potential penny currencies because they have a high potential to profit. Also, investing in penny crypto coins will help to diversify your portfolio.
I want to make my own idx there should contain
- Good circulating supply.
- A good it expert which us the main person.
- Listed on atleast one popular exchange like binance.
If any of these are fulfilling in penny even one factor i will do invest because this is penny crypto and need time to admire above factors. My oenny idx are dogecoin, shiba inu, chiliz and xrp. These coins having low price below 1$ and every one cam sett their portfolio easily.
Now i will demonstrate my penny crypto sustainability which will admire you to invest in it.
1: Doge coin:
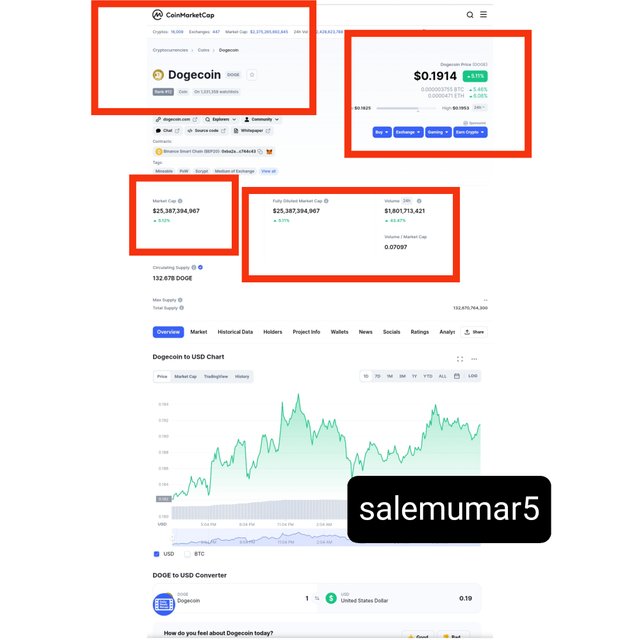
Doge coin is a hype coin and known as Meme coin. Many traders get benefit from this coin and even i did a intraday profit. Since it is now not just a meme coin but becoming stable coin. Its reliability is quite good but still a meme coin you need to be careful for trading in it. It is based on popular exchange Binance. The chart below show us the price , circulating supply and worth of dogecoin.
2: Xrp coin:
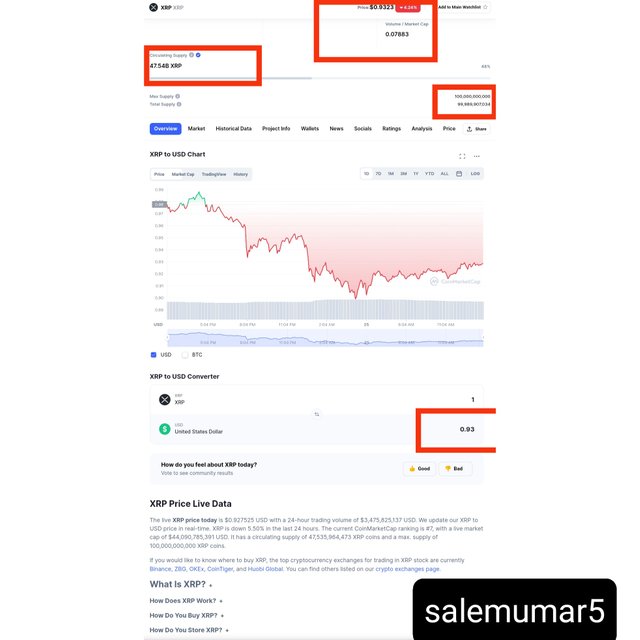
XRP known as ripple having 7 rank in Crypto, it was launched in 2012. Xrp having pairs with healthy coins btc,bnb and other top rated coins. Xrp having good circulating supply and it has been listed on reliable crypto exchange, having good circulation towards all over the markets. The exchange which are leading xrp towards more reliability are binance, Zbg, coin tiger etc.
You can see below the supply price and xrp worth from coin market cap.
3: Chiliz coin:
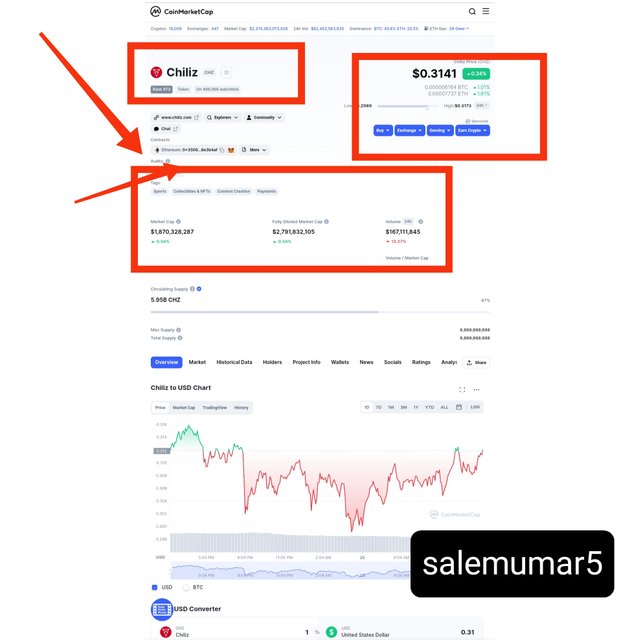
Chiliz having great relation with socio.com, and built in chili blockchain. Although fan allow traders to purchase fan token. These tokens token having engagement from sports world and teams like fcb Barcelona, paris saint-germain, atletico madrid, juventus and ufc etc. Thus having good reliability by this socio.com platform.
Although chiliz admired me alot because they providing audit reports for source code to maintain security scalability (Api.partners).
Chiliz having contracts with meta mask with eth blockchain network. You can easily do invest in this coin having price below 1$. The chart below dhow price worth, circulating supply and other basic information.
4: Shiba Inu coin:
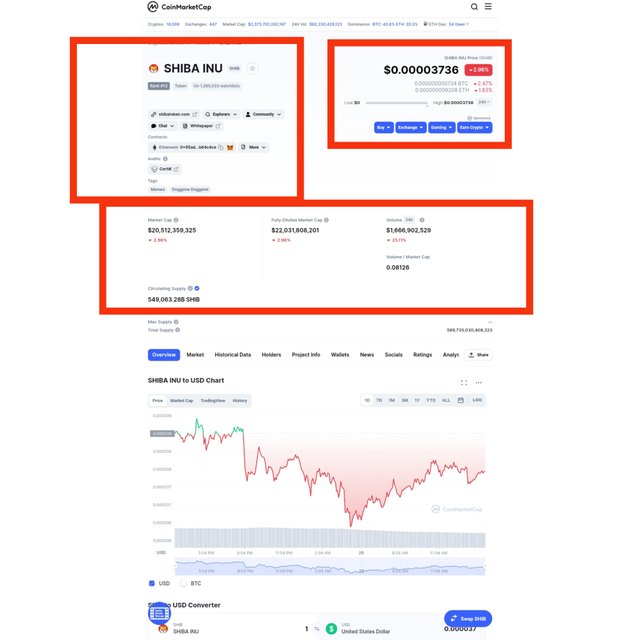
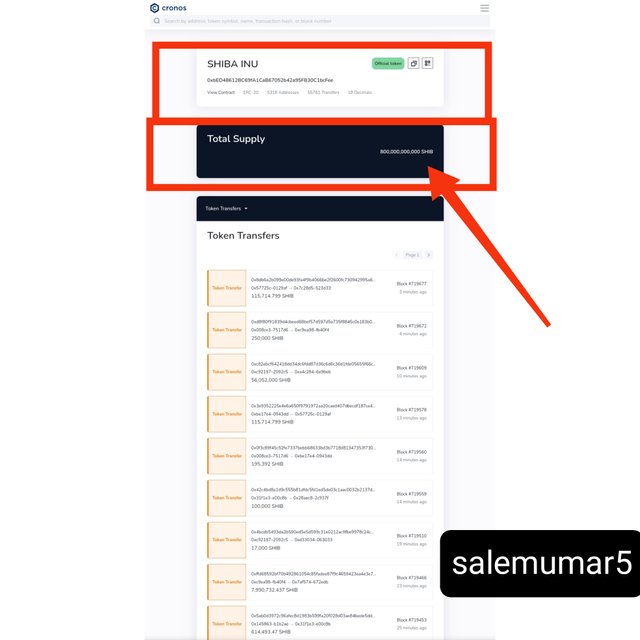
Shiba Inu token known as Shib and it is listed binance platform, and it is originated from dogecoin. Its a meme coin but fortunately provides traders a good opportunity in past months ago. Although in binance this coin having multiple pairs with many healthy coin. It chooses audit trail by certiK source code.
Since coin market cap show us price worth, circulating supply and other shib inu details.

QUESTION:4
Conclusion

Conclusion
This lecture provide us overall detail explanation about coin therapy using bichi strategy and crypto idx and penny idx further a detail exaggeration about oenny cryptocurrency.
This lecture was small and complete in leading with cryptocurrency. A good visualization of strategic approach by using bichi ultimately defining cryptocurrency
I basically like the strategy which is extremely easy and convenient to use for beginners. Professor also exhibited us the homework post in easy manner and i delivered it in my best manner hop you guys understand my means.
Thanks professor for such a knowledgeable lecture and i honestly like to engage in your homework post.
Regards
@salemumar5