Question 1
Explain in your own words what the A/D Indicator is and how and why it relates to volume. (Screenshots needed).
A/D INDICATOR stands for Accumulation and Distribution indicator which was invented by Marc Chaikin. It is a accumulative indicator uses volume and price for the evaluation whether goods are being accumulated or distributed.
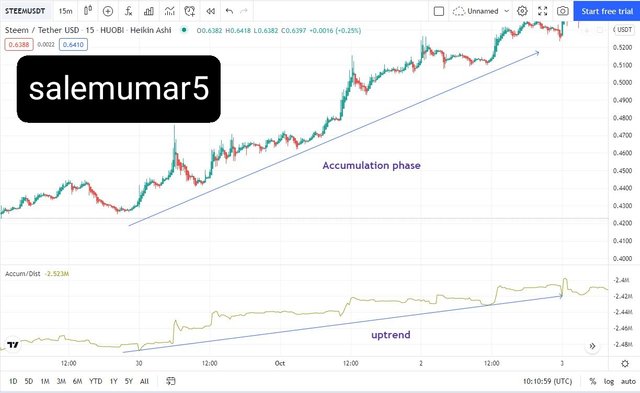
Accumulation Phase
Accumulation simply means when asset has been hold by the traders for the sake that the price of an asset rise up so that many traders wish to acquire and hold asset for the period as this period of accumulation end the price of asset goes up.
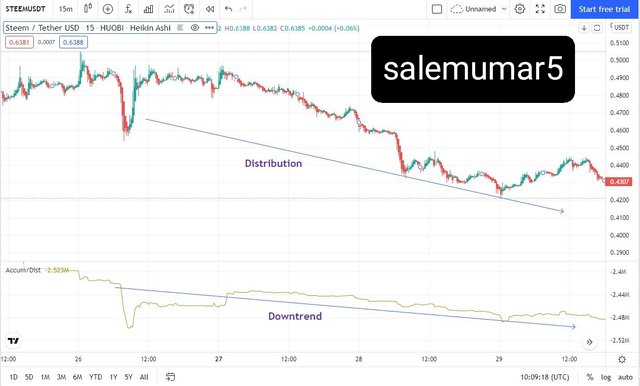
Distribution Phase
Distribution means that when the price of the asset has been high this happens when the asset is overbought. At tbis moment traders who has has bought the asset in the accumulation period wants to be way out that they better know the market and very well known about the prices of the asset will soon face a decline.
As, A/D INDICATOR is very important usually traders and investors both they added this indicator to the chart so that they can experience the up going prices of the asset, as this results in that traders are holding and buying the asset and on the other hand, when the indicicator face declining phase the traders distribute the asset.
It is utilised for the prediction of the prices and to determine the trend of the market either it is on downtrend or uptrend.
A/D indicator is usually signifies graphically with a line which shows the up down of prices which helps the traders to easily aware of the current market condition.
These features of A/D indicator entitled the trader to evaluate the weak and strong signal of the market so that the traders can make a wise decision in trading.
This indicator also identify good liquidity position of the market as this is the basic sign for the buying and selling of asset.
As we know that there is not a singal indicator which is 100% correct or perfect but they may be correct to some great extent every indicator has demerits while having many advantages so that t we can have fruitful results ignoring the disadvantages of the indicators.
AD Indicator with compliance with volume:
The indicator detects the low sensitivity because we had use many Indicator which is very lagging plus irrespective with price action though and some are very efficient to accumulate the formation of price though using AD with other can depicts more fruitful result with trades and surely can eliminate false signal.
As above the phases of accumulation and distribution has their own beauty with AD indicator and volubility has proper working with them so during accumulation phase when buying pressure is high and and holding the asset there would ne a gradual increase in the price action leading the deviation or price action upward and increases the volume of asset that you hold, similarly when the selling pressure is at peak teh decreases the volume and resulting decreases in correspondence price.
By initiating other strategy and tools it will be easy for traders to contrast the market structure and advances their trades in market.

Question 2
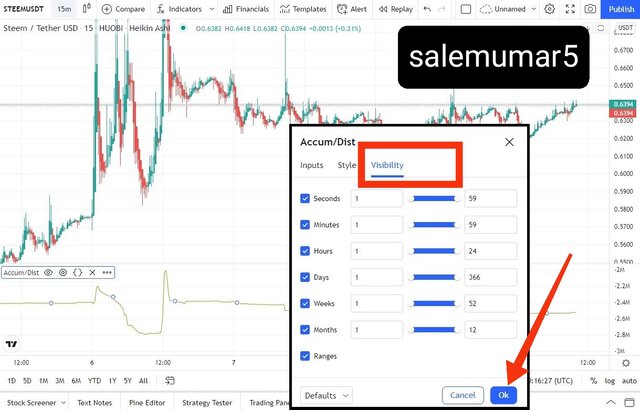
Through some platforms, show the process of how to place the A/D Indicator (Screenshots needed).
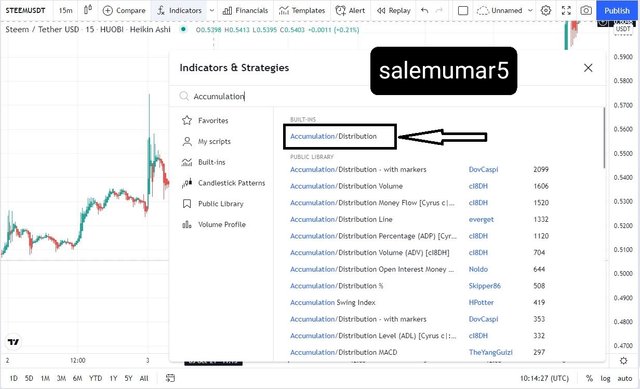
- As we can see, that is the chart of steem/USD. At the top middle of the chart is the fx indicators do click on it.
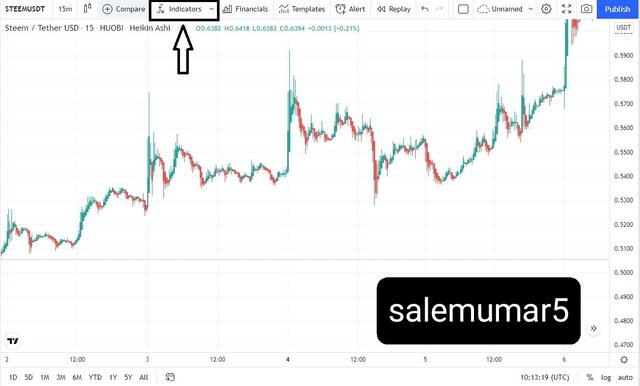
- Do type the A/D Indicator and click on Search and choose the A/D indicator.
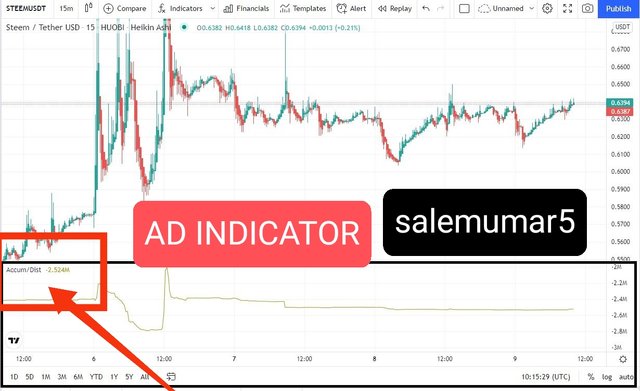
- Here we go , the Indicator has been successfully manifest in chart now you can do technical trade.
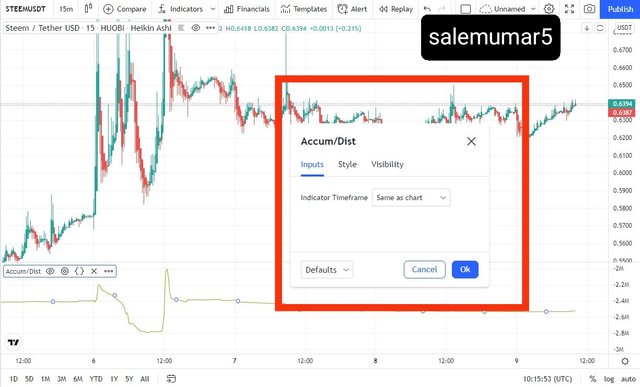
- The indicator us best as oer defualt setting.
- Here you can change the colour and trend line of indicator.
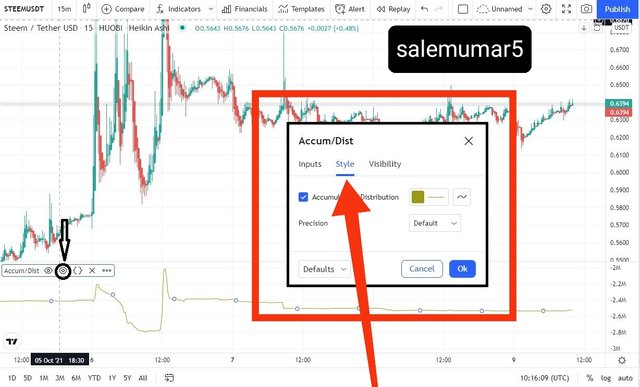
- This option is also suited best for defualt settings.
Question 3
Explain through an example the formula of the A/D Indicator. (Originality will be taken into account)
In this question, i will be explaining the formula for A/D indicator through an example
There are three parameters for the calculation of A/D indicator.
- Money flow multiplier
- Money flow volume
- Previous Accumulation /Distribution line
As, to get started firstly, we have to evaluate the previous accumulation and distribution line. So, after that we have o multiply the current money flow multiplier and money flow volume and than sum up to the previous accumulation and distribution.
Therefore,
AD =P(AD) +MFM×MFV
Here,
AD =Accumulation /Distribution
P(AD) =Previous Accumulation /Distribution
MFM=Money flow multiplier
MFV=Money flow volume.
To calculate the MONEY FLOW MULTIPLIER (MFM) :
MFM= [(C - L) - (H - C) / (H - L)]
Here,
C=closing price
L=low price
H=high price
To calculate the MONEY FLOW VOLUME (MFV) :
Money flow volume is the outcome of money flow multiplier and volume of the interval.
MFV=MFM × VP
VP = Volume for the interval
As above is the all data that we should be able to find in a chart Now, i will evaluate with the example in detail to determine the A/D indicator with the help of formula.
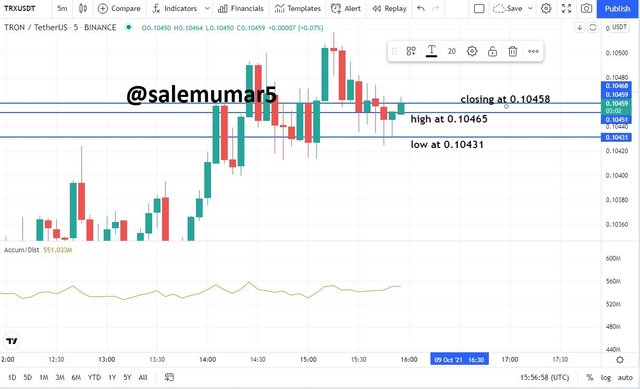
- I have taken TRXUSDT pair to calculate the AD of the pair.
Closing price = 0.10458
High of the price = 0.10465
Low of the price = 0.10431
Volume VP = 6.434M
Previous A/D= 550.427M
- MFM = [(closing price - Low of the price) - (High of the price- closing price)] / (High of the price- Low of the price)
MFM = [(0.10458 - 0.10431) - (0.10465- 0.10458)] / (0.10465- 0.10431)
MFM = 0.588
Now find MFV,
MFV = MFM × VP
MFV = 0.588 x 6,434,000
MFV = 3,783,192
Now for AD we get,
AD = P (AD) + MFM × MFV
AD = 550,427,000 + 0.588 x 3,783,192
AD = 552,651,516.896
Question 4
How is it possible to detect and confirm a trend through the A/D indicator? (Screenshots needed)
In this question, the detection and confirmation trend by using A/D indicator has been highlighted to examine the price of the asset is on uptrend or downtrend.
For Uptrend ( bullish cycle)
As, to determine the accumulation phase we have to keep an eye on the prices shows in chart if they are going up and continues that moment and the A/D indicator also shows uptrend this results in the high purchasing of asset in the market with respect to the the time period. Therefore the price of the asset will go up. So the indicator will also affirms you the trading zone and will demonstrate perfect upward movement as per AD you can use other indicators to make your trade perfect.
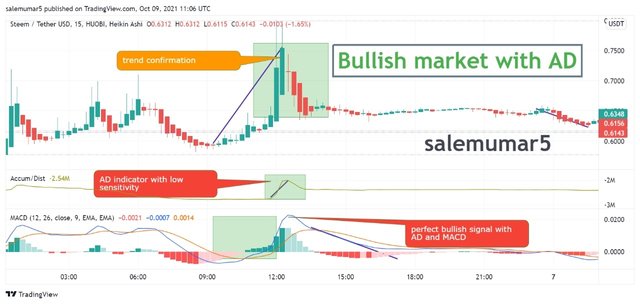
Here in above chart i used the macd and Ad Indicator with steem/usdt and thus there is bullish market is observed and $0.59 there is bullish market though its heikin ashi strategy which provides a perfect bullish market cam be seen till 0.75$.
For Downtrend (bearish cycle)
On the other side, when the price of the asset show the downtrend and the A/D indicator also shows the same moment this results in distribution. In this phase the high selling of asset take place which dominate the market of asset with respect to time period. Therefore in this phase traders sell their asset at high prices so that you can gain good profit margin. Therefore the price of the asset will gi down. So the indicator will also affirms you the trading zone and will demonstrate perfect downward movement as per AD you can use other indicators to make your trade perfect.
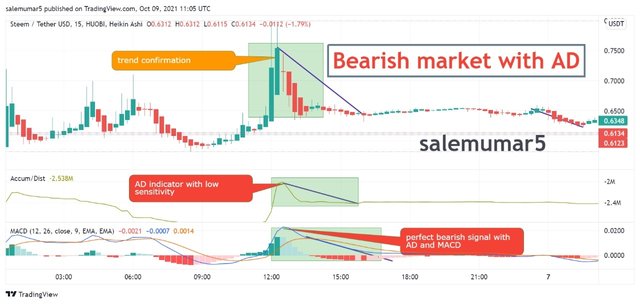
Here in above chart i used the macd and Ad Indicator with steem/usdt and thus there is bearish market is observed and $0.59 there is bearish zone in market though its heikin ashi strategy which provides a perfect bearish market can0.64$ and then consolidation zone has also been observed than again bear zone cam with quik revrsal till 0.62$.
Question 5
Through a DEMO account, perform one trading operation (BUY or SELL) using the A/D Indicator only. (Screenshots needed).
Here I used a demo account to perform a buy and sell trade with a limit so to satisfy both requirements in question. At price 2.277$ buy a coin ada/usdt(time frame 5min) with stop loss 2.266$ while take profit 2.279 with RR1:1 and price action is hit and the trade is dine according to Ad Indicator.
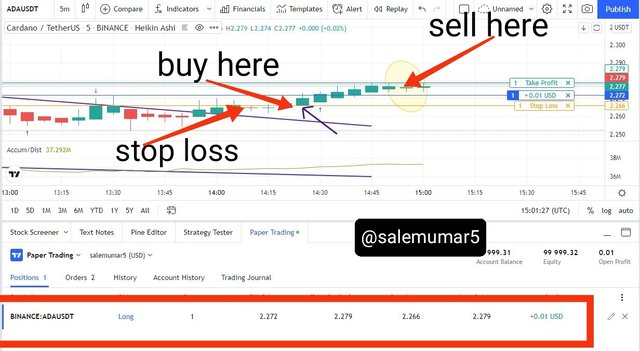
Trade history

Question 6
What other indicator can be used in conjunction with the A/D Indicator. Justify, explain and test. (Screenshots needed).
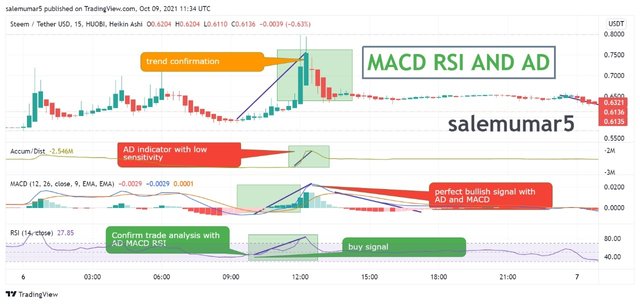
Using Indicator with conjunction RSI MACD AND AD
Here i use 0.5866$ - 2.674M where the Accum/Dist ,RSI 49.13 and MACD -0.0038 where i selected the buy positon and there I interpret with three Indicator to sett the buy position, thus make easy for the buy position so AD Indicator shows a accumulation zone though affirmation of two Indicator can embedded better results.
Conclusion
Although, A/D indivator is a good indicator that shows results by utilising the volume of the asset to examine the liquidity in the market.
As above i have deeply explain how its works but now to conclude it simply works, on thr trends in the market as if the trend is an uptrend that show high pressure of buying the asset and on the other side, when the market faces downtrend it shows high selling pressure of asset in the market.
As we know that the indicators are not perfect at all, it has some blemish. So the traders are advised to use the indicators with all precautions and be focused while using for making trading decisions.
The A/D indicator also forecast trend that are reversal if there is a divergence in price and the A/D line,it is better to use the indicator with other indicators to get more advantageous trading signals.
I will be very thankful to professor @allbert,for an amazing lecture i got to know alot from your lecture it will be very helpful for me in future.
Hello @salemumar5 Thank you for participating in Steemit Crypto Academy season 4 week 5.
Downvoting a post can decrease pending rewards and make it less visible. Common reasons:
Submit