
Question 1:

What do you understand by ultimate oscillator indicator. How to calculate ultimate oscillator value for a particular candle or time frame. Give real example using chart pattern, show complete calculation with accurate result.
Ultimate Oscillator Indicator
This indicator was famous due to highly prediction over price momentum with minimum signals and attaining maximums fruitful signals in volatile market. Held this indicator was based on two moving averages combination and provides us the Awesome ultimate oscillator indicator, the bases of this Indicator was harvest by Larry Williams in 1976. Traders can initiate different time frames using this Indicator although the opportunity of signals matter after tempering the time frame, best of this Indicator frame rate is observed in lower time frames.
Similarly likewise other Indicators oscillator also set same criteria for buying and selling nodes held same divergence are sett according with one more divergence base indicator although buying and selling cycles are based on bullish and bearish divergence, you can trade in bullish trade by taking buy trade whilst bearish trade can enhance exit criteria.
Traders using future trades can extract many fruitful results by applying this oscillator indicator with one more efficient strategies like higher high lower low, bichi strategy and sharkfin patterns. So this Indicator can be advance and emerging technology of moving average you can just imagine this for understanding.
Technical nodes of oscillator indicator this Indicator not only manipulate you the divergence but like rsi it will illustrate the trader about overbought and oversold position in market. The 0-100 area is the domain and range of overbought and oversold criteria of oscillator, oversold is examine when price is above 70 means indicator enlightening above 70 range and overbought condition will be examined when price is below 30 whilst 50 shows the sellers and buyers are equally chasing the market making consolidation patterns in market.
The general mathematical formula for the calculation of the indicator values is given as:
UO=(((A7 * 4)+(A14 * 2)+(A28))/7)*100
where
UO = Ultimate oscillator value
A7 is the average computed taking the value over 7 periods calculated by computing
(Sum of BP for the past 7 days / Sum of TR for the past 7 days)A14 is the average computed taking the value over 14 periods calculated by computing
( Sum of BP for the past 14 days / Sum of TR for the past 14 days)A28 is the average computed taking the value over 28 periods calculated by computing
(Sum of BP for the past 28 days / Sum of TR for the past 28 days)
- Bullish Pressure = Current Close – Min(Current Low or Previous Close)
- True Range = Max(Current High or Previous Close) – Min(Current Low or Previous Close)
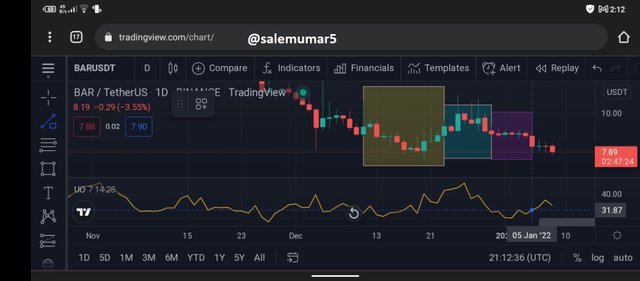
I've computed the different values for the buying pressure and true range over the past 28 periods below.
| periods | buying pressure | True range |
|---|---|---|
| 1 | 0.21 | 0.29 |
| 2 | 0.15 | 0.05 |
| 3 | 0.19 | 0.15 |
| 4 | 0.20 | 0.18 |
| 5 | 0.03 | 0.13 |
| 6 | 0.06 | 0.13 |
| 7 | 0.08 | 0.37 |
| 8 | 0.06 | 0.28 |
| 9 | 0.42 | 1.14 |
| 10 | 0.06 | 0.61 |
| 11 | 0.23 | 0.01 |
| 12 | 0.02 | 1.53 |
| 13 | 0.07 | 0.04 |
| 14 | 0.24 | 0.82 |
| 15 | 0.11 | 0.55 |
| 16 | 0.09 | 0.60 |
| 17 | 0.49 | 0.94 |
| 18 | 0.06 | 1.13 |
| 19 | 0.12 | 0.43 |
| 20 | 0.25 | 0.09 |
| 21 | 0.02 | 0.11 |
| 22 | 0.55 | 0.06 |
| 23 | 0.19 | 0.17 |
| 24 | 0.08 | 0.08 |
| 25 | 0.07 | 0.28 |
| 26 | 0.10 | 2.12 |
| 27 | 0.12 | 0.43 |
| 28 | 0.19 | 0.24 |
From the information computed and given above
- A7 = 0.92 / 1.3 = 0.70
- A14 = 1.96 / 5.73 = 0.344
- A28 = 4.32 /12.72 = 0.339
Substituting all values gotten into the general formula will give
UO=(((A7 * 4)+(A14 * 2)+(A28))/7)100
UO=(((0.70 * 4)+(0.344 2)+(0.339))/7)*100
UO= 31.87
The UO value gotten in the chart above is 31.87 which means the calculation is accurate. With the use of the mathematical formula, I've been able to calculate the value for the ultimate oscillator indicator.

Question 2 :

How to identify trends in the market using ultimate oscillator. What is the difference between ultimate oscillator and slow stochastic oscillator.
The trend indications is same as we predicted in our previous trading strategies, though you just need to do a proper technical analysis on overbought and oversold areas. Lets analyse them with detail using Ultimate oscillator.
Bullish Trend
The bullish trend in market happens when price and bull came together for pushing the price upward direction held their are active buyers can be seen though using ultimate oscillator you have to judge the overbought position where the price show the maximum utility for that you also have to extract the oversold area because that area shows you the appropriate significant of bullish movement.
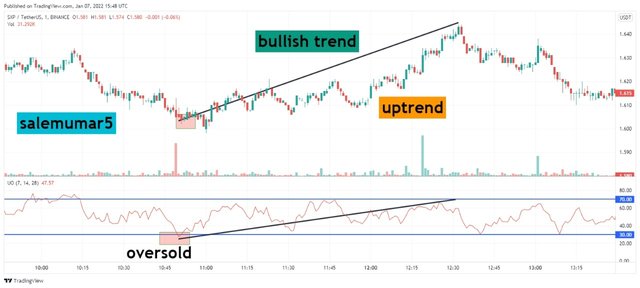
The chart above you can see Sxp/usdt with 1min time frame, held you can see that oscillator is in oversold area becuase the having greater potential to resist the market in bearish mode, held you can see as per rule we had market the position where the market pretended a bearish cycle and oversold region thus from their the market booms in their own way from below 30 area and touch the overbought area held the price pumped from 1.600$ to 1.64 < above. As this is known as bullish market using oscillator indicator.
Bearish Trend
The bearish trend in market happens when price and bear came together for pushing the price downward direction held their are active sellers can be seen though using ultimate oscillator you have to judge the oversold position where the price show the maximum utility for that you also have to extract the overbought area because that area shows you the appropriate significant of bearish movement.
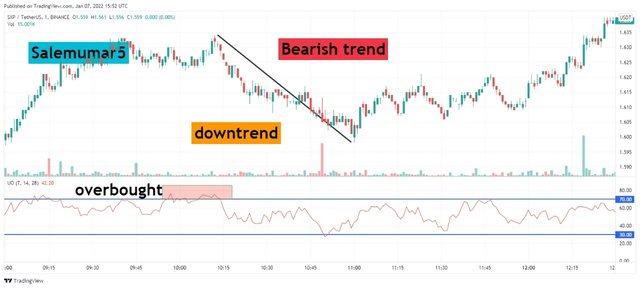
The chart above you can see the bearish cycle in sxp/usdt chart of 1 min time frame. The price show upward movement in market i enlightened the oversold area where active sellers are observed, than potential of buyers has been extracted by oscillator indicator where the price shows downward trend and oscillator obeys the price volatility with appropriate momentum.
Slow-stochastic Indicator
The Slow stochastic indicator enables the price volatility and enhance the buy and sell strategies in market. The indicator is might be a lagging indicator observed but using different strategies and indicators you can cope up good position in market by using K can be used in buy signal which is below 20 contrarily sell signal when K is above 80 level. These two parameters are periods in Slow-stochastic Indicator.
| Oscillator indicator | Slow-stochastic |
|---|---|
| The ultimate oscillator is based on 3 periods 7,14 and 28 and cope up best momentum in market for analysing the bullish and bearish divergence. | Stochastic possess 2 periods 14 and 3 which throughout make the oversold and overbought position in market with best medium. |
| Here the reliability and scalability towards signals are high and no false signals established having 80% scalability. | Not filtered signals are covered, but sometimes a good advantage has been acquired but low reliability and scalability can be seen as per UO. |
| Here no need of other Indicators to confluence your trade, even a good analysis of divergence using ultimate oscillator can advance your trade | Slow stochastic must need parralel indicator to obtain maximum profitability ratio in market. |
| Simole and easy to analyse the market momentum by just reading the appropriate trend but for divergence leisure time should be spend. | The emerging periods often visualise the trader means easily and exacerbate the market in just reading the indicator levels. |
| Overbought area is observed by below 30 level and oversold area is observed by above 70 level, whilst 50 medium range is equal distribution between seller and buyer | Here the regions are different because the indicator flow between two periods thus as per calculation 80 upward is overbought and 20 downward is oversold area. |

Question 3:

How to identify divergence in the market using ultimate oscillator, if we are unable to identify divergence easily than which indicator will help us to identify divergence in the market.
The ultimate oscillator visualise the divergence in their own means and thoughts, there is a proper strategy when the market is showing upward motion but the indicator showing downward direction there is way that paves for divergence in market. These divergence are very useful to estimate the market sentiment regarding upward and downward direction.
The divergence are basically upward and downward means Bullish and Bearish nodes in market, these divergence can also similar to trend reversal points same here we will distinguishes these divergence.
Bullish divergence:
The Bullish divergence show when the price is downward direction and indicator showing Upward motion thus there should be turning point for bullish divergence and price croses your bull run towards down run postion and lead you towards the oversold area.
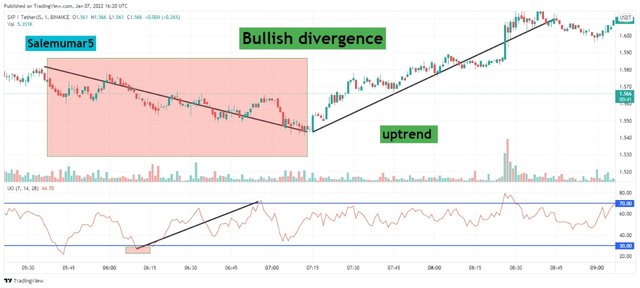
The image you can see the chart of Sxp/usdt pair with 1 min time frame, the price moving downward and indicator is moving and from 1.540$ the price resisting towards 1.60$ above a good long position has been extracted through this divergence. Alone the Indicator perform a good momentum towards price volatility.
Bearish divergence:
The Bearish divergence show when the price is upward direction and indicator showing downward motion thus there should be turning point for bearish divergence and price croses your bear nodes and move towards down run postion and lead you towards the overbought area.
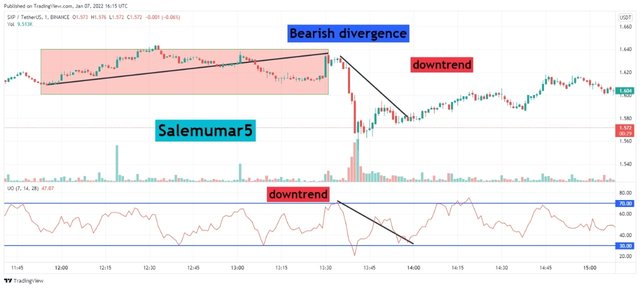
The image you can see the Sxp/usdt chart with 1, min time frame, price moving in upward direction making higher highs and lower lows but in a Upward direction suddenly the trend reversal occur and price breaks the divergence becuase the price is upward but the indicator showing downward position this messages the trader that a bearish cycle should be occur in market and price you can see above touches the ultimate oscillator overbought area.
Can't compete market with UA Indicator initiating bichi strategy to filter out signals
Now i wil implement the bichi strategy in order to maintain better divergence in market. Lets analyse the chart through confluence trading of bichi and UA.
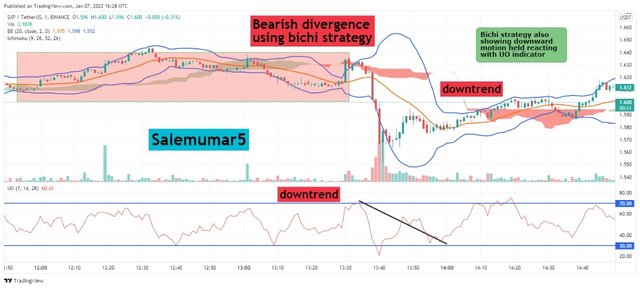
Here above in chart you can see the market bearish divergence using bichi strategy the price making same segments and the reversal occur because the UA indicator is in opposite direction and price in opposite, though our first criteria has been meet, now the bichi strategy show upward direction because the base line is above clouds and price attaining a consistent upward motion but meanwhile the price show new reversal and base line is above and cloud with bearish cycles moving the price downward towards overbought area.
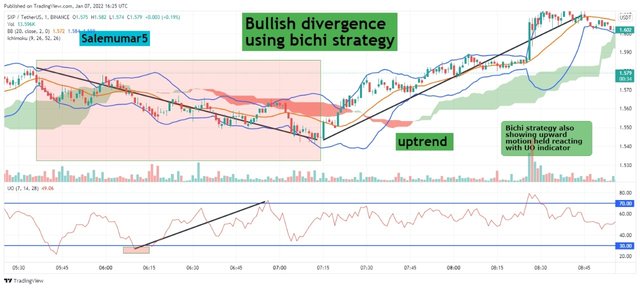
Here above in chart you can see the market bullish divergence using bichi strategy the price making same segments and the reversal occur because the UA indicator is in opposite direction and price in opposite, though our first criteria has been meet, now the bichi strategy show downward direction because the base line is below clouds and price attaining a consistent downward motion but meanwhile the price show new reversal and base line is below and cloud with bullish cycles moving the price upward towards oversold area.

Question 4:

what is the 3 step- approach method through which one can take entry and exit from the market. Show real example of entry and exit from the market.
The entry and buy areas are main motives for evey users thus you need to understand this mechanism with 3 step approach methodology which is given below.
Buy trade:
Always analysis the bullish divergence where you jnwi the price moves in downward trend and indcator moves in Upward trend.
The lower low by price should be below 30 of oscillator indcator shwoing you the oversold region and formulating the upward trend information.
- At the Oscillator indicator move forward at overbought zone and bullish divergence is accomplished by price moving above 70 level
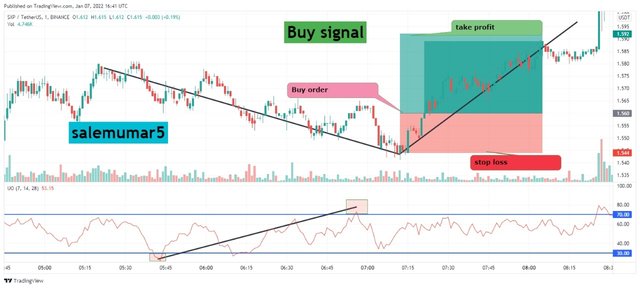
Here you can see the Sxp/usdt chart of 1 min time frame where the indicator moving upward but price moving downward direction, indicating that oscillator is at oversold area below 30 but the indcator show upward trend and leads the price towards overbought region above 70 thus from their a divergence of bullish cycle is integrated and a buy entry has been listed from 1.562$ to 1.592$ take profit area which is enlightened above a stop loss is also sett according to 1:2 risk reward ratio with appropriate risk management.
Sell trade:
Always analysis the bearish divergence where you jnwi the price moves in uptrend trend and indcator moves in downtrend.
The higher high by price should be above 70 region of oscillator indcator showing you the overbought region and formulating the down trend information.
At the Oscillator indicator move forward at oversold zone and bearish divergence is accomplished by price moving below 30 level
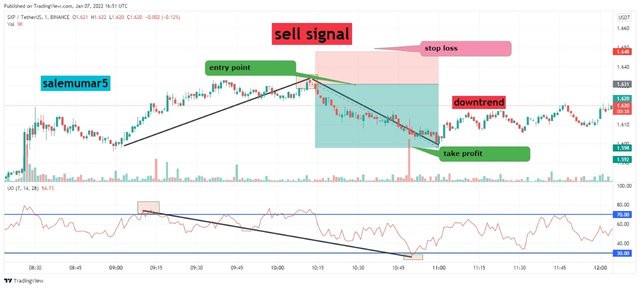
Here you can see the Sxp/usdt chart of 1 min time frame where the indicator moving downward but price moving upward direction, indicating that oscillator is at overbought area above 70 but the indcator show downtrend and leads the price towards oversold region below 30 thus from their a divergence of bearish cycle is integrated and a se entry has been listed from 1.620$ to 1.598$ short trade held a 1:2 risk reward ratio is profit margin and stop loss is 1.648$.

Question 5:

What is your opinion about ultimate oscillator indicator. Which time frame will you prefer how to use ultimate oscillator and why?
The indicator is strong , idle and ahead from other indicator. Having good momentum and support towards volatility in price action. You can generate healthy profitable trades because the overbought and oversold regions exaggerate many opportunities for scalpers. All these signals are extremely profitable because they are paves through three different segments called periods in ultimate oscillator these periods are very useful for scalpers rather the bearish and bullish divergence can be great advantage towards intra day trader.
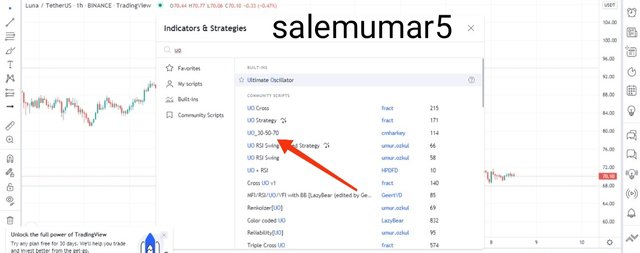
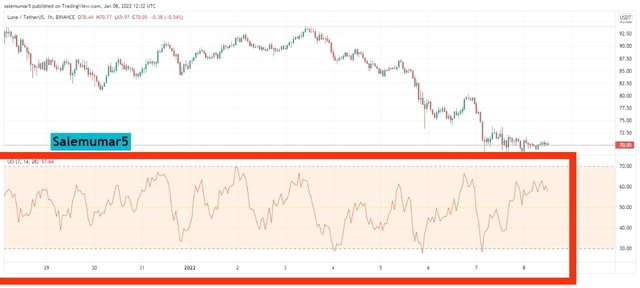
The indicator is based in highly advance technology and reserves many wrong signals because these three period (7,14,28) absorbed the wrong signals in market these are settled according to their calculations, so sensitivity has been engaged in best manner in ultimate oscillator. Always use this Indicator for long and short position because the trader can easily depicts the divergence of market by using this Indicator although in parralel you can use stochastic indicator for better understanding.
Held my opinion for this indcator is very strong because my own trades are balanced by using this Indicator i implemented Bichi strategy with this Indicator howbiet a perfect match i observed, many traders use macd and stochastic indicator with that so setting your strategy is another game, i liked bichi strategy with this sounds good for me.
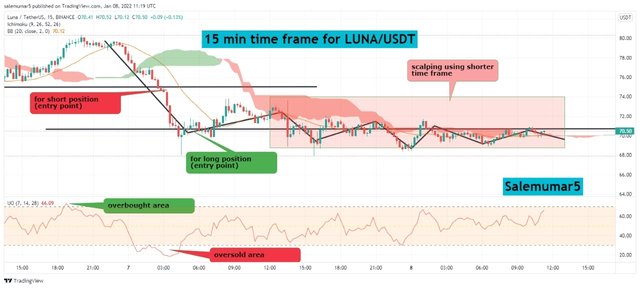
TIME FRAME analysis is one of the most efficient and important aspect for trade, i ultimately use 15 mins time frame because the indicator advance its maneuver skills in volatile market, though by choosing shorter time frame can be good combination although am using bichi strategy in parralel thus it gives me average profit in scalping.
Shorter time frame:
The chart below you can see that luna/usdt with 15 mins time period. You can see theoverbought area where the price show downward direction and the support is also break bichi strategy also satisfied short position and good fruitful profit has been observed although ultimate oscillator also signals us for better opportunity in trade, entry price 74$ and 70.5$ take profit.
The next area enlightened you can see the scalping area where the price showing consolidation and UO is in overbought region here the scalpers role can be depicts as a good margin for them. A strong resistance also created by the price action though healthy profit can be extract over here but this time frame not satisfy any future trade remember.
Longer time frame:
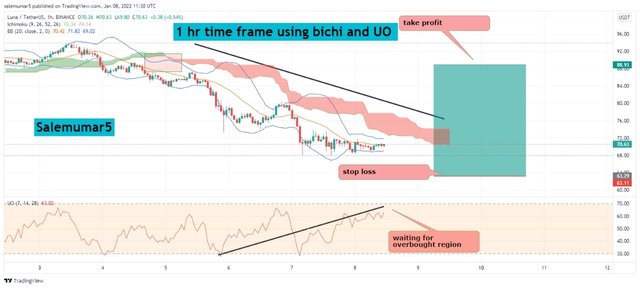
This is also the same chart but different time frame (1hr) the bullish divergence has been depcits in this market, the ultimate oscillator from oversold region make a bullish run moving upward but price in its opposite direction and bichi strategy helps me for better understanding and now perfect position in market has been settled. Traders can engage in spot trading and future trading too but for future a long/buy trade should be create and maintain your stop loss using previous bichi breakout. The entry point is 70.63$ and take profit is up to you using 1:2 risk management or using bichi previous breakout.

Question 6:

Conclusion
My opinion regarding is satisfied yet becuase this indicator extract inly healthy margin profits rather than fakeouts, traders can use this Indicator with multiple indicator and analyse the wrong and false areas in market. Likewise i used this Indicator thoroughly with bichi strategy and it reflects my trade with more accuracy.
The indicator having good momentum on price action and you can easily depicts bullish and bearish divergence easily, honestly i ain't like the calculation area because its so lengthy but its very important to understand that area becuase of health knowledge towards your trade.
Thanks professor @utsavsaxena11 acknowledging us with this healthy and convenient indicator for setting our trades for more fruitful results.
@utsavsaxena11
Downvoting a post can decrease pending rewards and make it less visible. Common reasons:
Submit
checked
Downvoting a post can decrease pending rewards and make it less visible. Common reasons:
Submit
Greetings, professor
Downvoting a post can decrease pending rewards and make it less visible. Common reasons:
Submit