This is Season 3 Week 4 of Steemit Crypto Academy and I'm writing Homework Task for Professor @cryptokraze

1)
What do you understand about the Concept of Dynamic Support and Resistance? Give Chart Examples from Crypto Assets. (Clear Charts Needed)
Introduction
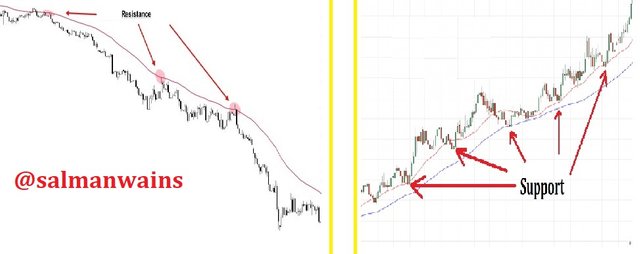
In crypto charts dynamic support are very crucial areas which tell us about trend reversals or the areas from the trend changes. These are indicated by lines drawn on charts that later act as the foundation of various trading strategies. We often indicate support and resistances through horizontal lines but when the market is evolving the support and resistance levels are dynamic and are indicated diagonally.

Dynamic support and Resistance:
A dynamic support and resistance are indicated by joining highs and highs for resistance and lows with lows continually for support with the help of a curved or diagonal line in the selected time frame. When the market evolves in a way that it does not follow pre-designed levels, we cannot indicate it through horizontal support lines and thus the market is undergoing dynamic trends.

2)
Make a combination of Two different EMAs other than 50 and 100 and show them on Crypto charts as Support and Resistance. (Clear Charts Needed)
EMA stands for Exponential Moving Averages. It is a tool deployed to determine dynamic support and resistance levels. After we apply the indicator, it determines clear dynamic support and resistance areas.
When we apply one EMA the price at times goes below it before bouncing off or may not even touch it and even sometimes it does not respect it and may crash therefore using more than EMA can be beneficial in knowing the right market entry exit signals. Here I am using a combination of 8 and 20 EMAs.
Chart: BNB/USDT
Time frame: 15m
I am using charts from coinmarketcap.com

First, I added the 8 EMA

Then I added the 20 EMA

The indicators were added to my chart. The green line indicates the EMA 20 and the blue line indicates the EMA 8.
A combination of 8 and 20 EMAs as support levels
The combination of the two EMAs increases our chances of finding the right price breakouts and helps us have a better control over the price movements. From the chart below, it is clear that the price respects both the 8 and 20 EMA and bounces off as soon as it touches the 8 and 20 lines. The price doesn't go below the 20 EMA and even if it does it does not go a lot below or beyond it. This is a clear indication that the price rejects the ongoing trend has a potential to turn upside.
Chart: Cardano/USDT
Time frame: 15 min
A combination of 8 and 20 EMAs as Resistance levels
Now I will use the BNB/USDT chart to explain how an EMA indicator can hel[ us indicate dynamic resistance level. In the chart below we can see how the price trend respected both boththe EMAs. An appreciable number of candles remained around or below the lines and those who crossed the EMA lines are scarce and even the candles do not go much higher than the EMA lines. In other words, the market is showing a clear rejection and strong resistance to continue the downtrend.

3)
Explain Trade Entry and Exit Criteria for both Buy and Sell Positions using dynamic support and resistance on any Crypto Asset using any time frame of your choice (Clear Charts Needed)
EMA lines can help us demarcate signals for entering and exiting the market both for selling and buying, as they indicate support and resistance levels. In this question I will be explaining entry and exit criteria with the help of two EMA lines.
Trade Entry criteria for buying position:
- It's better to use two EMAs, one fast and slow. In my case I will be using 8 and 20. It is because with these it is easier to locate the support and resistance levels.
- For buying positions the trends should be above the both lines. This confirms that the market is in bull.
- The first step is to wait till you see the first price pull back in a way that it touches the slow EMA or the 8 line. It is not the buying signal but an indication that there can be more to come.
- After that when you see the line grows high again and leaves the 8 line and has gone a few points above it place the buy signal.
Trade Entry criteria for selling position:
- Here again I will be using two EMA lines to have a better control over the market
- For selling positions the trends should be below both lines. This confirms that the market is in a bearish trend.
- Wait for the price to touch the slow EMA. Do not place the sell entry just here because it can be a false signal.
- Wait for the price to pull back below
- Once it has gone back below touched the EMA line and has crossed it to go a few points low you can place the sell entry.
On the whole you can see a trader gets various opportunities for entering the trade to earn maximum margins.
Trade Exit criteria
What can happen when we open a position? We can profit or the trade can go wrong. Devising a proper exit strategy both for saving profit and not getting into major losses. Following Is the exit criteria by using the EMA lines.
Trade Exit criteria for selling position:
- In the opening position we already added two EMAs in the chart for safe trading experience. Before you enter the market, the stop loss should be placed below the faster or 20 EMA line.
- It saves us from an invalid move or if the market suddenly shifts towards a bearish trend. The trade stops automatically as soon as it reaches the stop loss level.
- Setting profit is equally important and is favorable if the market goes in favor.
- Most traders go with 1:1 in which the profit and loss have the same proportions. I will also be showing you this ratio.
Trade Exit criteria for buying position:
- In the opening position we already added two EMAs in the chart for safe trading experience. Before you enter the market, the stop loss should be placed above the faster or 20 EMA line.
- It saves us from an invalid move or if the market suddenly shifts towards a bullish trend. The trade stops automatically as soon as it reaches the stop loss level.
- Setting profit is equally important and is favorable if the market goes in favor.
- Most traders go with 1:1 in which the profit and loss have the same proportions. I will also be showing you this ratio.
- The concept is further explained through charts

4)
Place 2 demo trades on crypto assets using Dynamic Support and Resistance strategy. You can use lower timeframe for these demo trades (Clear Charts and Actual Trades Needed)
I am buying Dogecoin and 15 minutes chart
When I opened the market it was in the uptrend as the price trend was above the EMA lines. I saw a bullish candle pushing above. I did not place the sell entry right there. Rather I waited for another bullish candle that touched the EMA and went above it a few points as soon as it went above I placed the sell entry. The loss to profit ratio was set to 1:1 and as indicated in the chart the trade was successful.
Following are the details of my trade
The second trade I performed was on BNB coin
Here again I am using two EMA lines 8 and 20 because they suit my trading style. When I entered the market, it was in Downtrend. A bearish candle formed which touched the 8 EMA line there was a pull back and another bearish candle formed. I waited for it to cross the EMA line and go a few points below it and then I placed the sell order. The stop loss ratio was again kept to 1:1


Conclusion
Support and resistance levels are very important to understand in order to draw technical analysis and indicate the right buying and selling points. The EMA lines help a lot in understanding the dynamic support and resistance levels and we can place right entry and exit signals according to that.
Dear @salmanwains
Thank you for participating in Steemit Crypto Academy Season 03 and making efforts to complete the homework task. You got 8/10 Grade Points according to the following Scale;
Key Notes:
We appreciate your efforts in Crypto academy and look forward for your next homework tasks.
Regards
@cryptokraze
Downvoting a post can decrease pending rewards and make it less visible. Common reasons:
Submit