This is Season 5 Week 2 of Steemit Crypto Academy and I'm writing homework task about "Trading Crypto with Aroon Indicator" assigned by Professor @fredquantum
Question# 1
What is Aroon Indicator in your own words? What are Aroon-Up and Aroon-Down? (Show them on Chart)?
Traders use different indicators to understand market momentum and trend. There are many indicators that traders use today one of them is the Aroon indicator.
The Aroon indicator is used to identify different trends. It is based on the previous highs and lows and compares current data to previous data to give results. One can also asses the strength of the trend using this indicator. It is typically applied to 25 periods and thus is plotted by default on the graph on the basis of 25 period calculation.
The concept is that a strong uptrend will see continuous highs and a strong downtrend will see continuous lows.
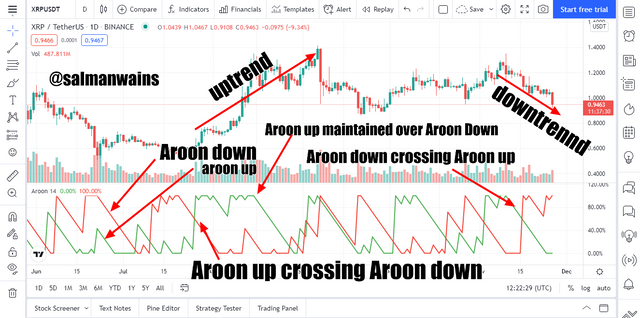
It consists of two lines called the Aroon Up and Aroon Down.
The Aroon up
The Aroon up is the line that is used to identify a bullish trend. when the Aroon up is above the Aroon down than we have a bullish trend.
The Aroon up line can also identify trend strength as when after crossing the Aroon down line it remains above it, it indicates that the uptrend is strong.
The Aroon Down
The Aroon Down line is used to identify a bearish trend. When the Aroon down line crosses above the Aroon up line it is a bearish trend. The down trend is said to be strong if the Aroon Down line remains above the Aroon up line.

Question# 2
How is Aroon-Up/Aroon-Down calculated? (Give an illustrative example)?
We use the following formulae to calculate Aroon up and Down
Aroon-Up = [(nPeriod – Periods Since the Highest High within nPeriod ) / nPeriod] x 100
Aroon-Down = [(nPeriod – Periods Since the Lowest Low for nPeriod ) / nPeriod] x 100
n period is the default period which can be 14 or 25 or can be any custom set period
Example
if n= 14 and the highest high period is 12 and the lowest of the period is 4 then
Aroon-up = ((14 - 12)/14) x 100
Aroon-Up = (2/14) x 100
Aroon-Up = 0.14 x 100
Aroon-up = 14
Aroon down= ((14 - 4)/14) x 100
Aroon-Down= (10/14) x 100
Aroon-Down = 0.71 x 100
Aroon Down=71
Form the calculation we have a higher value for Aroon down which means it is above the Aroon up line and hence the trend is bearish.

Question# 3
Show the Steps involved in the Setting Up Aroon indicator on the chart and show different settings. (Screenshots required)?
Adding Aroon Indicator in the chart is very easy.
- Go to tradingview.com
- Open any chart
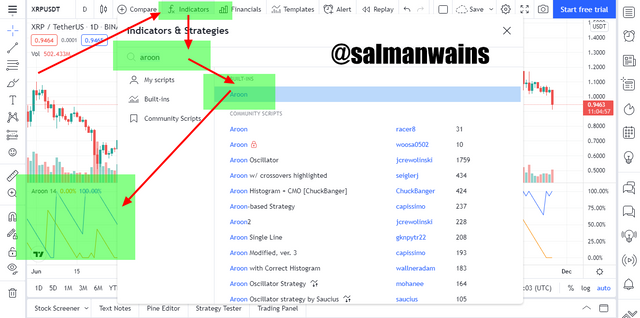
- On the top bar click on indicators
- In the search option, search Aroon
- Click on the indicator
- The indicator is added to the chart
- It consists of two lines the Aroon Up and Aroon Down
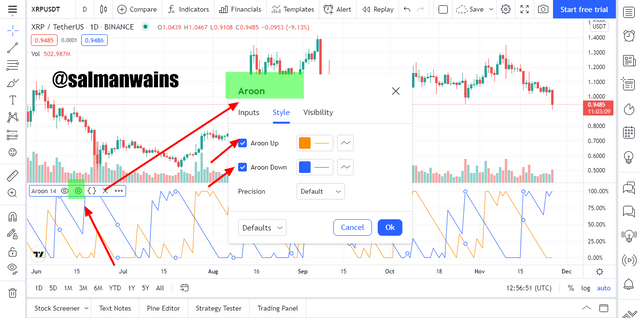
- Click on settings edit the period by default we have 14 periods
- You can also change color of the lines and their thickness etc.
The screenshots of the above steps are attached below

Question# 4
What is your understanding of the Aroon Oscillator? How does it work? (Show it on the chart, kindly skip the steps involved in adding it) ?
The Aroon oscillator is also a technical indicator that is based on the Aroon indicator. Like the Aroon indicator the Aroon oscillator is used to identify trend and trend strength. The oscillator oscillations between -100 and +100 range the 0 level is the average of the two extremes.
Bearish and Bullish Signals
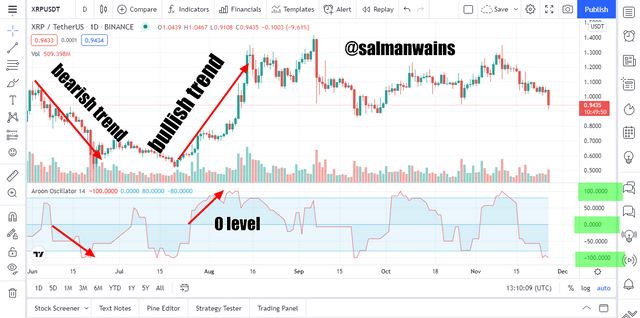
When the Aroon oscillator line moves above the O level a bullish trend is predicted on the contrary when the Aroon line crosses the 0 line to move below the 0 level a bearish trend is predicted.
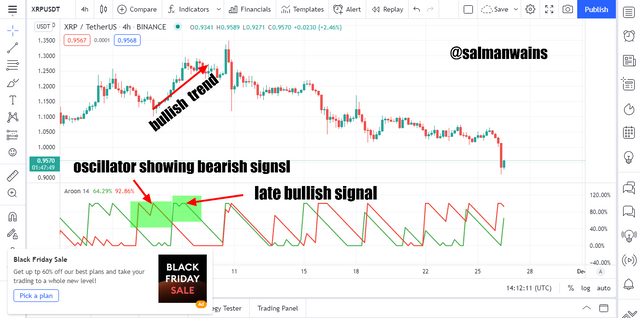
The XRP/USDT chart shows how the oscillatory line moves below the 0 line and predicts downtrend and the oscillatory line moves above the 0 line and predicts downtrend.
The Aroon indicator works on the same mechanism as the Aroon indicator and that is why calculated by the same formulae for Aroon up and Aroon Down.
The Aroon oscillator is then calculated as
Aroon Oscillato r=Aroon Up−Aroon Down
Aroon Up = ((25−Periods Since 25-Period High)/25) x 100
Aroon Down = ((25−Periods Since 25-Period Low)/25) x 100
Aroon up = 14
Aroon down = 71
Then,
Aroon Oscillator=14-71= -53
the value is below 0 thus the trend is Bearish.

Question# 5
Consider an Aroon Indicator with a single oscillating line, what does the measurement of the trend at +50 and -50 signify ?
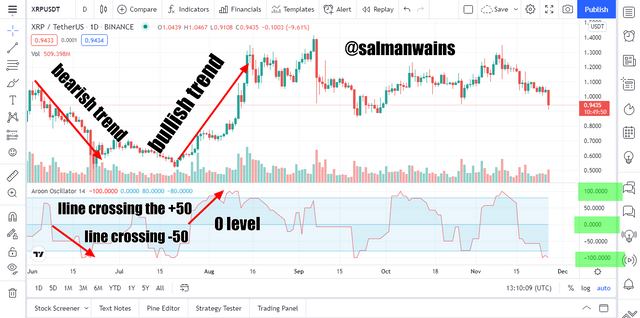
The Aroon oscillator is a single line that oscillates between the -100 and +100 range. When the line crosses the 0 line to move above it there is a possibility of an uptrend but this bullish trend is only considered strong if the price moves above the +50.
Similarly, when the Aroon Oscillator line moves below the 0 line it demarcates the possibility of a bearish trend. But this bearish trend is only strong if it crosses the -50 range.

Question# 6
Explain Aroon Indicator movement in Range Markets. (Screenshot required)?
A ranging market is the sideways market. In the sideways market there is a indecisive market state in which there is a comparable number of sellers and buyers and that is why there is no obvious trend.
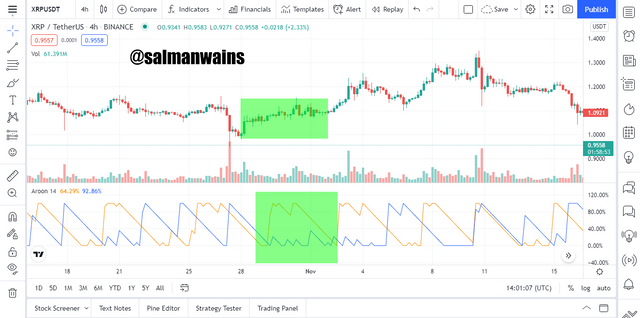
The sideways market is indicated on the Aroon indicator as two zig zag lines that do not cross.
For example, in the chart below we see a ranging market. The Aroon up and down lines do not coincide rather move parallel without crossing. This is a risky market without much increase or decrease in the price thus traders avoid this phase.

Question# 7
Does Aroon Indicator give False and Late signals? Explain. Show false and late signals of the Aroon Indicator on the chart. Combine an indicator (other than RSI) with the Aroon indicator to filter late and false signals. (Screenshots required)?
Although many traders use these indicators, they still have their flaws like all the other indicators. The most obvious problem with the Aroon indicator is that it is a lagging indicator which means that it precedes the price action and it is based on the historical price action.
False Signals
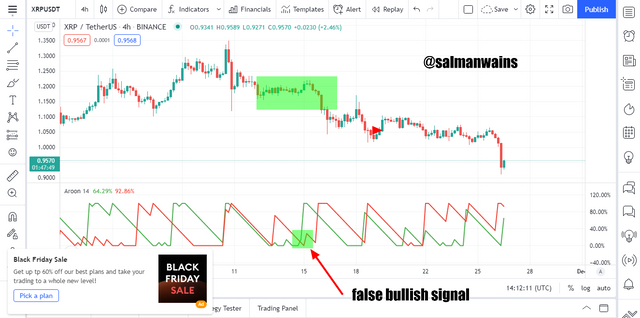
we use Aroon signal to place right selling and buying trades but some times due to price volatility or underlying trading volume we see false cross overs.
For example, in the chart above we see the Aroon up line crossing the Aroon up line but this trend was so trivial that it did not last much and did not have any impact on the price and the market saw a bearish trend. If at this point there were any inexperience trader who has not set the right risk management strategy it would have been dangerous.
Late Signals
Every trader wants to enter the market earlier to enjoy maximum profit and that is why they prefer indicators that give but with Aroon indicator they have this complain that it gives wrong signals. In the screenshot below we can see that the Aroon made a late cross over indicating the bullish trend although price already started trending up.
Filter false Signals
We already know that no indicator is 100% accurate therefore it is always better to use a combination of indicators. In similar way if we combine some indicator such as the Bollinger band with Aroon we can successfully filter false signals. The Bollinger band is a lead trend indicator that is used to identify trend direction market volatility.
As a leading indicator it gives quality to our analysis as it predicts the price action before it happens. It acts as a good combination with the Aroon which is a lagging indicator.
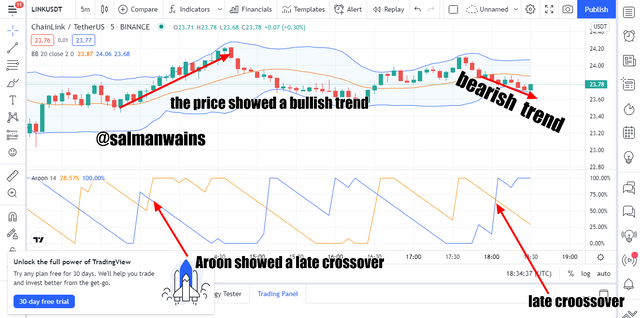
In the LINK/USDT chart above we can see that the price climbed the mid line of the Bollinger bands and the price started trading bullish but Arooon indicator showed a late crossover. The combination setup of the Aroon and Bollinger band helped us to filter this late signal and respond early. Similar the bearish trend started but the crossover of the Aroon down to Aroon up was late.
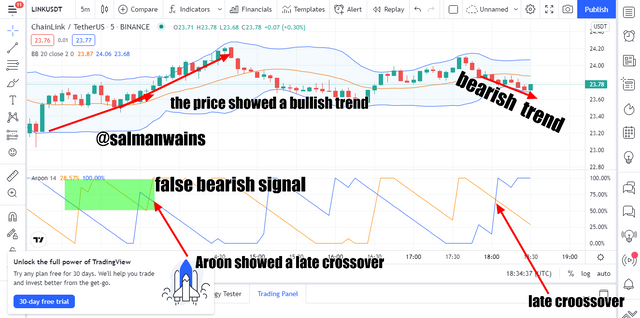
Another thing that we noticed is that the green box shows a false bearish signal while the price was really bullish. At this point too the Bollinger and helped us filter the false call.

Question# 8
Place at least one buy and sell trade using the Aroon Indicator with the help of the indicator combined in (7) above. Use a demo account with proper trade management. (Screenshots required)?
Buy Order
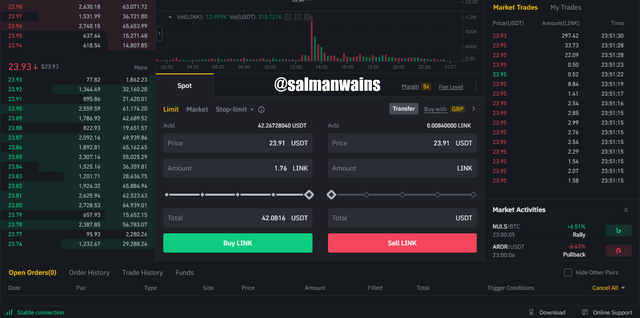
When I entered the market the Aroon indicator shoed a crossover in which Aroon up crossed over the Aroon down. I checked on the Bollinger indicator the price line was crossing the mid line to go up. Thus, a bullish trend was confirmed. Once I saw a bullish candle forming, I placed a buy order. I placed stop loss and stop loss in the ratio in 1:3.
The order went well
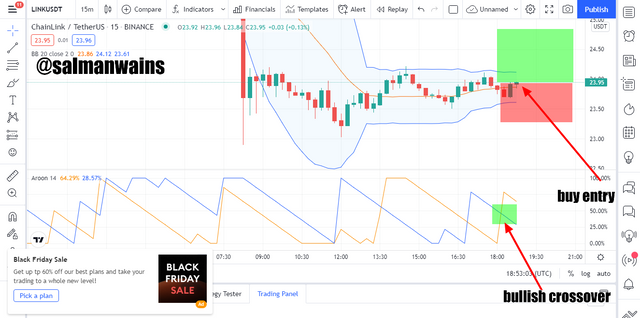
As anticipated the market moved in uptrend and the trade went well
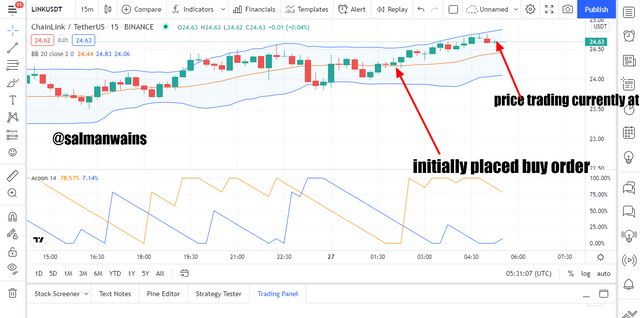
Following are my order details

Sell order: XRP/USDT
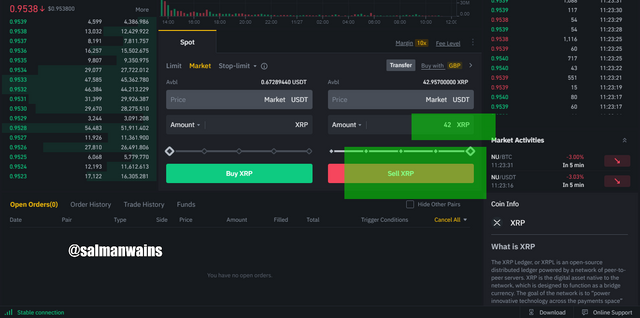
When I entered the market, I saw a bearish trend. The bearish price line was just crossing the Bollinger midline. The Aroon indicator also showed a bearish crossover indicting a good bearish trade setup. I waited for the formation of a bearish candle that crossed the Bollinger midline. I placed the sell order instantly. The stop loss and take profit ratio was set as 1:3.
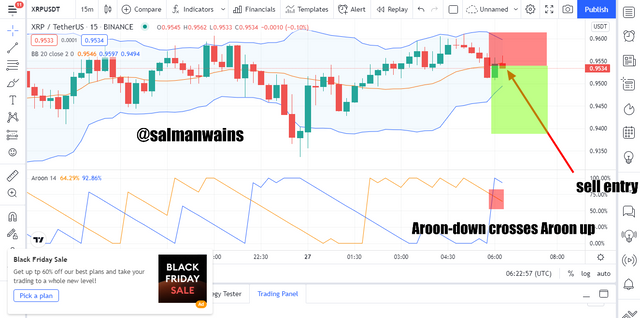
Following are my order details


Question# 9
State the Merits and Demerits of Aroon Indicator?
Following are the advantages and disadvantages of the Aroon indicator:
Pros
- When used in combinations with other leading indicators Aroon indictor can prove as an ideal indicator to confirm buy and sell signals.
- You get dual information both bout its trend direction and strength by using the Aroon indicator
- Due to the two lines its crossovers and trend indications are quite clear
Cons
- the major drawback of the Aroon indicator is that it is a lagging indicator and that is why a trade setup consists of only Aroon indicator might not be ideal.
- it gives false crossovers and thus trend indications
- it may give late crossovers and thus trading using it may not be too profitable
- though as an indicator it should predict the price in most cases the Aroon indicator in turn depends upon the price and it is affected by the price

Conclusion:
Aroon indicator is good a technical indicator to predict market trends and the strength of these trend however it may give false signals and thus it must be used with some other indicators to filter late and false signals.

Note :
All the images of the have been taken from the tradingview.com
CC:
@fredquantum

Club5050 Eligible

