Welcoming everyone to Season 3, Week 7 of the Crypto Academy lecture. Thank you Prof. @kouba01 for the Lectures.

Introduction

Trading techniques are very essential in predicting and determining trends the cryptocurrency market might go, to this end trader are employing various techniques provided to indicate the best entry and exist price points to ensure there are no losses. This techniques are represented on chats where they are easily readable while other can be plotted or drawn using available tools on the tradingview platform. One of this very important indicators is the ADX.

Discuss your understanding of the ADX indicator and how it is calculated?

What is ADX
The Average direction index (ADX), is an important indicator in determining how strong a trend is, very useful in indicating the trend direction but cannot present a good buy and sell and signals, for this reason it must be combined with other indicators for better results which can help reduce risk and also increase profits capability. ADX calculations are usually based on moving averages which are calculated over a given period and indicators are plotted on the same chart as the two directional movements line, with single lines using values ranging as low as 0 and a value as high as 100.
ADX is very instrumental in determining trend strength, therefore there already stated values which can be used to quantify both a trending and non-trending positions:
| ADX Value | ADX Trend Strength |
|---|
| 0-25 | 0 trend or Weak Trend |
| 25-50 | Strong Trend |
| 50-75 | Very Strong Trend |
| 75-100 | Extremely Strong Trend |
From the table above we can deduce that at lower values ADX experiences accumulation or distribution, however the longer ADX stays below the weak trend, the easier ability to read possible outcomes. Prices then rotates between resistance and supply to locate the best buying and selling point.
In order to perfectly read the trend strength, the direction of the ADX line must be known and considered, when the ADX line begins to rise, it also means that trend is increasing and gaining momentum which will cause prices to as well move with the direction of the trend. Furthermore, there will be a corresponding decrease in trend when the ADX line is falling, at this points price enter a level called retracement or consolidation. In the same vain ADX can also inform the trader as to when a trend is gaining or losing momentum and which indicates the speedy movements in price of stocks. When this is considered we can say when ADX experiences a number of higher peaks they it can be concluded as a period of gaining momentum whereas a series of lows depicts a decreasing momentum in the trend respectively.
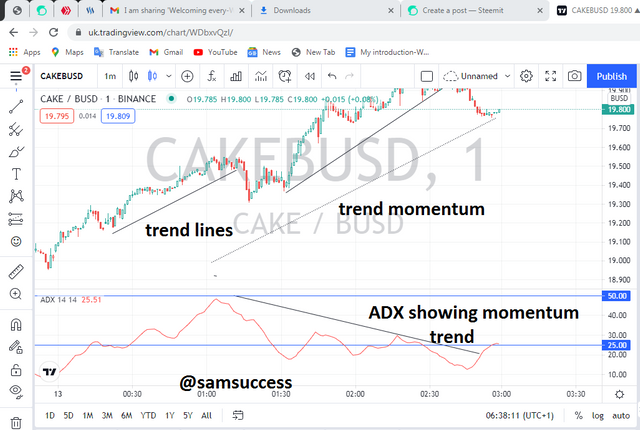
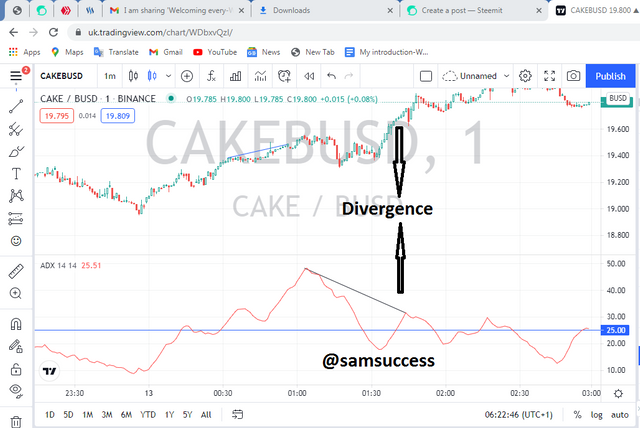
ADX can also show momentum divergence, this can be successfully seen when we consider the price to the movement of ADX which could either be "negative" or "positive". At this period the trader is informed of an incoming change in momentum though often seen as signal for reversal. If the price makes higher high and ADX makes a lower high then we could call that a negative divergence otherwise it is a positive divergence.
How is it calculated
In order to calculate ADX, we must first locate the negative and positive movements often represented by +DM and - DM respectively. The directional moves can be found by movement upwards or by subtracting the current high from the previous high and then movement downwards or by subtracting the current low from the previous low.
Further calculations are considered when the upward move is greater than the downward move and greater than zero then, we can say that +DM is equal to the the upward move otherwise it is considered as zero, this also the same case when calculating the - DM.
we could use a derived formula to determine ADX values:
+DI = (smoothed+DM/ATR) x 100
-DI = (smoothed -DM/ATR) x 100
DX = (+D - -DI/ +DI + -DI) x 100
ADX = (Previous ADX x 13) + Present ADX/14
Where: +DM is the directional movement =Present highs - Previous Highs, -DM = Previous lows - Current lows, and ATR is the Average True Range.
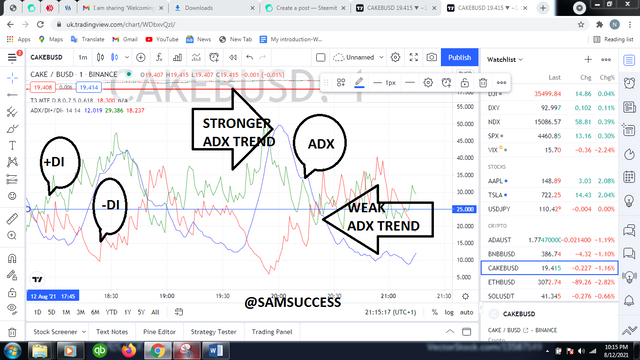
An example is shown below in a CAKE/BUSD pair respectively. Within a 7 days period, we can observed the inclusion of the +D1 and - D1 in the chart above. The ADX indicator has be included with a line showing a value of 25.09. Few period rallied below 25 but have been able to stay between 25 and 40 which indicates a strong trend.

How to add ADX, DI+ and DI- indicators to the chart, what are its best settings

How to add ADX, +D1, and - D1
- For successful use of the indicators, you must first create and account on the trading view site
- Login into your account
- Accept the 30 days free trial period to access limited functions
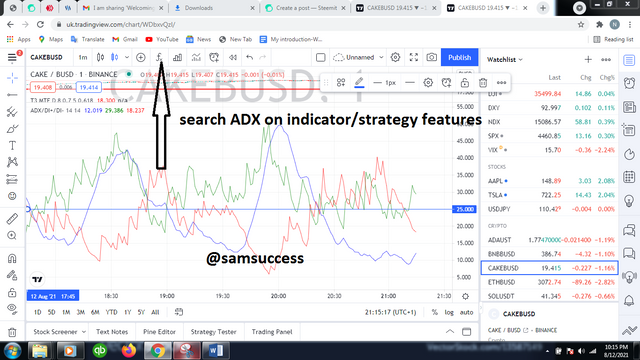
search indicator/strategy
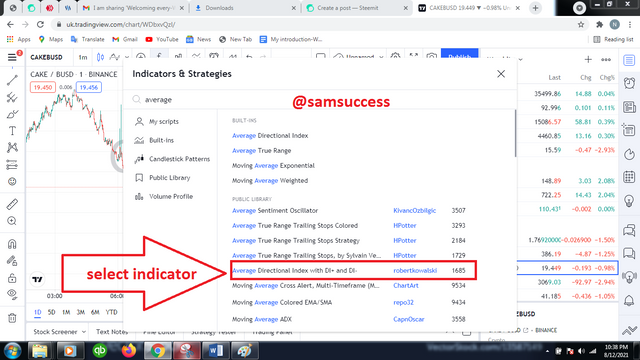
select indicator
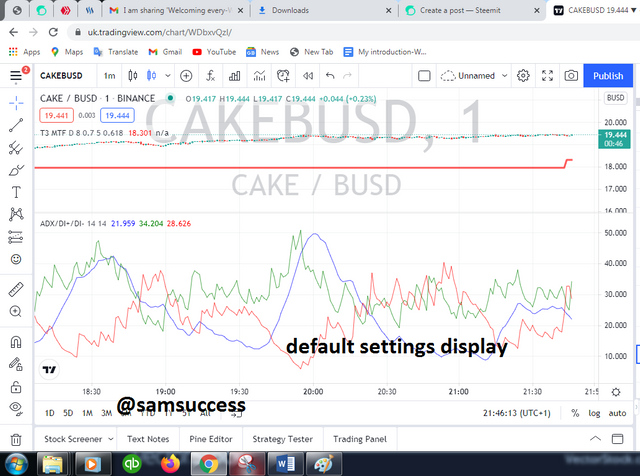
default settings
- Manipulating settings for better results
From the above setting we can observe that the default setting is at 14 on 14, however we must remember that ADX focuses on the specified number of candles with a given period. In order to obtain a more accurate information it is necessary we take a long width to avoid inconsistencies. The same principle applies to obtaining Moving Averages on the chart, the same reason most traders choose to use 50 days MA and 200 days MA. This is done to get a better view of what the market is project.
Let's consider some adjustments to observe what happens as a result of changing the default settings:
Lower settings will make the price movements respond quickly but will present more false results.
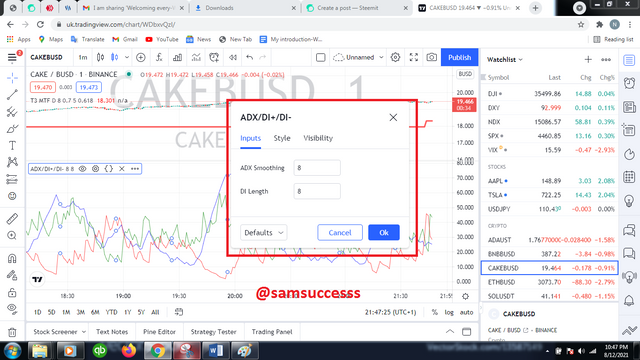
manipulating setting on ADX+D1-D1 8,8 indicates not reliable because period considered is quite small.
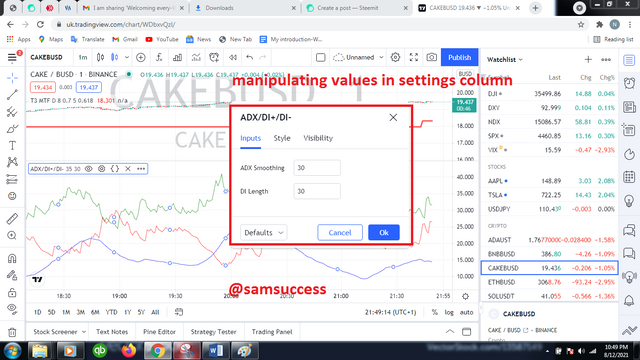
manipulating settings
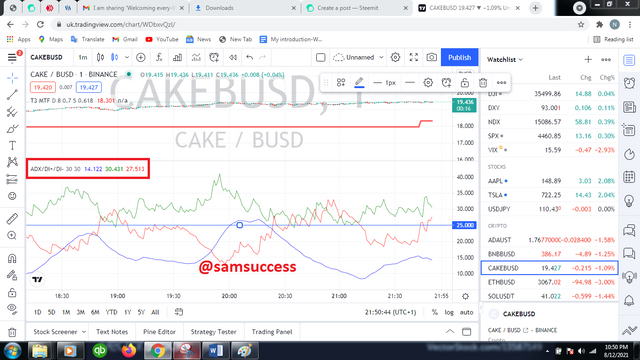
outcome of ADX+DI-D1 30 30 settings
Trend reading with this settings are usually to produce a more obtainable result which traders can rely on as it is considered over a large period.

Do you need to add DI+ and DI- indicators to be able to trade with ADX? How can we take advantage of this indicator?

I believe the answer is No, the trading view its provide other indicators that can be added to the ADX, an example of this is the RSI indicator. The ADX indicator can work independently to check the strength of a trend. ADX helps traders to strongest and most rewarding trend to trade, the values are key information provider when using ADX as it tells the trending and non-trending periods.
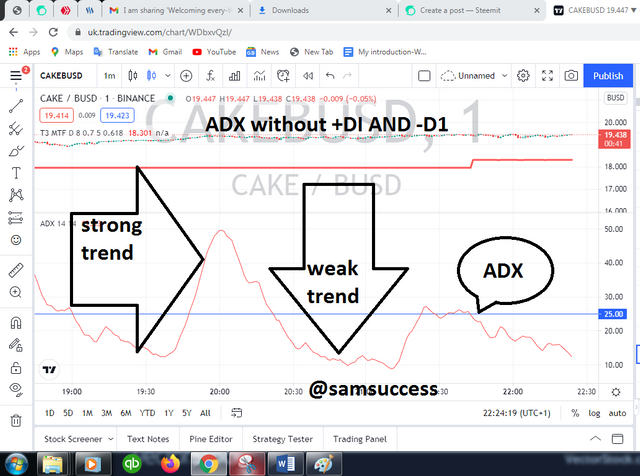
However, when the readings have past 25 it indicates a strong trend signal which then causes prices to move up and down between resistance and support levels.

Explain what a breakout is. And How do you use the ADX filter to determine a valid breakout?

The term breakout is usually used when the price of a token moves above its resistance level or below its support levels, usually when breakout occurs it is expected to have a trend towards the direction of the breakout. For an example, if there is breakout pass resistance level an upward trend in price is usually or if it breaks its support level a downward trend is expected, it must always move in the direction of the breakout.
It is called a breakout because the price had remained within a level (either support or resistance) for awhile and traders see this a potential indicator to determine either an entry or exist points in their trade which are usually harnessed through charts. An example is seen below
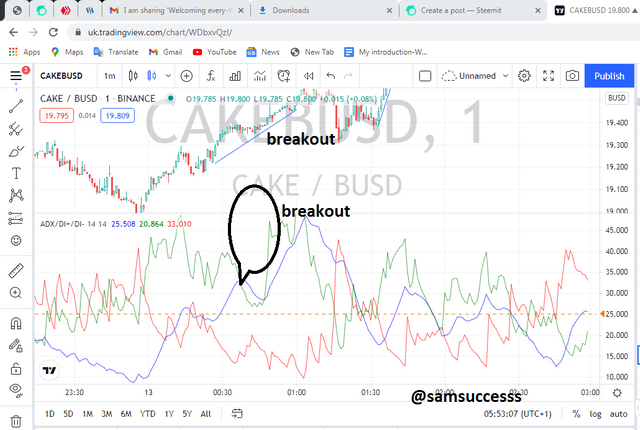
From the graph we could see a potential breakout from ADX value of about 30 which breaks us to a strong trend upwards.
How to use ADX filter to determine a valid breakout
Breakout can be daunting most times and we can utilize the ADX to a certain fake or valid breakout. As stated earlier in this homework, that ADX is an indicator that measure the strength of a trend and can work as a leading indicator which exposes the strength of the market before the actual breakout occurs. The ADX line is usually displayed between the +DI and - DI lines respectively and can be used in addition with the ADX values to know the strength and vitality of a trend. The ADX lines varies from 0 to 100, values between 0 and 20 are trend less conditions which are also called consolidation and must be avoided at all cost. Values from 25 and above show strong trends but as the value moves higher to 40 the trend becomes more stronger and valid.
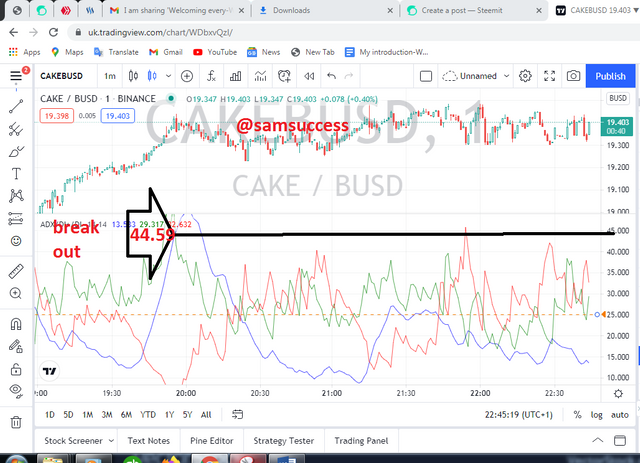
In summary traders who deal mostly on breakouts should avoid making trades when ADX value is low (that is below 25) to avoid consolidation.

What is the difference between using the ADX indicator for scalping and for swing trading? What do you prefer between them? And why?

It is important we discuss the meaning of scalp and swing trading in this section
Scalping
This is a process of trading where an investor or a trader attempts to make great profits within a smallest possible period. They are very fast investors and work with time as the slight possible minutes could case serious losses or gains. Scalping require strength, time, commitment, and the make Alots of trades at once making little profits from almost all of them.
These trades are fast and want to make profits with a short possible time, ADX indications is designed with value that shows a breakout, which is accepted to be from 25, a scalp trader wouldn't want to know if the breakout is fake or not, at the start of the breakout stage, a scalp trader invest immediately. In summary using ADX for scalping require dedicated watch of the breakout levels.
Swing
Swing traders on the other hand are patient traders who carefully observes the market trends using different indicators and carefully observing the candles. A swing trader takes advantage of any small price action over an entire trend period. Like I said earlier, they observe the chart using indicators such as moving averages, RSI, etc and are able to determine swing highs and lows as they may occur.
My preference
I would prefer the swing trading since a proper study of the market is carried out to ascertain the various trend strength, as we know ADX does not inform us of a time of market entry or exist but with the combinations of the +D1, - D1 and the ADX values, we can make reasonable conclusions.

Conclusions

ADX is quite a great tool for traders as it can be employed even in forex, stocks, etc. This can help traders build trades having studied the ranges of values in other to ascertain when a strong trend begins. The ADX tool is also very more useful when paired with other indicators for a better experience.
There are some disadvantages such as crossover between indicator could pose a challenge which can confuse a trader and leads to false interpretation. Secondly, it is advised that ADX be combined with other indicators that can help filter signals and control risk that could arise.
Finally, ADX is known as a trend indicator and informs the trader on the extent of the trend which can help in risk management. ADX is a no miss for trend traders.

Thank you
Reference 1
Reference 2
Reference 3
Reference 4
Reference 5


